


1. Introduction
ChatGPT is an advanced language processing technology rooted in artificial intelligence techniques, which facilitates efficient communication and interaction between individuals [1-3]. Its development holds the potential to enhance humane human-computer interaction and services in many fields, providing the basis and support for the further innovative development and popularization of human-computer interaction technology. Hence, the recent news, the connection of ChatGPT to Microsoft [4], not only makes Microsoft products become smarter and more user-friendly, but also will give rise to more revenue and opportunities for Microsoft. And thereby, the incident is crucial to Microsoft, society and even the whole world. All parties should attach great importance to it and work together to improve the prediction technology and use the tools to identify the tendency of it. According to all great impacts above, the event definitely will bring about unexpected fluctuations of stock price of Microsoft since its connection to Microsoft leads to more business opportunities and industry upgrades, driving the development of human-computer interaction technology. In this case, the prediction of its impact cannot be ignored. This is because technologies related to machine learning are becoming an integral part of the technology industry, and GPT models are one of the most popular and widely used natural language processing technologies today. If Microsoft adopts GPT technology and integrates it into its own products, it may give the company a certain technological and market advantage, which could have a positive impact on Microsoft stock. Also, innovation and technological advancement are very important for companies in the technology sector. If Microsoft is able to successfully develop and apply GPT technology, it will help to improve the company's reputation and competitiveness, which may in turn have some positive impact on the price of Microsoft shares.
Event study is a method of analysis in economics and finance used to explore the impact of a particular event on prices or other financial variables and is widely used in event analysis and investment decisions in financial markets. With the development of data analysis, machine learning and other fields, some new research methods and techniques are gradually being applied to Event study, so that it continues to evolve towards greater efficiency and precision. And thereby, increasing scholars are using event studies and stocks to forecast. For example, Dai and Zhang [5] presented an application in predicting stock trends based on machine learning. The article explores the most accurate model in predicting stock prices respectively in short-term and long-term. They used a dataset inclusive of stock price of3M Stock from1/9/2008 to 11/8/2013(1471 data points) from Bloomberg Database. Additionally, the datasets comprise 16 features. And they used labeling: "1" if the closing price is higher than the previous day, or "-1" to symbolize closing price is lower. As for the short-term model, they explored the performance of models: Logistic Regression, Gaussian Discriminant Analysis (GDA), Quadratic Discriminant Analysis (QDA) and Support Vector Machine (SVM). It turns out that the best fitted model is QDA, reaching to an accuracy of 58.2%. As for the long-term model, they've explored the accuracy of long-term prediction with the same 4 models: GDA, Logistic Regression, QDA and SVM. It ultimately turns out that when the time span is 44 days, SVM has the highest accuracy (79.4%). It's the most stable model as well. In addition, Son et al. presented the event study doing research on preannouncement effects on Apple's supply chains [6]. The article identified the preannouncement effect based on Apple 6 and 6 Plus. It has access to Apple's global suppliers’ data from Yahoo Finance and Google Finance. The datasets comprise 108 Apple's global supplier stock prices and 10 stock exchange indices. Then they set the estimation window from -250 to -30 and the event window from -20 to +20 days. After preparing for the windows, they used the model event study to figure out the average abnormal returns (AAR) and cumulative abnormal returns (CAR). It turns out that the preannouncement of Apple 6 and 6 Plus has pushed the AAR and CAR of stock price of Apple's global suppliers, which suggests that iPhone preannouncements significantly have positive effects on the global supply chains under market models.
This article also uses event study based on the current literature to identify the impact of connection of ChatGPT to Microsoft [4-6]. What is prior to it, this paper also explored the model that is best fitted to the Microsoft stock among three frequently used models’ random forest, K-Nearest Neighbors (KNN), Support Vector Regression (SVR). The rest of this paper is organized as follows: Section2 provides a discussion of our approach and datasets. The experimental results and corresponding discussion will be given in Section 3. The conclusions of this work and future study are discussed in Section 4.
2. Method
2.1. Overview of the Datasets
The present study employed a dataset containing 252 records sourced from Yahoo Finance, specifically comprising Microsoft stock price information. This dataset comprehensively shows us the the stock price from 2022 to 2023 as shown in Figure 1, which provides a solid and recent basis for us to explore its most fitted model and investigate the effect of ChatGPT has on the stock price.
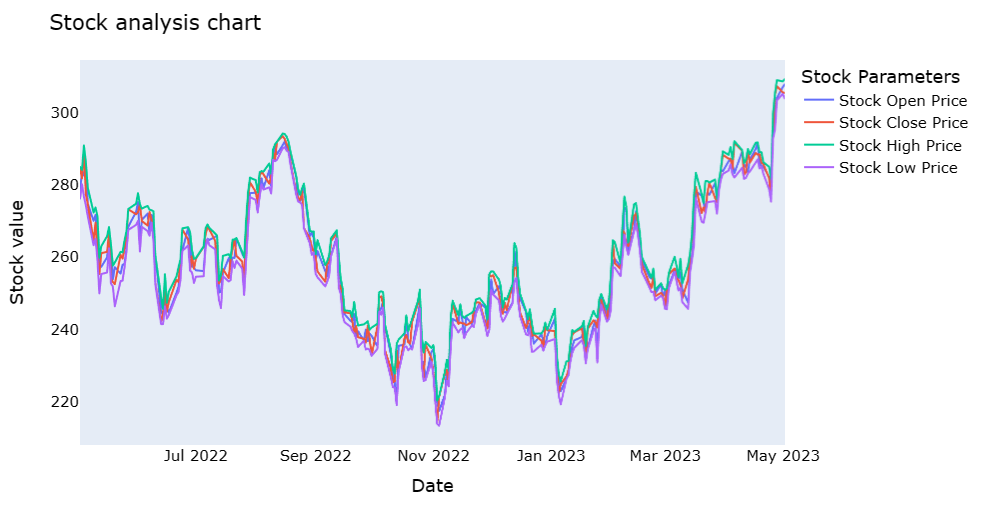
Figure 1: The stock prices of the Microsoft stock.
2.2. Dataset Preprocessing
2.2.1. Importing, Checking and Converting
This study first imported the code downloaded from Yahoo Finance and then rename each column so that it's more convenient for us to deal with them later on. Next, the null value and na value were checked to ensure the data we collected are not empty. Then converting the data field from string to Date format and making it index.
2.2.2. The Division of Training Set and Test Set
In this study, the dataset was categorized into the training, test set to explore the performance. The training set is a set of data used to train machine learning models. Typically, most of the data is used for model training so that the model learns how to calculate the relationship between input and target variables. The test set is a data set used to evaluate the performance of machine learning models. It can be used to verify whether a trained model has the ability to generalize, i.e., whether it can produce good results on new data. The validation set is a dataset used to select and tune the hyperparameters of machine learning models. However, in this article, a validation set is not used. However, in this article, the raw data is divided into two parts: first, 58% of the samples are taken as train set; then the remaining 42% of the samples are taken as test set.
2.2.3. Window of Event Study Setting
This work uses event study to find out the effect ChatGPT has on the stock price of Microsoft. Thereby, the data should be dealt with by setting windows shown in Figure 2. Event research is a technique to assess how the occurrence of a certain event affects a company's stock price or yield, and by doing so, analyzes the degree to which financial markets react to the disclosure of new information. Using this method, we can get Abnormal Returns (ARs) and Cumulative abnormal returns (CARs) in the end, which to some extent reflects the economic impact of this event. Nevertheless, before all of these, defining estimation windows, typically selected as the time frame leading up to the event, typically 210 trading days to 11 trading days before the event, event window, time period for examination of the stock price involved in the event usually lasts from -20 to 20, is significant.
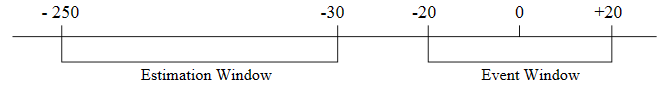
Figure 2: Window of event.
2.3. Model Selection
2.3.1. Random Forest
Random Forest [7], a widely used supervised machine learning method used for both classification and regression tasks, has garnered significant attention. This ensemble learning approach encompasses the construction of numerous decision trees during the training phase, wherein the ultimate output for classification tasks corresponds to the mode of the individual trees’ classes, while regression tasks yield the mean prediction of the respective trees.
The Random Forest algorithm consists of two main steps: the random forest creation step and the prediction step. In the creation step, a subset of features at random from the training set are drawn by the algorithm and then used to construct a decision tree. To build a forest of decision trees, this process is performed numerous times. By combining the predictions of all the trees in the forest, the algorithm uses the forest to forecast the class of a new sample in the prediction phase.
The formula for aggregating the predictions of the individual decision trees in a random forest is given as follows:
\( \hat{y}=\frac{1}{T}\sum _{t=1}^{T}{f_{t}}(x) \) (1)
2.3.2. KNN
One of the oldest and most straightforward supervised learning techniques is KNN [8]. The simplest classifier is KNN, which uses lazy learning and has no explicit learning or training process. When there is little or no prior information of the distribution of the data, the KNN method is a useful option. The K-Nearest Neighbors (KNN) algorithm is a versatile approach capable of addressing classification and regression problems. Its underlying principal entails searching for the most similar training sample to a given test sample, and subsequently employing a voting mechanism to determine the class of the test sample based on the identified nearest training sample. Additionally, the similarity between individual samples and the test sample can be utilized to assign weights to the voting process. Estimating the output, often in the form of class probabilities, can be achieved by considering the distribution of samples across different classes within the individual samples. To identify the K closest training samples, KNN employs a distance metric that quantifies the similarity between samples in the training and test sets. The commonly chosen distance measure is the Lp distance, which computes the distance as the p-th root of the sum of the absolute differences between corresponding feature values of two samples.
\( {L_{p}}({x_{i}},{x_{j}})=({\sum _{l=1}^{n}|x_{i}^{l}-x_{j}^{l}|^{p}}{)^{1/p}} \) (2)
In this formula,
\( {X_{i}}=(x_{i}^{1},x_{i}^{2},x_{i}^{3}⋯,x_{i}^{n}) \)
\( {X_{j}}=(x_{j}^{1},x_{j}^{2},x_{j}^{3},⋯,x_{j}^{n}),p \gt =1 \) (3)
When p equals 1, the distance Lp is called Manhattan distance. Its calculation formula is given as follows:
\( {L_{1}}({x_{i}},{x_{j}})=\sum _{l=1}^{n}|x_{i}^{l}-x_{j}^{l}| \) (4)
When p equals 2, the distance Lp here is called Euclidean distance. Its calculation formula is given as follows:
\( {L_{2}}({x_{i}},{x_{j}})=({\sum _{l=1}^{n}|x_{i}^{l}-x_{j}^{l}|^{2}}{)^{1/2}} \) (5)
2.3.3. SVR
Support vector machines, or SVMs, are frequently employed to address classification problems [9]. The use of SVMs in regression, however, has gotten less attention. By locating the hyperplane and minimizing the difference between the predicted and observed values, SVR tries to reduce error. Due to improved optimization tactics for a wide range of variables, SVR outperforms other algorithms like Linear Regression, KNN, and Elastic Net in terms of performance prediction. Additionally, it is adaptable in how it handles kernel functionality. By taking feature quality into account, this extra functionality improves the model's ability to make predictions. Given that the SVR technique is sensitive to the interference in the training data, the training samples have an impact on how well the SVR model fits. Additionally, SVR works well when the feature metrics are greater than the sample size and is helpful in tackling high dimensional feature regression problems.
This means that only the support vector has an impact on the functional model, and the optimized model is obtained by minimizing the total loss and maximizing the interval. To be more precise, the SVR model can be simply understood as creating a "interval band" on either side of the linear function, with a spacing of \( ε \) (a value often given especially). Regression is carried out for non-linear models once the kernel function is translated to the feature space, just like in SVM.
Its calculation formula is given as follows:
 (6)
(6)
 (7)
(7)
2.3.4. Event Study
An event study is a statistical technique for assessing how an event affects the value of businesses. Finding the anomalous return induced by the event within the theoretical model is the basic idea. The difference between the actual stock return and the benchmark market return for the same time period is the anomalous return. Event studies, which include the average abnormal return and cumulative abnormal return, are a useful tool for determining how an event impacts a company's shareholder wealth.
3. Results and Discussion
3.1. The Performance of the Random Forest
Based on the observation from Figure 3, Figure 4 and Figure 5, it is apparent that the test predicted close price of Random Forest fits the original close very precisely among the 3 models and therefore, exhibits a remarkable precision. Furthermore, from the Table 1, random forest has a higher R2 score of 0.87 than 0.71 of KNN and 0.80 of SVR, while in the aspects of RMSE as well as MSE Random Forest has lower values, which signifies that in terms of the accuracy, Random Forest has a superior performance. In conclusion, in accordance with all data shown above, it can be seen that the Random Forest algorithm performs the best among 3 of them. Nonetheless, it should be acknowledged that the KNN and SVR models also exhibit commendable performance. This result may be because this is a dataset with more features and more noise. Under such circumstances, predictions using random forest usually perform more accurately than KNN and SVR. More detailed reason may occur is given as follows: Random Forest can handle high-dimensional datasets. KNN requires the calculation of distances on all features, which is computationally too expensive for high-dimensional datasets, whereas random forest can create decision trees by randomly selecting a subset of features, improving computational efficiency. What’s more, Random Forest can effectively deal with noise and outliers. Random forest can reduce the effect of noise and outliers by building multiple decision trees and combining their predictions in a way that KNN and SVR cannot. Furthermore, Random Forest can make use of out-of-bag errors for model selection and tuning and can effectively avoid overfitting problems. In the future, the neural network may be considered in this case for further improving the performance due to their wide application in various domains [10, 11].
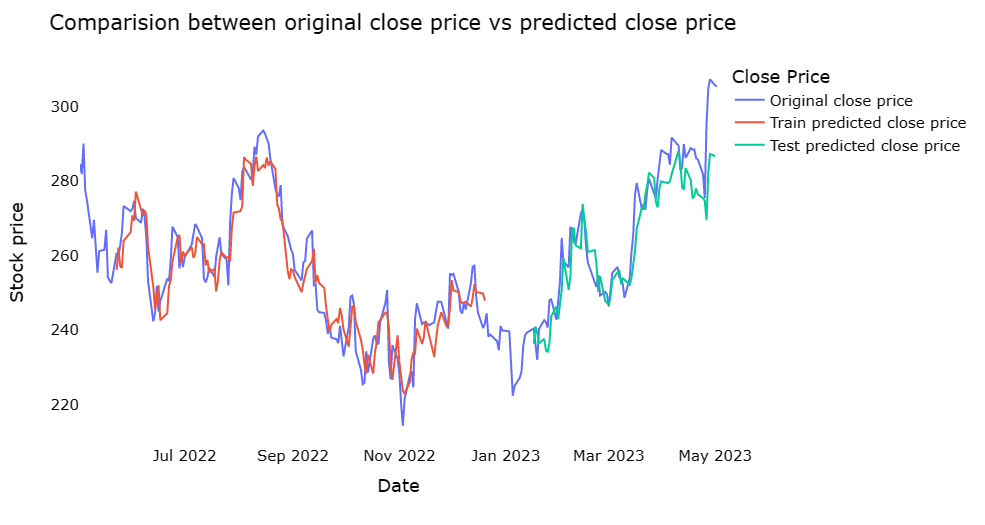
Figure 3: The comparison between original close price vs predicted close price on the SVR.
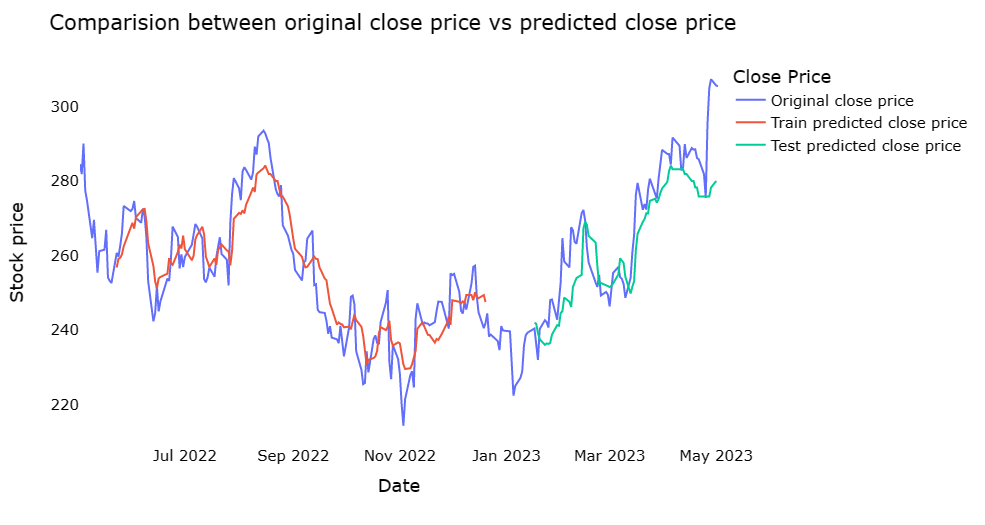
Figure 4: The comparison between original close price vs predicted close price on the KNN.
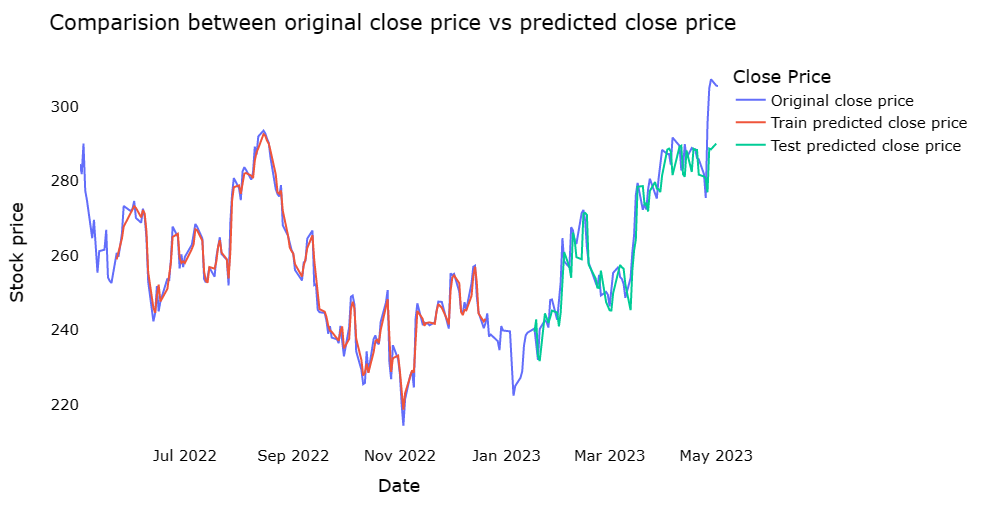
Figure 5: The comparison between original close price vs predicted close price on the Random Forest.
Table 1: The performance of the various models.
Random Forest | KNN | SVR | |
R2 score | 0.87 | 0.71 | 0.80 |
RMSE | 6.5 | 9.9 | 8.2 |
MSE | 42.3 | 97.4 | 97.0 |
3.2. The Correlation Analysis Between ChatGPT and Microsoft Stocks
According to the Figure 6 and Figure 7, since the day when the news was released (day 0.0), AAR initially falls rather than rises, then rises sharply before falling back into negative figure whereas CAR continued to build up to 0.06 over the first five days, however it dropped to 0.04 after the fifth day. This result may be due to the fact that the market reacts to new things with a lag and because stock price changes are determined by a complex interaction of market demand and supply, and the impact of a single event is limited, so the introduction of ChatGPT into Microsoft's stock has a small impact on Microsoft's stock. Therefore, the linkage of the chatbot to Microsoft cannot simply be correlated with the movement of the company's stock price. A broader corporate context needs to be considered and other factors need to be taken into account to analyse stock price movements in depth.
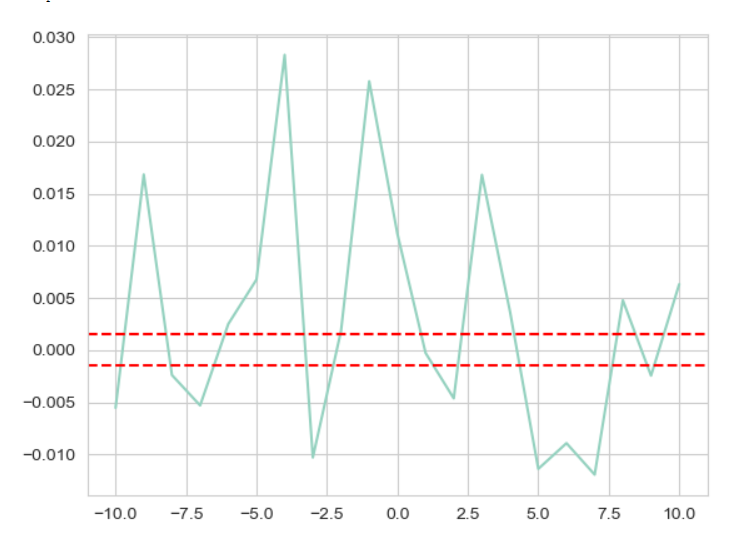
Figure 6: Fluctuations of AAR from -10 to 10.
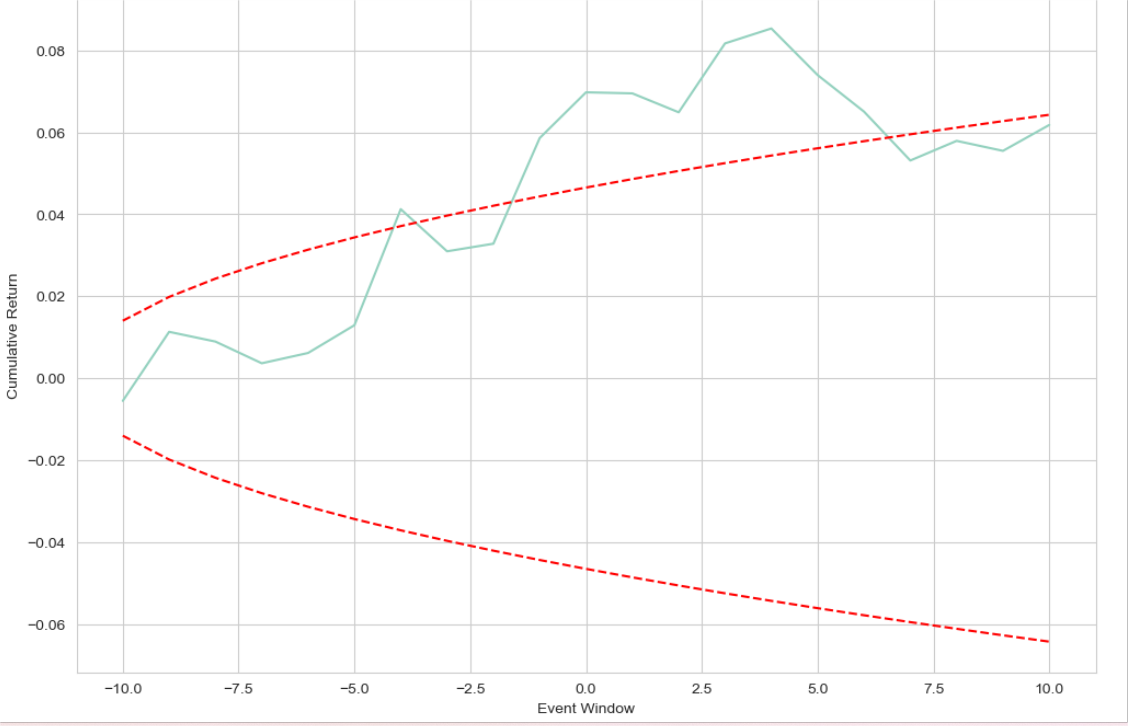
Figure 7: Fluctuations of CAR from -10 to 10.
4. Conclusion
The integration of ChatGPT into various domains has become increasingly significant in the present era. Consequently, conducting research to examine the extent to which the association between ChatGPT and stock prices, specifically in the case of Microsoft, has influenced financial markets has become a pressing matter. This study employs three machine learning models, namely SVR, Random Forest, and KNN, alongside a statistical model known as event study, to individually investigate the performance of these models in accurately predicting the closing price of Microsoft stock. Additionally, the research aims to identify the precise impact of the connection between ChatGPT and Microsoft on its stock prices. By conducting experiments and analyzing the results, it is revealed that the Random Forest model exhibits superior performance among the three models, as it demonstrates a near-perfect fit with the original data. Furthermore, it is ascertained that the influence of ChatGPT on the stock prices of Microsoft is relatively limited compared to other factors such as the interplay of supply and demand, company performance, market conditions, policy changes, and various other determinants. In the future, further study plans to try out more machine learning models to make the results more convincing and insert more other company’s stock price to identify the impact of specific events to make a comparison to explore further.
References
[1]. Lund, B. D., Wang, T. (2023) Chatting about ChatGPT: how may AI and GPT impact academia and libraries? Library Hi Tech News, 40(3): 26-29.
[2]. McGee, R. W. (2023) What Will the United States Look Like in 2050? A ChatGPT Short Story. A Chatgpt Short Story (April 8, 2023).
[3]. King, M. R. (2023) ChatGPT. A conversation on artificial intelligence, chatbots, and plagiarism in higher education. Cellular and Molecular Bioengineering, 16(1): 1-2.
[4]. Sam, S. (2023) Microsoft Plans to Build OpenAI ChatGPT Features Into All Products. The Wall Street Journal https://www.wsj.com/articles/microsoft-plans-to-build-openai-capabilities-into-all-products-11673947774.
[5]. Dai, Y., Zhang, Y. (2013) Machine learning in stock price trend forecasting. Stanford University, http://cs229. stanford. edu/proj2013/DaiZhang-MachineLearningInStockPriceTrendForecasting. pdf. Erişim.
[6]. Son, I., Lee, H., Kim, J. (2015) Preannouncement effects on apple’s supply chains: Using the event study based on iPhone 6 and 6 Plus, Advanced Science and Technology Letters, 84: 73-78.
[7]. Biau, G., Scornet, E. (2016) A random forest guided tour. Test, 25: 197-227.
[8]. Bijalwan, V., Kumar, V., Kumari, P., et al. (2014) KNN based machine learning approach for text and document mining. International Journal of Database Theory and Application, 7(1): 61-70.
[9]. Brereton, R. G, Lloyd, G. R. (2010) Support vector machines for classification and regression. Analyst, 135(2): 230-267.
[10]. Yu, Q., Yang, Y., Lin, Z., et al. (2020) Improved denoising autoencoder for maritime image denoising and semantic segmentation of USV. China Communications, 17(3): 46-57.
[11]. Brause, R. W. (2001) Medical analysis and diagnosis by neural networks. Medical Data Analysis: Second International Symposium, ISMDA 2001 Madrid, Spain, October 8–9, 2001 Proceedings 2. Springer Berlin Heidelberg, 1-13.
Cite this article
Lai,R. (2023). Machine Learning and Event Study to Explore the Influence of ChatGPT on Microsoft Stock. Advances in Economics, Management and Political Sciences,46,1-9.
Data availability
The datasets used and/or analyzed during the current study will be available from the authors upon reasonable request.
Disclaimer/Publisher's Note
The statements, opinions and data contained in all publications are solely those of the individual author(s) and contributor(s) and not of EWA Publishing and/or the editor(s). EWA Publishing and/or the editor(s) disclaim responsibility for any injury to people or property resulting from any ideas, methods, instructions or products referred to in the content.
About volume
Volume title: Proceedings of the 2nd International Conference on Financial Technology and Business Analysis
© 2024 by the author(s). Licensee EWA Publishing, Oxford, UK. This article is an open access article distributed under the terms and
conditions of the Creative Commons Attribution (CC BY) license. Authors who
publish this series agree to the following terms:
1. Authors retain copyright and grant the series right of first publication with the work simultaneously licensed under a Creative Commons
Attribution License that allows others to share the work with an acknowledgment of the work's authorship and initial publication in this
series.
2. Authors are able to enter into separate, additional contractual arrangements for the non-exclusive distribution of the series's published
version of the work (e.g., post it to an institutional repository or publish it in a book), with an acknowledgment of its initial
publication in this series.
3. Authors are permitted and encouraged to post their work online (e.g., in institutional repositories or on their website) prior to and
during the submission process, as it can lead to productive exchanges, as well as earlier and greater citation of published work (See
Open access policy for details).
References
[1]. Lund, B. D., Wang, T. (2023) Chatting about ChatGPT: how may AI and GPT impact academia and libraries? Library Hi Tech News, 40(3): 26-29.
[2]. McGee, R. W. (2023) What Will the United States Look Like in 2050? A ChatGPT Short Story. A Chatgpt Short Story (April 8, 2023).
[3]. King, M. R. (2023) ChatGPT. A conversation on artificial intelligence, chatbots, and plagiarism in higher education. Cellular and Molecular Bioengineering, 16(1): 1-2.
[4]. Sam, S. (2023) Microsoft Plans to Build OpenAI ChatGPT Features Into All Products. The Wall Street Journal https://www.wsj.com/articles/microsoft-plans-to-build-openai-capabilities-into-all-products-11673947774.
[5]. Dai, Y., Zhang, Y. (2013) Machine learning in stock price trend forecasting. Stanford University, http://cs229. stanford. edu/proj2013/DaiZhang-MachineLearningInStockPriceTrendForecasting. pdf. Erişim.
[6]. Son, I., Lee, H., Kim, J. (2015) Preannouncement effects on apple’s supply chains: Using the event study based on iPhone 6 and 6 Plus, Advanced Science and Technology Letters, 84: 73-78.
[7]. Biau, G., Scornet, E. (2016) A random forest guided tour. Test, 25: 197-227.
[8]. Bijalwan, V., Kumar, V., Kumari, P., et al. (2014) KNN based machine learning approach for text and document mining. International Journal of Database Theory and Application, 7(1): 61-70.
[9]. Brereton, R. G, Lloyd, G. R. (2010) Support vector machines for classification and regression. Analyst, 135(2): 230-267.
[10]. Yu, Q., Yang, Y., Lin, Z., et al. (2020) Improved denoising autoencoder for maritime image denoising and semantic segmentation of USV. China Communications, 17(3): 46-57.
[11]. Brause, R. W. (2001) Medical analysis and diagnosis by neural networks. Medical Data Analysis: Second International Symposium, ISMDA 2001 Madrid, Spain, October 8–9, 2001 Proceedings 2. Springer Berlin Heidelberg, 1-13.