


1. Introduction
The 2020 epidemic, which has swept the world, has had a huge impact on the global economy. The impact on the real estate market has been more pronounced, as real estate has always been an industry that fluctuates with changes in policy, environment and competitors, and the impact of the new pneumonia epidemic has made the real estate industry even more volatile [1]. China's macroeconomic operations suffered a serious impact due to the impact of the new crown epidemic. According to data released by the National Bureau of Statistics, China's economic growth slowed sharply in the first quarter of 2020, with GDP growth of -6.8% in the first quarter, down 13.2 percentage points from the same period in 2019, the first negative growth since China adopted the System of National Accounts (SNA) in 1992 [2].
For the time being, the epidemic in China has been brought under control and economic activity is gradually returning to normal. Among the more obvious short-term effects of the epidemic are real estate investment, new construction area and land transactions. In the long term, on the supply side, the epidemic will put pressure on the capital flow of real estate development companies, with higher capital requirements for housing enterprises and a further increase in industry concentration [3]. While the national commercial residential sales area will decline to varying degrees year-on-year throughout 2020, the real estate market still maintains a huge volume and once the epidemic is over, consumer demand will be released and the market will experience a small peak period of transactions [4].
In this context, it is particularly important to study the impact of the epidemic on China's A-share listed real estate companies. This paper will forecast the future and put forward some strategies and suggestions to help investors better cope with the impact of the epidemic on the real estate industry. This paper will take three representative A-share listed real estate companies, namely Jindi Group, Vanke A and China Merchants Shekou, as examples. Second, to compare the sales performance of A-share listed real estate companies affected by the epidemic and those not affected by the epidemic, and to conduct a comparative analysis. Third, to compare and analyze the sales situation of three different real estate companies affected by the epidemic. and make relevant recommendations to different types of real estate enterprises.
2. Jindi Group
Established in 1992, Jindi Group (600383. SH) is a large integrated conglomerate with real estate development as its main business. The main businesses of the Jindi Group are real estate development, property management and investment business. In recent years, the Jindi Group has been expanding its investment scale in Shenzhen and surrounding cities and actively laying out key cities. However, due to the impact of the epidemic in recent years, the Jindi Group has faced certain operational pressure and challenges. In the future, the Company should continue to consolidate and enhance the competitive advantages of its main real estate development business and strive to achieve sustainable development.
Table 1: Profit distribution table (unit: billion).
Year | 2019 | 2020 | 2021 |
Total Revenue | 634.2 | 839.82 | 992.32 |
Total Operating Costs | 499.3 | 678.78 | 908.24 |
Operating profit | 160.55 | 203.47 | 197.16 |
2.1. Financial Situation
The profitability of the Golden Land Group has been affected by the epidemic. A simple analysis of the data in Table 1 shows that total operating income has increased year on year but with it, operating costs have also increased, and the value of the increase in operating costs is relatively large, which has also led to a large fluctuation in the operating profit of the Golden Land Group's enterprises (21.09%), thus more visually reflecting the fact that GKP is more affected by the epidemic.
2.2. Analysis of Profitability
As shown in Fig. 1, although the total operating revenue and gross profit from sales are increasing from 2019 to 2022, the increase in operating revenue is smaller than the operating cost, resulting in a slightly lower gross profit margin from sales, which is decreasing year by year [5]. The small decrease in net sales margin from 2019 to 2010 and the significant decrease in net sales margin from 2020 to 2021, the consistent upward trend in operating income and the small decrease in net profit is due to the increase in operating costs of the business in 2020. Seen from Fig. 2 that the business operation has taken to expand sales in recent years, and the business momentum is good after the epidemic, but we should also pay attention to the scale and progress of the expansion, to develop the market as its corporate capacity allows, not to carry out blind expansion, affecting the normal operation of the company, the financial crisis, but to gradually and steadily improve the scale and profitability of the enterprise [6].
Figure 1: Gross profit analysis table (unit: billion).
Figure 2: Net sales margin table (unit: billion).
Seen from Table 2, the gearing ratio has been located at around 75%, indicating that its gearing ratio is high, the interests of creditors are not protected, the financial risk is relatively high, which may weaken the enterprise's ability to raise debt and also increase the risk of shareholders' return and the risk of enterprise bankruptcy, and the refinancing capacity will be reduced.
Table 2: GKP profitability indicators 2018 to 2020.
Year | 2018 | 2019 | 2020 |
Net sales margin (%) | 24.1 | 24.02 | 18.15 |
Total assets turnover (%) | 20.7 | 21.01 | 22.80 |
Equity multiplier | 4.19 | 4.07 | 4.27 |
Return on net assets (%) | 19.50 | 20.80 | 18.55 |
Gearing ratio (%) | 76.11 | 75.40 | 76.59 |
Cost Margin (%) | 38.70 | 39.10 | 32.27 |
2.3. Analysis of Operating & Development Capability
In 2022, the Group achieved operating revenue of RMB 120,208 million, up 21.14% year-on-year, and real estate projects settled with an area of 6,166,700m2, up 9.42% year-on-year, with revenue of RMB 109,181 million, up 23.56% year-on-year. In 2022, the Group's investment strategy is to focus on high-capacity cities and increase its efforts in Shanghai, Beijing and Shenzhen, with a total investment of approximately RMB36.8 billion in new projects and a total landbank of approximately 2.48 million square meters. Looking ahead to 2023, the Group believes that the real estate regulatory policy will continue to adhere to the positioning of "housing without speculation" and promote a smooth transition to a new development model for the real estate industry. As the real estate industry is facing a significant slowdown in overall scale growth, quality growth will become an important focus for market participants seeking long-term development and a necessary guarantee for enterprises to smoothly ride out the industry cycle.
3. Vanke
Founded in 1984 in Shenzhen and listed on the Shenzhen Stock Exchange in 1991, Vanke Group has achieved a leading position among many urban and rural construction and living service providers in China after years of development. In 2021, Vanke Group continued to be ranked on the Fortune Global 500, ranking 160th on the list. Vanke Group not only achieved six consecutive years on the list, but also steadily increased its ranking year by year [7]. The real estate industry experienced significant fluctuations in 2021 due to the external environment, but Vanke Group withstood the test and achieved revenue of RMB 452.8 billion in 2021, which not only did not suffer from a decline, but also increased by 8.0% year-on-year.
3.1. Corporate Solvency
Representative indicators of long-term corporate solvency are asset-liability ratio and equity ratio. As shown in Table. 3 and Fig. 3, one can see that Vanke A's asset-liability ratio was rising before the epidemic, and in 2019, in the last year before the COVID-19 epidemic, the asset-liability ratio was close to the level in 2018. However, from after the epidemic, this ratio fell significantly and the overall debt level of the company dropped. The equity ratio also maintained an almost identical trend with the asset-liability ratio in the last six years. This indicates that Vanke A's long-term debt pressure has decreased and its long-term solvency has increased after the epidemic. Seen in Fig. 3, the current ratio, the main indicator of short-term solvency, declined slowly from 2017 to 2019 before the COVID-19 epidemic, and the short-term solvency of the company became weaker. From the epidemic in 2020 until the end of the epidemic in 2022, this indicator rose very significantly, and the short-term debt pressure of enterprises decreased and short-term solvency improved more significantly. The overall solvency improvement after the epidemic should be analyzed in two stages. At the beginning of the epidemic, due to the severe situation and the alarming wind, the scale of sales of commercial properties nationwide from January to March 2020 dropped significantly, and Vanke was not spared. After March, due to the improvement of the epidemic prevention and control situation, the market had a short period of gradual recovery. In 2020, starting from the second quarter, as the epidemic intensified, the direction of the epidemic and the impact on the future macroeconomic situation were unclear, Vanke and other real estate companies did not dare to take actions rashly, the overall demand for funds decreased and financing fell, so the overall debt level of the enterprise fell and debt pressure decreased, then debt servicing capacity improved.
Figure 3: Changes in key solvency indicators.
Table 3: Key solvency indicators.
Before COVID-19 | During COVID-19 | |||||
Year | 2017 | 2018 | 2019 | 2020 | 2021 | 2022 |
Asset-Liability Ratio (%) | 83.98 | 84.59 | 84.36 | 81.28 | 79.74 | 76.95 |
Equity Ratio | 7.38 | 8.3 | 7.76 | 6.77 | 6.55 | 5.57 |
Current Ratio | 1.2 | 1.15 | 1.13 | 1.17 | 1.22 | 1.31 |
Quick Ratio | 0.5 | 0.49 | 0.43 | 0.41 | 0.4 | 0.47 |
3.2. Corporate Profitability
There are more indicators of enterprise profitability, among which gross profit margin represents the direct profitability of enterprise products, which for Vanke A is the profit margin of commodity house sales, and this indicator demonstrates the profitability of the enterprise's core main business realization. Gross profit is the largest source of profit, reflecting the cost control ability of the enterprise, net sales margin indicates how much net profit is made from each dollar of sales revenue; return on net assets is the most representative and comprehensive key indicator reflecting the profitability of the enterprise.
Table 4: Key profitability indicators 01.
Before COVID-19 | During COVID-19 | |||||
Year | 2017 | 2018 | 2019 | 2020 | 2021 | 2022 |
Operating income | 242897.11 | 297679.33 | 367893.88 | 419111.68 | 452797.77 | 503838.37 |
Annul growth rate | 22.55% | 23.59% | 13.92% | 8.04% | 11.27% | |
Net Profit | 37208.39 | 49272.29 | 55131.61 | 59298.12 | 38069.53 | 37550.91 |
Annual growth rate | 32.42% | 11.89% | 7.56% | -35.80% | -1.36% | |
Figure 4: Key profitability indicators 01.
Figure 5: Key profitability indicators 02.
From Table 4 and Fig. 4, it can be seen that Vanke's operating income rose for 6 consecutive years from 2017 to 2022. Net profit was in the rising channel from 2017 to 2019 before the epidemic, and still rose by 7.56% year-on-year in 2020, the first year of the epidemic. However, after the epidemic became more serious and entered a period of strict control, the company's net profit dropped by 35.8% year-on-year and another 1.36% year-on-year in 2022. That is, from 2021 onwards, the company's operating income and net profit are moving in different directions: operating income is rising continuously, but net income is declining. The significant decline in net profit in 2021 was due to a decline in investment income, in addition to the impairment of some projects and individual equity investments by Vanke in the face of deteriorating market conditions, reducing net profit by about 2.6 billion yuan. Among Vanke's huge revenue, the biggest impact on net profit is the gross profit of development business, the total gross profit of development business decreased by RMB 18.9 billion year-on-year in the year. It is mainly because Vanke did not respond to the high land price formed by the fierce competition in the land market in recent years, and failed to resolutely get rid of the inertia of high growth. Over-optimistic judgment on the market, investment chasing high and adventurous, and investment expectation of some large-scale projects were not realized, which led to a serious decline in gross profit margin. From Table. 5 and Fig. 5, Vanke's major profitability indicators were continuously rising from 17 to 18 years before the epidemic, and the major profitability indicators have started to decline slightly from 2019. With the arrival of the COVID-19 epidemic, the main profitability indicators for the three years during the epidemic have dropped significantly. Gross profit margin in 2022 was only 57.33% in 2017, while net profit margin has been cut down to 48.63% in 2017, and return on net assets fell to 9.45%, less than half of what it was 5 years ago. ROE is regarded by Warren Buffett as the only golden indicator to judge whether the enterprise has investment value, if it is the standard, Vanke A no longer has investment value.
Table 5: Key profitability indicators 02.
Before COVID-19 | During COVID-19 | |||||
Year | 2017 | 2018 | 2019 | 2020 | 2021 | 2022 |
Gross Profit Margin(%) | 34.1 | 37.48 | 36.25 | 29.25 | 21.82 | 19.55 |
Net Profit Margin(%) | 15.32 | 16.55 | 14.99 | 14.15 | 8.41 | 7.45 |
ROE(%) | 22.8 | 23.24 | 22.47 | 20.13 | 9.78 | 9.48 |
3.3. Corporate Value
The price-to-earnings (P/E) model is a relatively common and frequently used relative valuation model that can be used to evaluate stocks that are close to other market yields at a given time, and can also be viewed as a capital market judgment of corporate value. As shown in Table 6, Vanke's P/E ratio was closer to the industry average before the COVID-19 epidemic, and the market did not give higher valuation to Vanke because of its brand effect. This is also related to Vanke's long-term suppression of share price. After the epidemic, Vanke's operating income and net profit rose against the trend in 2020, so the P/E of Vanke in this year is higher than the industry average, and the capital market is full of expectations for Vanke. With the substantial decline in profit in 2021 and 2022 as previously analyzed, the capital market gave a timely response and the P/E for these two years is already well below the industry average. Therefore, the capital market's evaluation of Vanke and Vanke's own profitability are extremely closely related after the epidemic, basically maintaining a completely synchronized trend.
Table 6: PE ratio.
Before COVID-19 | During COVID-19 | |||||
Year | 2017 | 2018 | 2019 | 2020 | 2021 | 2022 |
Vanke | 16.31 | 9.37 | 10.76 | 8.58 | 5.53 | 9.4 |
Industry Average | 17.23 | 9.91 | 10.4 | 8.2 | 8.76 | 47.1 |
4. China Merchants Shekou
Since the beginning of the outbreak in 2019, the real estate industry has been affected to different degrees, with many regions requiring the cancellation of offline house viewing and purchasing activities or limiting the number of offline receptions, which affected the enthusiasm of the public for purchasing houses; the epidemic caused many basic industries to come to a prolonged halt, and the decline in income of some people was also an important factor affecting the purchase of houses. In response to this situation, many policies were formulated at the national and corporate levels: during the 2020 epidemic, Wuhan and Changchun introduced relevant policies including lowering pre-sale standards and relaxing pre-sale funds in many places [8, 9]; the People's Bank of China increased liquidity investment and sought to solve the problem of tax refunds retained by small and micro enterprises [10].
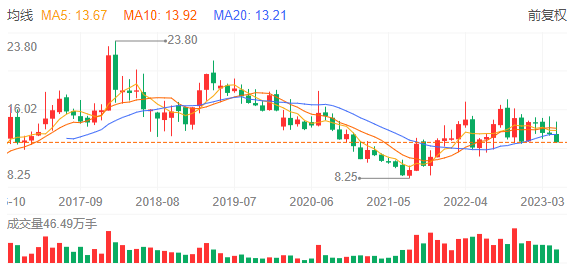
Figure 6: K-line chart of China merchants shekou.
China Merchants Shekou Industrial Zone Holdings Company Limited, also known as China Merchants Shekou, was established in 1979 as a flagship company with its main business in the real estate segment. As of May 24, 2023, the share price of China Merchants Shekou (001979) was RMB 12.32, trailing Vanke A (000002) at RMB 14.11 and Poly Development (600048) at RMB 12.88. Under the influence of the 19-22 epidemic backdrop, most Chinese real estate developers' A-shares trended downward, and China Merchants Shekou's A-share trend in the past two years has significantly lagged behind that of real estate companies represented by Poly, and also far inferior to that of ETF index funds [8]. The k-line of China Merchants Shekou is shown in Fig. 6, and by checking the k-line of China Merchants Shekou, we can see that the maximum share price of China Merchants Shekou in the past six years is 23.80 yuan on February 28, 2018, and the lowest share price is 8.25 yuan on August 31, 2021. By analyzing the data of the last six years, the average price of China Merchants Shekou shares before and after the epidemic fluctuates, and the average price of shares after the epidemic is significantly lower than the average price of shares before the epidemic, so it can be seen that the epidemic has a certain degree of influence on China Merchants Shekou. By checking the annual report of China Merchants Shekou, we can see that the annual revenue of China Merchants Shekou in 2019-2022 is 97.672-billion-yuan, 1296.21-yuan, 1606.43 yuan and 1830.03 yuan; the year-on-year growth rate is 10.64%, 32.71%, 23.93% and 13.92%, respectively. Based on the results, during the epidemic years, China Merchants Shekou annual revenue is still on an upward trend, the annual year-on-year growth rate fluctuates widely, and the year-on-year growth rate reaches the maximum in 2020. In order to understand in detail the impact of the epidemic on the stock price of China Merchants Shekou, the annual reports of China Merchants Shekou were analyzed from the perspective of industry and geography, of which industry statements are shown in Table 7 and geographic statements are shown in Table 8, some of which could not be unified due to classification issues, so all of them were selected for the same type of analysis in this paper. As can be seen from the table, after the beginning of the epidemic, the annual revenue share of community development and operation, the most important revenue source of China Merchants Shekou, has been decreasing year by year, the share of park development and operation has increased significantly in 2020, and the share of cruise industry construction and operation has been on the rise, but the overall share is not large and the reference is doubtful. Through the analysis of the geographical source of revenue of China Merchants Shekou, it can be seen that the revenue of China Merchants Shekou mainly comes from the East China region and Shenzhen region, and the annual revenue share in the East China region is growing; Shenzhen region is more stable in 2019-2021 and shows a significant decline in 2022; North China region only accounts for a higher share in 2020, at 13.28%; Southwest region only accounts for a higher share in 2021, at 13.7%; Jiangnan region has a higher share in 2019 and 2022, with 12.23% and 20.49% respectively.
Table 7: China merchants shekou annual industry report 2019-2021.
Year | 2019 | 2020 | 2021 |
Community Development and Operation | 86.57% | 78.12% | 79.62% |
Park Development and Operation | 12.77% | 21.78% | 20.25% |
Cruise Industry Construction and Operation | 0.66% | 0.1% | 0.12% |
Table 8: China merchants shekou annual geographic report 2019-2022.
Year | 2019 | 2020 | 2021 | 2022 |
East China | 20.69% | 20.85% | 22.94% | 24.81% |
North China | -- | 13.28% | -- | -- |
Shenzhen Region | 22.15% | 21.56% | 22.21% | 14.59% |
Jiangnan Region | 12.23% | -- | -- | 20.49% |
Southwest Region | -- | -- | 13.7% | -- |
Other regions | 44.93% | 44.31% | 41.14% | 40.1% |
In summary, although China Merchants Shekou's revenue has increased year by year, its share price has been on a downward trend. Analysis of its financial statements in recent years shows that its core industry - real estate - has accounted for a decrease in revenue year by year, and its main revenue generating regions have fluctuated, with only Shenzhen and East China showing less fluctuation. The stock price is affected by macroeconomic, political, legal and natural factors, so a more in-depth and detailed discussion and modeling is needed to understand the specific causes of China Merchants Shekou's stock price fluctuations in the context of the epidemic.
5. Comparisons
In August 2020, the Ministry of Housing and Construction and the Central Bank held a symposium for 12 key real estate enterprises, which explicitly requested to enhance the marketization, standardization and transparency of financing for real estate enterprises and conveyed the new "three red lines" financing rules, namely "the asset-liability ratio of real estate enterprises after excluding pre-receipts shall not be greater than 0.7, the net debt ratio shall not be greater than 1, and the cash to short term debt ratio shall not be less than 1". The new regulation of "three red lines" has made corresponding adjustments to the financial risk characteristics of real estate enterprises on the basis of traditional financial indicators, which is a positive step taken by the regulatory authorities in recent years to improve the supply system of the housing market and implement the long-term mechanism of real estate appropriately, and is of great significance to curb the blind expansion of highly indebted real estate enterprises [11].
5.1. Red Line 1
As can be seen from Table 9, three listed companies in 2019, the debt ratio is less than 70%, with the arrival of the epidemic, in addition to China Merchants Shekou, the other two listed companies are subject to greater impact, Golden Land Group and Vanke A net of accounts receivable debt ratio are more than 70% debt ratio is relatively large.
Table 9: Debt ratios by company net of accounts receivable.
Year | 2019 | 2020 | 2021 | 2022 |
Jindi group | 72.20% | 76.13% | 76.55% | 50.31% |
Vanke A | 76.91% | 79.73% | 81.27% | 84.34% |
China Merchants Shekou | 67.89% | 67.66% | 65.44% | 49.67% |
5.2. Red Line 2
Seen from Table 10, all three listed companies have gearing ratios below 100% in 2019-2022, with the arrival of the epidemic, Vanke A gearing ratio decreases year by year, China Merchants Shekou gearing ratio increases year by year, and Jindi Group gearing ratio decreases year by year after increasing in 2019-2020.
Table 10: Gearing ratio.
Year | 2019 | 2020 | 2021 | 2022 |
Jindi group | 84.36% | 81.28% | 79.74% | 76.92% |
Vanke A | 75.4% | 76.59% | 76.19% | 72.28% |
China Merchants Shekou | 63.19% | 65.63% | 67.68% | 67.91% |
5.3. Red Line 3
From Table 11, all three listed companies have a cash to short term debt ratio of no less than one in 2019-2022, indicating that their monetary funds are able to cover their short-term interest-bearing debt. The cash to short term debt ratios of the three companies grow slowly after the epidemic and all show a decreasing trend in 2022.
Table 11: Cash to short term debt ratio.
Year | 2019 | 2020 | 2021 | 2022 |
Jindi group | 1.730987254 | 2.28144168 | 2.39560186 | 2.0161174 |
Vanke A | 1.250273093 | 1.281902007 | 1.568441388 | 1.279155185 |
China Merchants Shekou | 1.374699812 | 1.608876676 | 2.138086319 | 2.127236815 |
6. Suggestions
In the case of Jindi Group, in 2020, in the face of the impact of the New Crown epidemic, both sales and profits of Jindi Group were affected to a certain extent. As a well-known domestic real estate enterprise, the Jindi Group should focus on improving the efficiency of sales returns, reducing financing costs and optimizing the scale of land reserves in order to better adapt to the market environment. In addition, the Jindi Group should further enhance its corporate operating capabilities through measures such as strengthening internal control management and enhancing comprehensive budget management. In the future, the Jindi Group should actively pay attention to changes in the market environment and continuously improve its operational management and profitability while ensuring the stability of corporate profits. At the same time, the enterprise should also actively explore diversified development models while maintaining its own sound development.
In terms of Vanke A, the epidemic will have a certain impact on Vanke A's short-term performance, but in the long run, the company has sufficient capital and high-quality land reserves, and will not face significant financial risks in the face of the epidemic. Vanke A should stick to its positioning of "urban and rural construction and living service provider", focus on "good house and good service", increase the reserve of high-quality projects, and continue to improve and optimize its product, service and operation power. The real estate industry continues to be in the doldrums, but Vanke A has maintained its business growth, which proves its strong brand appeal. Vanke should make full use of this brand advantage and turn it into sales advantage to increase revenue by de-stocking. Although the New Crown epidemic has passed, the reduced demand in the real estate market and the rising costs of real estate companies brought by high land prices have made it impossible for real estate companies to replicate the high development volume, high revenue and high profit margin of the past. Vanke A can vigorously implement its diversification strategy, invest in more promising businesses and transform to asset-light and high gross margin.
China Merchants Shekou is more affected in the epidemic environment. Because the industrial structure and revenue sources are too single, community revenue sources account for a relatively large share of the total revenue and are vulnerable to the general environment, such as: policy changes, population circulation, cultural development, etc. Now that the epidemic is over, China Merchants Shekou should diversify its industrial structure and stop having such a single source of revenue, thus further improving the company's resilience to risk.
7. Conclusion
To sum up, this study found that Gemdale Corporation, Vanke A and China Merchants Shekou were all affected by the COVID-19 epidemic to some extent. The epidemic sweeping across the country has caused a huge impact on the development of China's entire real estate industry. On the one hand, the size and duration of the epidemic will have a great impact on real estate demand, which mainly comes from macroeconomic fluctuations. On the other hand, the impact of the epidemic on the real estate industry lies in the fact that real estate investment, financing, production, sales and products will be affected to varying degrees. After the end of the epidemic, as real estate production and investment will resume or even accelerate one after another, the product mix and inventory structure may undergo significant changes in order to relieve capital pressure. The main contribution of this paper is to propose some coping strategies and recommendations based on the current status and development trend of the three leading companies in the real estate industry and also provide implications for the development of other real estate companies. The current study only takes three enterprises with good development status in the industry as examples for case studies, which are selected from a small number of subjects and do not represent the overall situation of the real estate industry, which may have some influence on the analysis results. Future research should focus on each level of development in the real estate industry and select multiple samples for analysis to achieve more complete and representative analysis results.
References
[1]. Fang, X.: Study on the Development Status and Impact of the Real Estate Market under the Normalization of the Epidemic. Real Estate World, 4, 6-8 (2022).
[2]. Ma, H.: Study on the Impact of the COVID-19 Pneumonia Epidemic on the Real Estate Industry and Countermeasures. Journal of Hubei College of Economics (Humanities and Social Sciences Edition), 6, 23-24 (2020).
[3]. Huang, C., Liu, D., Wu, Y., Xue, R.: Suggestions on the Impact of the Epidemic on the Real Estate Market and Countermeasures. Shanghai Real Estate, 3, 2-6 (2020).
[4]. Qie, J., Wang, C.: China's Real Estate Market in the Post-Epidemic Era. Engineering Construction and Design, 12, 4-6 (2020).
[5]. Wang, Z.: Analysis of Profitability of Jindi Group. Cooperative Economy and Technology, 22, 114-116 (2021).
[6]. Zeng, D.: Jindi Group Will Have Revenue of 120.2 Billion Yuan by 2022 and Will Steadily Adjust Its Development Model This Year. China Real Estate News, 007 (2023).
[7]. Yang, P.: Analysis of Corporate Operating Capability: Vanke Group as an Example. Investment and Entrepreneurship, 3, 146-148 (2023).
[8]. Editor G.: China Merchants Shekou: Who Abandoned You?. Stock Market Dynamics Analysis, 21, 6-8 (2020).
[9]. Qi, D., Cheng, X.: Comparative Analysis of National Real Estate Related Policies in the Context of Two Rounds of Epidemics. Shanghai Real Estate, 8, 7-9 (2022).
[10]. Cui, J.: The Current Epidemic in the Context of Real Estate Market Research and Real Estate Companies to Respond. Shanghai Real Estate, 5, 2-7 (2022).
[11]. Li, C., Mo, D.: The "Three Red Lines" and Debt Risk Resolution of Real Estate Enterprises: Trends and Recommendations. Banker, 12, 60-62+6 (2022).
Cite this article
Teng,F.;Zhang,L.;Zhao,Y. (2023). Impact of COVID-19 on China's A-share Real Estate Market. Advances in Economics, Management and Political Sciences,46,62-72.
Data availability
The datasets used and/or analyzed during the current study will be available from the authors upon reasonable request.
Disclaimer/Publisher's Note
The statements, opinions and data contained in all publications are solely those of the individual author(s) and contributor(s) and not of EWA Publishing and/or the editor(s). EWA Publishing and/or the editor(s) disclaim responsibility for any injury to people or property resulting from any ideas, methods, instructions or products referred to in the content.
About volume
Volume title: Proceedings of the 2nd International Conference on Financial Technology and Business Analysis
© 2024 by the author(s). Licensee EWA Publishing, Oxford, UK. This article is an open access article distributed under the terms and
conditions of the Creative Commons Attribution (CC BY) license. Authors who
publish this series agree to the following terms:
1. Authors retain copyright and grant the series right of first publication with the work simultaneously licensed under a Creative Commons
Attribution License that allows others to share the work with an acknowledgment of the work's authorship and initial publication in this
series.
2. Authors are able to enter into separate, additional contractual arrangements for the non-exclusive distribution of the series's published
version of the work (e.g., post it to an institutional repository or publish it in a book), with an acknowledgment of its initial
publication in this series.
3. Authors are permitted and encouraged to post their work online (e.g., in institutional repositories or on their website) prior to and
during the submission process, as it can lead to productive exchanges, as well as earlier and greater citation of published work (See
Open access policy for details).
References
[1]. Fang, X.: Study on the Development Status and Impact of the Real Estate Market under the Normalization of the Epidemic. Real Estate World, 4, 6-8 (2022).
[2]. Ma, H.: Study on the Impact of the COVID-19 Pneumonia Epidemic on the Real Estate Industry and Countermeasures. Journal of Hubei College of Economics (Humanities and Social Sciences Edition), 6, 23-24 (2020).
[3]. Huang, C., Liu, D., Wu, Y., Xue, R.: Suggestions on the Impact of the Epidemic on the Real Estate Market and Countermeasures. Shanghai Real Estate, 3, 2-6 (2020).
[4]. Qie, J., Wang, C.: China's Real Estate Market in the Post-Epidemic Era. Engineering Construction and Design, 12, 4-6 (2020).
[5]. Wang, Z.: Analysis of Profitability of Jindi Group. Cooperative Economy and Technology, 22, 114-116 (2021).
[6]. Zeng, D.: Jindi Group Will Have Revenue of 120.2 Billion Yuan by 2022 and Will Steadily Adjust Its Development Model This Year. China Real Estate News, 007 (2023).
[7]. Yang, P.: Analysis of Corporate Operating Capability: Vanke Group as an Example. Investment and Entrepreneurship, 3, 146-148 (2023).
[8]. Editor G.: China Merchants Shekou: Who Abandoned You?. Stock Market Dynamics Analysis, 21, 6-8 (2020).
[9]. Qi, D., Cheng, X.: Comparative Analysis of National Real Estate Related Policies in the Context of Two Rounds of Epidemics. Shanghai Real Estate, 8, 7-9 (2022).
[10]. Cui, J.: The Current Epidemic in the Context of Real Estate Market Research and Real Estate Companies to Respond. Shanghai Real Estate, 5, 2-7 (2022).
[11]. Li, C., Mo, D.: The "Three Red Lines" and Debt Risk Resolution of Real Estate Enterprises: Trends and Recommendations. Banker, 12, 60-62+6 (2022).