


1. Introduction
The main aim and purpose of this research report is to perform a market analysis of Starbucks Corporation. The company Starbucks Corporation is mainly an American multinational chain of roastery reserves and coffeehouses headquartered in the city of Seattle, Washington. It is regarded as the largest chain of coffeehouses in the world. As of the month of November 2021, this firm has approximately 33,833 stores almost in 80 countries, of which 15,444 are particularly located in the United States of America. The purpose of this study is to perform a competitive analysis of Starbucks Corporation, mainly looking at its financial and operational performance in the retail coffee & snacks industry.
The primary research method adopted for this study is the quantitative systematic literature review analysis method, according to which the secondary data related to the Starbucks Corporation and the retail coffee & snacks industry is collected from various secondary sources. The key secondary sources which are considered in this assessment are journal articles, news articles, web articles, financial data websites, the company's website, and other key online financial data sources. The data collected from the secondary sources will be analyzed in MS Excel software to assess the company's Cash, net debt, working capital, fixed assets, minority interest, leverage, revenue, and profit basically in the past five years, i.e., from 2018 till 2022, respectively.
Considering the significance of the study, it provides valuable insights and information regarding the past five years' historical performance of the industry leader Starbucks Corporation in the retail coffee & snacks industry, against its top key competitors in the market. Furthermore, the findings of this study will help not only the relevant stakeholders of Starbucks Corporations in assessing the firm's performance against the industry but also the investors who are looking to invest in the company because this report provides a detailed analysis of the past five years operational and financial performance of Starbucks Corporation against the industry.
2. Introduction of Starbucks
2.1. Firm information
The Starbucks Corporation started its business back in 1971 in the streets of Seattle, Washington, USA. The company Starbucks Corporation is mainly an American multinational chain of roastery reserves and coffeehouses headquartered in the city of Seattle, Washington. It is regarded as the largest chain of coffeehouses in the world [1]. As of the month of November 2021, this firm has approximately 33,833 stores almost in 80 countries, of which 15,444 are particularly located in the United States of America [1]. The purpose of this study is to perform a competitive analysis of Starbucks Corporation, looking at its financial and operational performance in the retail coffee & snacks industry [1].
The current share price of Starbucks Corporation SBUX in the NYSE is $101.87 US with a market capitalization of $116.78 billion US respectively [2]. The stock returns of the company last year were 43.18%, with an earnings growth rate of 4.20% respectively. The P/E ratio of Starbucks Corporation is 36.36, indicating that the company’s stock price generally is higher relative to its earnings. The following table presents key information regarding Starbucks Corporation [3].
Table 1: Starbucks Corporation detailed information [1].
Firm Overview | General Introduction |
Function | Starbucks Corporation, along with its subsidiaries, is the leading roaster, retailer, and marketer of specialty coffee all over the world. |
Segments | The company mainly has three segments, i.e., it is the North American segment, the international segment, and the Channel Development segment. |
Main Products | The Starbucks stores offer coffee & tea beverages, ground coffees, roasted whole beans, ready-to-drink beverages, and single-serve products [5]. |
Other Products | Starbucks also has different food products like pastries, lunch items and breakfast sandwiches. |
License Service | The Starbucks Corporation also licenses its trademark mainly through its licensed stores along with its food service and grocery accounts. |
Brands | The firm offers its products mainly under the Starbucks brand name or Teavana, Seattle's best coffee, Ethos, Evolution Fresh, Princi brands, and the Starbucks Reserve. |
Location | The Starbucks Corporation is headquartered in Seattle, Washington. But it has stores across the US, approximately 33,833 stores, almost in 80 countries, of which 15,444 are particularly located in the United States of America [1]. |
Market Share | The market share of Starbucks Corporation, as of 2022, is around 39.8%, mainly in US's retail coffee & snacks industry, making it the largest player in this industry. |
2.2. Market and Starbucks
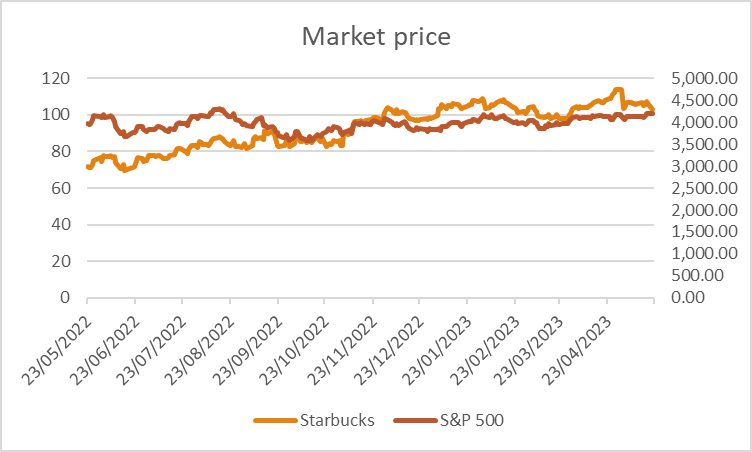
Figure 1: Starbucks Share Price vs. the Market [3].
The figure-3 above presents the comparison of the share price and market cap of Starbucks Corporation versus the S&P 500 of the retail coffee & snacks industry. According to this output, it is clear that the share value and market cap of Starbucks Corporation have risen over the S&P 500 industry average since November of 2022 and have been higher than the S&P 500 industry average ever since [4].
3. Conclusion Competitive analysis
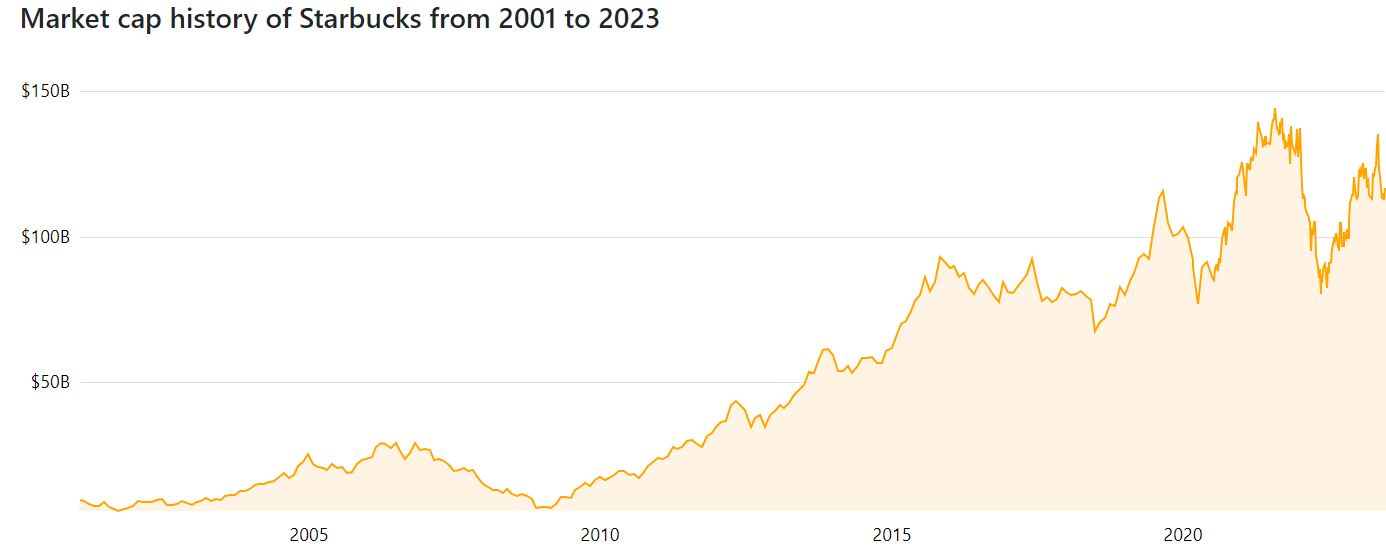
Figure 2: Market capitalization of Starbucks Corporation from 2001 to 2023 [2].
Figure-1 above presents the historical market capitalization of Starbucks Corporation from the year 2001 to 2023 respectively. It is clear from this output that the market cap of the company has risen significantly in recent years [2]. Especially from 2015 onwards, it rose to record levels, only facing a bump in 2020 due to the financial difficulties faced by the company during the Covid-19 pandemic [2].
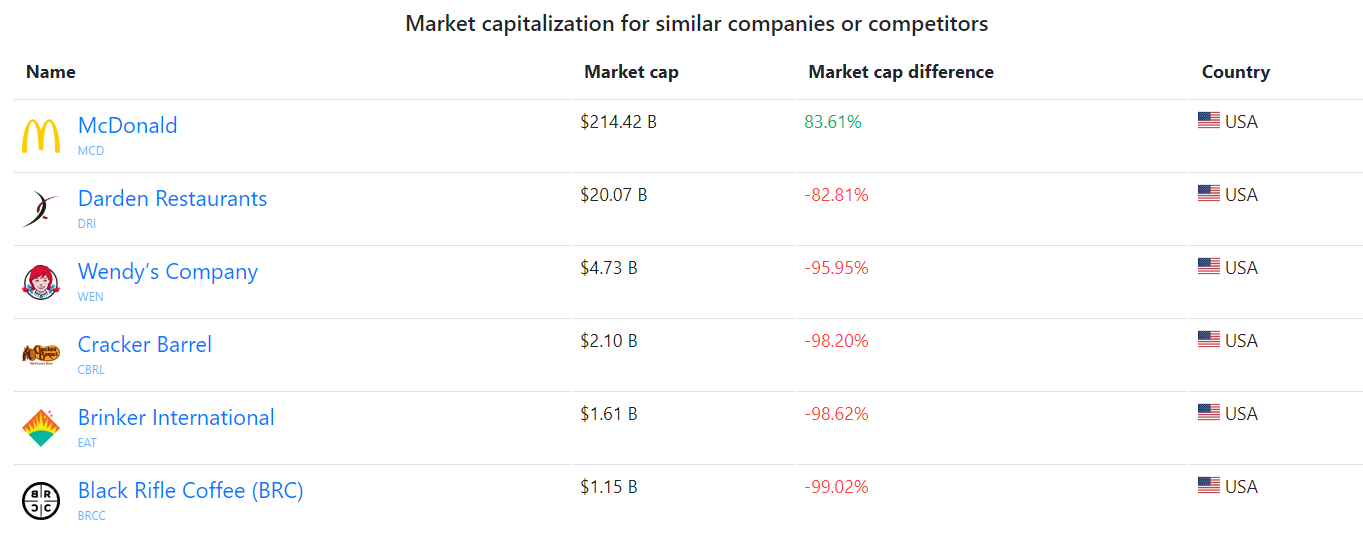
Figure 3: Comparison of Market Capitalization of top companies in the industry [2].
Considering a comparison with the top competitors of Starbucks Corporation in the retail coffee & snacks industry, the current share price of Starbucks Corporation SBUX in the NYSE is $101.87 US with a market capitalization of $116.78 billion US respectively [2]. Whereas the market capitalization of McDonald’s is $214.42 billion US, Darden Restaurants is $20,07 billion US, Wendy's Company has $4.73 billion US, Cracker Barrel has $2.10 billion US, Brinker International has $1.61 billion US, and Black Rifle Coffee BRC has $1.15 billion US [2]. The company Starbucks Corporation is outperforming all its competitors with a significantly high margin when it comes to its market capitalization, but it is only behind McDonald's Corporation, which has an 83.61% higher market cap as compared to Starbucks Corporation in the USA respectively [2].
4. Financial Analysis
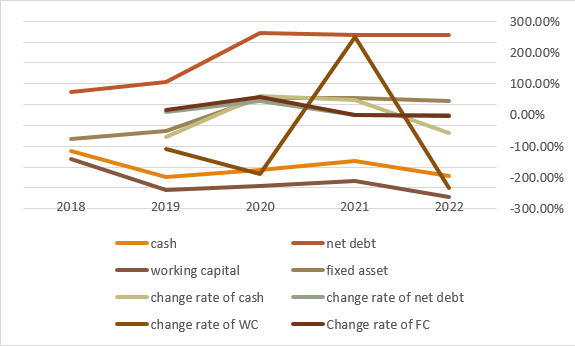
Figure 4: Starbucks Corporation Financial Analysis.
The past five-year data of Starbucks Corporation was utilized for analyzing the company's Cash, net debt, fixed assets, working capital, minority interest and financial leverage of the firm [5]. Figure 4 above illustrates the comparison of the company's past five years Cash, net debt, fixed assets, working capital, minority interest and financial leverage. From the above-illustrated chart, the net debt, and the fixed assets of the firm in the past five years show relatively stable results [6]. However, the company’s working capital and Cash have higher volatility. The minority of the company is approximately 6.3, 5.7, 1.2, 6.7 and 7.9, mainly from the financial year 2018 to the financial year 2023, which is relatively stable. For the firm’s leverage analysis, the total liability to the total asset of the firm was utilized for measuring the leverage to ensure that the ratio is almost 95%, 126.6%, 132.44%, 116.9% as well as 131.3%, respectively. It is not considered good because the financial leverage of the firm is higher than 100% value. The leverage ratio is higher than approximately 1 or 100% means that the company is a risky investment for potential investors and lenders because it has taken out a higher amount of debt instead of financing its operations through the shareholders putting it at a greater risk of financial default [7].
5. Revenue and profit
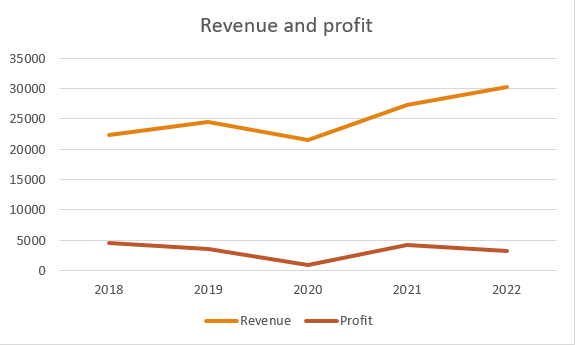
Figure 5: The Revenue and Profit of Starbucks Corporation.
Figure5 above shows the chart of Starbucks Corporation's revenue and profit comparison from the financial year 2018 to the financial year 2023, respectively. According to this chart, even though the revenues of the company have shown an upward trend in recent years, the profit of the Starbucks Corporation has decreased, indicating the high operating expenses and operating costs of the company. In the financial year 2022, the company’s revenue was $30.25 billion US, and the net profit of the company was $3.28 billion US respectively [8]. The revenues in the past five years can be declared stable for Starbucks Corporation, with an increasing trend since the 2020 financial year. However, the net profit of the company illustrates a decreasing trend since 2018, with a slight increase in 2021 after the company's financial recovery from the devastation of the Covid-19 pandemic but in 2022, the profits of the company decreased again from the previous financial year [6].
6. Profitability measurement
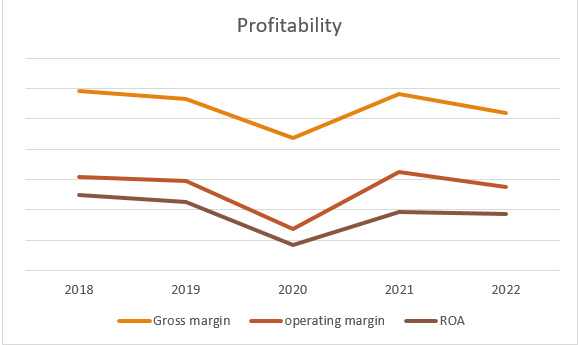
Figure 6: The Profitability Measurement of Starbucks Corporation.
Figure 6 above illustrates the chart showing the past five years' profitability results of Starbucks Corporation, looking at the Gross Margin, Operating Margin, and the ROA of the company. The fact that equity of the company was negative after the financial year 2019 as the company faced the devastating financial effects of the Covid-19 pandemic. The ROE, along with the profitability of the company in the financial year 2020, decreased. However, the gross margin, operating margin, and ROA of the company increased significantly in 2021, indicating the financial recovery of the company.
7. Starbucks SWOT Analysis
7.1. Strengths
The company has strong market leadership and the highest position in the industry. It sells its products and leverages the Starbucks brand globally. The company ensures high product quality and service, which allows it to achieve higher quality standards and the long-term trust of customers [5].
7.2. Weaknesses
Starbucks' products are very expensive compared to its competitors in the industry. High product prices decrease the number of customers that can be reached by Starbucks. The company is highly dependent on the US market.
7.3. Opportunities
Through rapid developments of the new markets, the products of Starbucks can be introduced to the new markets. Advances in technology provide the company with the opportunity of using better innovation and ideas in its products and services.
7.4. Threats
With the higher gross profit margin, along with the lower entry barriers, the competition in the retail coffee & snacks industry is high. The changing living habits, tastes, and consumer preferences pose a threat to Starbucks Corporation [9].
8. Conclusion
The conclusion that can be drawn from this analysis is that in terms of market capitalization and share price, from 2015 onwards, it rose to record levels, only facing a bump in 2020 due to the financial difficulties faced by the company during the Covid-19 pandemic. The comparison of the market cap of Starbucks Corporation with the top competitors in the retail coffee & snacks industry illustrates that only McDonald’s Corporation has a higher market cap of $214.42 billion US than Starbucks in this industry. The share price and market cap of Starbucks Corporation versus the S&P 500 of the retail coffee & snacks industry show that it has been outperforming the market average since November of 2022, respectively.
The results of the SWOT analysis of Starbucks Corporation show that the company has strong market leadership and the highest position in the industry. It sells its products and leverages the Starbucks brand globally. Furthermore, it ensures high product quality and service, which allows it to achieve higher quality standards and the long-term trust of customers. The key weaknesses which must be mitigated by the firm are that its products are very expensive as compared to its competitors in the industry. Furthermore, the high product prices decrease the number of customers that can be reached by Starbucks.
In the previous Starbucks stock analysis through the absolute valuation model, the stock price was calculated to be $94 US, and with the relative valuation model, it was $89.43, which is lower than the market price of $101.87, indicating that Starbucks Corporation stock is overvalued; thus, the recommendation is to sell the stock. The share performance analysis shows that this company will experience a stable period, and the Chinese market, along with the new products, provides great investment opportunities for the company.
References
[1]. Starbucks. (2023). Starbucks. Retrieved from Find your adventure: https://www.starbucks.com/.
[2]. Companiesmarketcap. (2023). Starbucks. Retrieved June 17, 2023, from https://companiesmarketcap.com/starbucks/marketcap/.
[3]. Yahoo. (2023). Yahoo finance. Retrieved from Yahoo finance: https://finance.yahoo.com/quote/%5EGSPC/history?p=%5EGSPC.
[4]. Moon, J., Tang, R., & Lee, W. (202). Antecedents and consequences of Starbucks’ environmental, social and governance (ESG) implementation. Journal of Quality Assurance in Hospitality & Tourism, 1(1), 1-32.
[5]. Investing. (2023, 5 23). Investing. Retrieved from Investing: https://cn.investing.com/indices/us-spx-500-historical-data.
[6]. Shim, J., Moon, J., Song, M., & Lee, W. (2021). Antecedents of Purchase Intention at Starbucks in the Context of Covid-19 Pandemic. Sustainability, 13(4), 17-58.
[7]. Ren, Y., Choe, Y., & Song, H. (2023). Antecedents and consequences of brand equity: Evidence from Starbucks coffee brand. International Journal of Hospitality Management, 108(1), 103-351.
[8]. Vollero, A., Siano, A., & Bertolini, A. (2022). Ex ante assessment of sustainable marketing investments. Italian Journal of Marketing, 1(1), 271–287.
[9]. Geereddy, N. (2023). Strategic Analysis Of Starbucks Corporation.
Cite this article
Jia,B. (2023). Competitive Analysis of Starbucks. Advances in Economics, Management and Political Sciences,47,201-207.
Data availability
The datasets used and/or analyzed during the current study will be available from the authors upon reasonable request.
Disclaimer/Publisher's Note
The statements, opinions and data contained in all publications are solely those of the individual author(s) and contributor(s) and not of EWA Publishing and/or the editor(s). EWA Publishing and/or the editor(s) disclaim responsibility for any injury to people or property resulting from any ideas, methods, instructions or products referred to in the content.
About volume
Volume title: Proceedings of the 2nd International Conference on Financial Technology and Business Analysis
© 2024 by the author(s). Licensee EWA Publishing, Oxford, UK. This article is an open access article distributed under the terms and
conditions of the Creative Commons Attribution (CC BY) license. Authors who
publish this series agree to the following terms:
1. Authors retain copyright and grant the series right of first publication with the work simultaneously licensed under a Creative Commons
Attribution License that allows others to share the work with an acknowledgment of the work's authorship and initial publication in this
series.
2. Authors are able to enter into separate, additional contractual arrangements for the non-exclusive distribution of the series's published
version of the work (e.g., post it to an institutional repository or publish it in a book), with an acknowledgment of its initial
publication in this series.
3. Authors are permitted and encouraged to post their work online (e.g., in institutional repositories or on their website) prior to and
during the submission process, as it can lead to productive exchanges, as well as earlier and greater citation of published work (See
Open access policy for details).
References
[1]. Starbucks. (2023). Starbucks. Retrieved from Find your adventure: https://www.starbucks.com/.
[2]. Companiesmarketcap. (2023). Starbucks. Retrieved June 17, 2023, from https://companiesmarketcap.com/starbucks/marketcap/.
[3]. Yahoo. (2023). Yahoo finance. Retrieved from Yahoo finance: https://finance.yahoo.com/quote/%5EGSPC/history?p=%5EGSPC.
[4]. Moon, J., Tang, R., & Lee, W. (202). Antecedents and consequences of Starbucks’ environmental, social and governance (ESG) implementation. Journal of Quality Assurance in Hospitality & Tourism, 1(1), 1-32.
[5]. Investing. (2023, 5 23). Investing. Retrieved from Investing: https://cn.investing.com/indices/us-spx-500-historical-data.
[6]. Shim, J., Moon, J., Song, M., & Lee, W. (2021). Antecedents of Purchase Intention at Starbucks in the Context of Covid-19 Pandemic. Sustainability, 13(4), 17-58.
[7]. Ren, Y., Choe, Y., & Song, H. (2023). Antecedents and consequences of brand equity: Evidence from Starbucks coffee brand. International Journal of Hospitality Management, 108(1), 103-351.
[8]. Vollero, A., Siano, A., & Bertolini, A. (2022). Ex ante assessment of sustainable marketing investments. Italian Journal of Marketing, 1(1), 271–287.
[9]. Geereddy, N. (2023). Strategic Analysis Of Starbucks Corporation.