


1. Introduction
Since its introduction by Markowitz in 1952, mean-variance theory has served as the bedrock of modern portfolio theory, emphasizing the simultaneous consideration of returns and risks. This groundbreaking theory revolutionized investment practices and introduced the Sharpe ratio as a key measure of the relationship between returns and risks. Recent market events, such as the pandemic-induced downturn, have further underscored the critical importance of diversification and effective risk management in portfolio construction [1]. However, while optimizing the risk-return trade-off and constructing efficient frontiers have been the focus of many studies, these approaches may not always align with the preferences and constraints of individual investors. In particular, individual investors with limited capital often prioritize achieving reasonable returns with controlled risks over maximizing the risk-return ratio [2-3]. In such cases, a more favorable option arises sacrificing a small degree of volatility in exchange for significant improvements in returns, as opposed to investing in market indices or funds.
To enhance portfolio performance, researchers have explored the integration of neural network prediction models into portfolio construction [4]. Deep learning models, with Long Short-Term Memory networks emerging as a popular choice, have consistently outperformed traditional machine learning models in financial time series forecasting [5]. While previous studies have primarily focused on short-term daily price predictions using technical indicators and LSTM models, the results have often been inconclusive [6-7]. In response, researchers have recognized the growing importance of model combination and fusion for more accurate price forecasting [8-9]. Leveraging the concept that market prices serve as leading indicators of economic fundamentals [10], this study adopts a novel approach by utilizing raw time series data for prediction. By focusing on weekly data, the study aims to enhance the signal-to-noise ratio and overcome the limitations associated with daily prices while avoiding the difficulty of fusing an effective complex model.
The purpose of this study is to use deep learning techniques to predict future stock prices and implement a portfolio management strategy that prioritizes returns while allowing for some concessions without losing control of risk. To accomplish this objective, a selection process was conducted to identify 12 stocks from different sectors that exhibited active trading and held significant market positions. Subsequently, an LSTM neural network was trained using historical stock price data preceding the test period, enabling the prediction of next week's stock prices based on a 24-week data window. Following the principle of buying stronger stocks and selling weaker ones, the portfolio was adjusted on a weekly basis according to well-defined rules. This iterative process was repeated for 52 weeks during the test period. Ultimately, at the end of the 52-week cycle, the returns of the strategy-based investment portfolio were compared to those generated by the NASDAQ index and a 1/n investment portfolio.
The remaining part of the paper is structured as follows: Section 2 provides, and overview of the data used and explains the process of selecting stocks. Section 3 details the methods employed, focusing on Long Short-Term Memory and the Sharpe Ratio. Section 4 evaluates the effectiveness of the proposed approach by comparing it to market benchmark and passive investment strategy. Finally, Section 5 concludes the paper and discusses potential directions for future research.
2. Data and Methodology
2.1. Data Source and Pre-process
Unlike many other studies that select stocks based on historical returns, the author believes that trading volume, as a key indicator of liquidity, is more important in the stock selection process. Therefore, this paper initially selects two most active stocks from each of the top five sectors of the US stock market by trading volume as of June 30, 2023. To ensure portfolio diversification and robust liquidity while capturing broader market dynamics through its representativeness, additional stocks with high activity or optimal β-values are included from sectors such as consumer, healthcare, finance, and industrial sectors. This approach ensures sufficient liquidity of the purchased assets and mitigates liquidity risk. Moreover, highly active stocks often have a certain degree of influence on the overall performance of their respective sectors, making them representative in nature.
According to the aforementioned rules, 12 stocks are selected ultimately and are listed in the Table 1 below. The weekly stock data used in this paper are then acquired by the Python package AKShare.
Table 1: 12 Stocks selected for portfolio management.
1 | 2 | 3 | 4 | |
Tech & Info-Tech | TSLA | NVDA | AAPL | MSFT |
Consumer Non-daily | AMZN | SHOP | NFLX | |
Consumer Daily | NKE | PEP | ||
Finance | JPM | |||
Healthcare | UNH | |||
Industrial | BA |
This paper examines all available historical data for the 12 stocks under consideration. The model is trained on data up to 24 June 2022, while the remaining 52 weeks of data from 1 July 2022 to 23 June 2023 are used to evaluate the performance of the portfolio constructed using the proposed strategy. In this paper, the post-adjusted closing price on each Friday is chosen as the weekly settlement price. This paper uses the ‘Adj Close Price’ as the weekly price \( P_{t}^{i} \) and computes the weekly returns \( {R_{it}} \) one week \( t \) as follows:
\( {R_{it}}=\frac{P_{t}^{i}}{P_{t-1}^{i}}-1 \) | (1) |
2.2. Long Short-Term Memory
Because of LSTM’s gating mechanisms for updating and resetting the hidden state, its ability to handle long-term dependencies and its superior performance over traditional RNNs has led to its widespread use in the field of financial time series data.
The gating mechanisms firstly include the input gate, forget gate, and output gate, which receive input from the current time step and the hidden state from the previous time step. The input gate determines the amount of information from the input node to be added to the current memory cell state. The forget gate decides whether to retain or discard the existing memory cell value. The output gate controls the influence of the memory cell on the output at the current time step. These gates enable the LSTM to learn the importance of different observations and selectively update or ignore information as needed. Each gate is represented by a fully connected layer with an activation function, ensuring that the gate values fall within the range of 0 to 1 (sigmoid version):
\( {I_{t}}=σ({X_{t}}{W_{xi}}+{H_{t-1}}{W_{hi}}+{b_{i}})(Input) \) | (2) |
\( {F_{t}}=σ({X_{t}}{W_{xf}}+{H_{t-1}}{W_{hf}}+{b_{f}})(Forget) \) | |
\( {O_{t}}=σ({X_{t}}{W_{xo}}+{H_{t-1}}{W_{ho}}+{b_{o}})(Output) \) |
where \( {X_{t}} \) is the input at time t, \( {H_{t-1}} \) is the hidden state at time t – 1 and all the Ws and bs are learnable parameters. The activation function used to choose sigmoid as the default option, but ReLU is now more popular. The memory cell is then updated to candidate state based on the outputs from the three gates combined with the previous cell state:
\( \begin{matrix}Candidate cell state & \widetilde{{C_{t}}}=tanh{({X_{t}}{W_{xc}}+{H_{t-1}}{W_{hc}}+{b_{c}})} \\ \end{matrix} \) | (3) |
To update the memory cell real state \( {C_{t}} \) , LSTM combines the forget gate and candidate state using elementwise multiplication (Hadamard product) and then add the input gate into it:
\( \begin{matrix}Cell state & {C_{t}}={F_{t}}⊙{C_{t-1}}+{I_{t}}⊙\widetilde{{C_{t}}} \\ \end{matrix} \) | (4) |
This design allows LSTMs to retain important information over multiple time steps by adjusting the forget gate and input gate values. Finally, to compute the hidden state \( {H_{t}} \) , LSTM utilizes the output gate in conjunction with the real state as:
\( \begin{matrix}Hidden state & {H_{t}}={O_{t}}⊙tanh{({C_{t}})} \\ \end{matrix} \) | (5) |
The output gate here controls whether the memory cell state could influence subsequent layers. Details are shown in the following Figure 1.
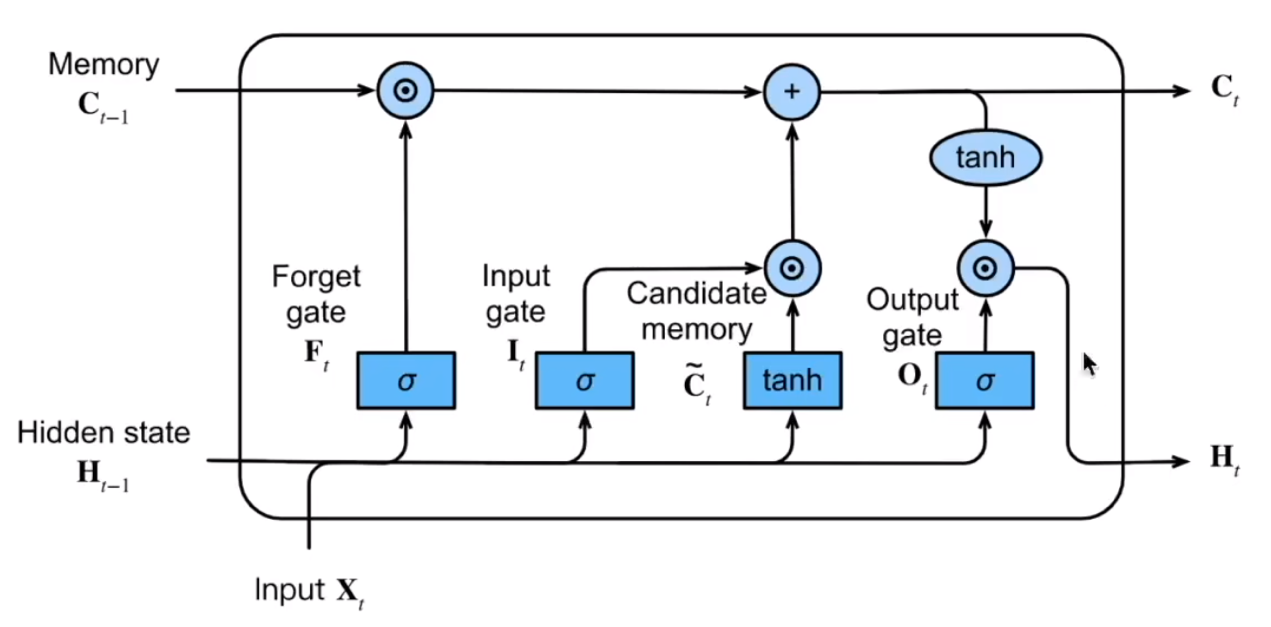
Figure 1: Structure of LSTM unit.
The diagram above depicts a single unit within an LSTM network. Each unit transmits its cell state and hidden state to the subsequent unit. An LSTM layer is formed by connecting multiple LSTM units. The LSTM neural network employed in this study was constructed using PyTorch and comprises two LSTM layers, each containing 256 hidden units. The incorporation of two LSTM layers enables the model to more effectively capture long-term dependencies present within the data. The output of the LSTM network is subsequently transformed into predictions via a fully connected layer. Given that the complexity of the dataset being processed is not too high, a single fully connected layer suffices.
This paper argues that on a weekly scale, price changes in the last six months are sufficient to reflect most implications on pricing in the next period. As such, the model is trained using 24-dimensional inputs ( \( {x_{t}}=({x_{t-23}},⋯,{x_{t}})∈R \) , where \( {x_{i}} \) represents the adjusted closing price for week t) and produces several single-step predictions \( \hat{{x_{t+1}}} \) as outputs.
2.3. Sharpe Ratio
Although this paper attempts to avoid constructing investment strategies and portfolios based on the efficient frontier derived from the mean-variance theory proposed by Markowitz in 1952, it still uses the Sharpe ratio, which also originates from mean-variance theory, as a measure of risk-adjusted returns for the portfolios constructed in this paper.
The Sharpe ratio is a highly effective tool for measuring portfolio performance. It compares the expected return of a portfolio to the risk-free rate by calculating the difference between the two and dividing it by the standard deviation of the portfolio. The numerator of the Sharpe ratio represents the excess return of the portfolio relative to the risk-free rate, while the denominator represents the risk level of the portfolio:
\( Sharpe ratio=\frac{{R_{p}}-{R_{f}}}{{σ_{p}}} \) | (6) |
A higher Sharpe ratio indicates that a portfolio has higher excess returns for a given level of risk. When the Sharpe ratio is greater than 1, it indicates that the portfolio has excess returns that exceed its level of risk, making it an attractive investment. Conversely, when the Sharpe ratio is less than 1, it indicates that the portfolio has limited appeal in terms of performance. However, Sharpe ratio is not the only indicator to assess whether a portfolio is good or not, so it is just considered as one of the metrics that compare the performance of the target portfolio with other benchmarks (NASDAQ and the 1/N portfolio) in this paper.
3. Results
This study firstly evaluated the performance of the LSTM model in fitting the data. The mean squared error (MSE) was used as the evaluation metric, and the learning rate was set to 1e-3. The number of training epochs varied depending on the size of the dataset and the difficulty of learning for each stock. Figure 2 presents some examples of the LSTM model’s performance. Overall, the model demonstrated reasonable accuracy in predicting future prices with acceptable errors relative to real situation.
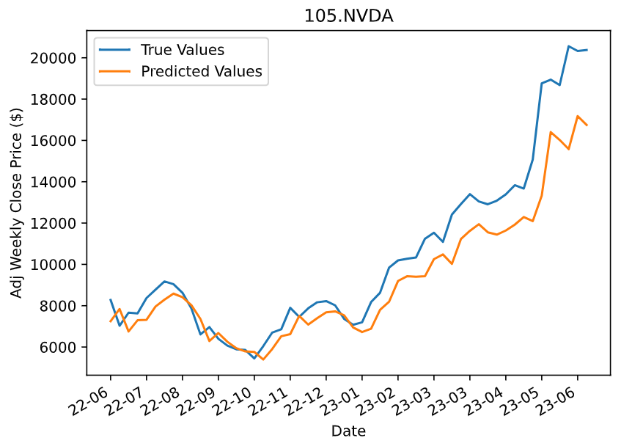
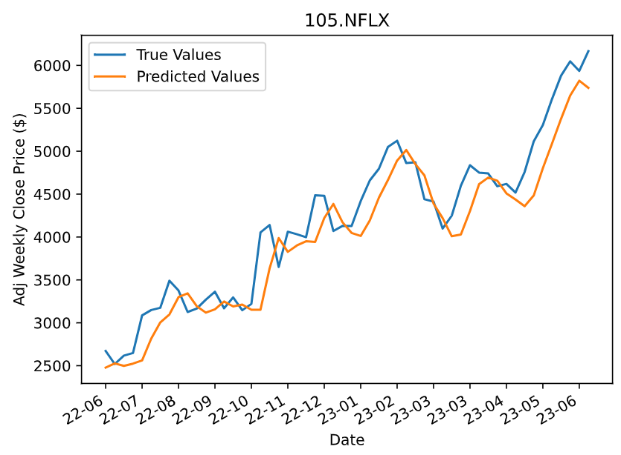
Figure 2: Examples of LSTM performance.
The strategy proposed in this paper involves trading on a weekly basis, with the fundamental rule being to buy stronger performers and sell weaker ones. The proportion of each stock bought or sold was determined by the magnitude of its predicted price change. If any stocks were forecasted to decrease in value, those predicted to decline were sold, while those predicted to increase were purchased. Otherwise, if all stocks were forecasted to increase in value, the amounts bought and sold were determined by a normalized position adjustment factor, calculated as follows:
\( Adjustment Factor=\frac{{R_{i}}-E({R_{i}})}{σ({R_{i}})} \) | (7) |
where \( {R_{i}} \) represents returns, \( {E(R_{i}}) \) represents the mean of returns, and \( {σ(R_{i}}) \) represents the standard deviation of returns. Furthermore, the strategy does not take trading frictions into account because the trading frequency is not so high, and it allows for short selling, assumes an initial capital amount of $10 million to avoid the issue of maximum market capacity. The strategy also imposes a constraint on the proportion of a single stock, limiting it to no more than one-third of the entire portfolio. This is done to prevent overloading on the main stock, which could result in the overall drawdown of the portfolio when the uptrend reverses (See Figure 3).
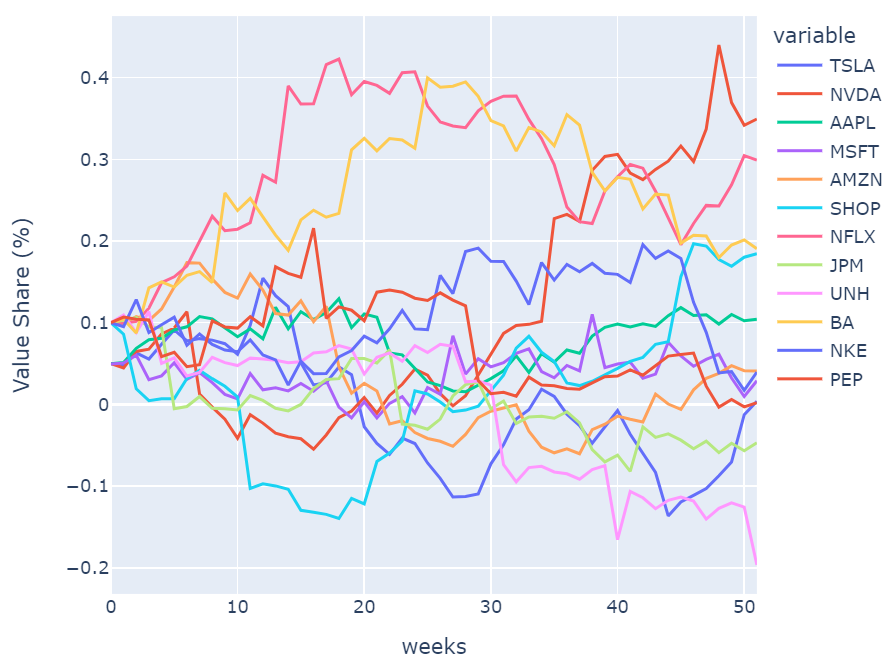
Figure 3: Proportion of each stock’s value in the total portfolio value.
It can be observed that the strategy tends to favor stocks with concentrated increase in price, and these stocks are more likely to be included in the portfolio. Since the four main participants (NFLX, BA, NVDA, SHOP) are all listed in the NASDAQ index, the historical returns of the NASDAQ during the test period were obtained to serve as a market benchmark. Additionally, the returns of a 1/N portfolio consisting of the same 12 stocks were obtained to serve as a passive investment benchmark. The yield on the US two-year Treasury note was selected as the risk-free rate for use in calculating the Sharpe ratio. An annualized tear sheet for each portfolio is presented in Table 2, and cumulative returns for each portfolio are plotted in Figure 4.
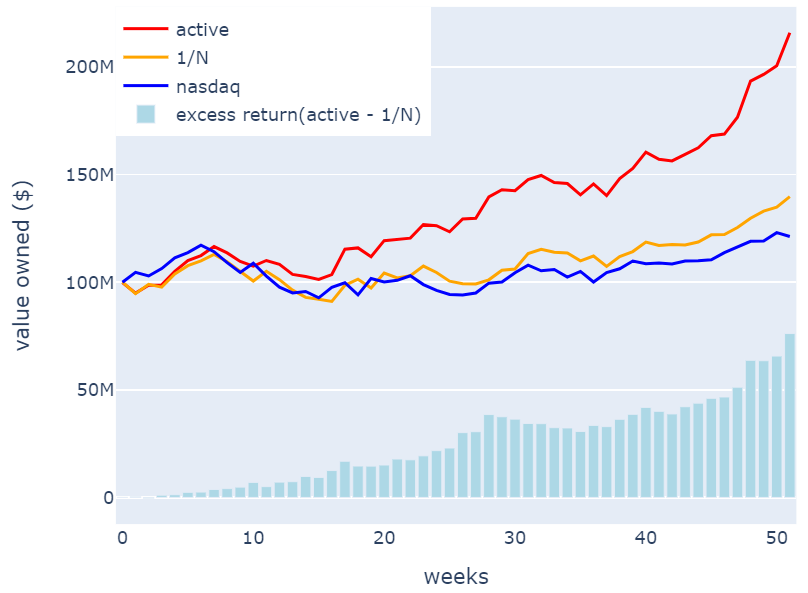
Figure 4: Comparison between NASDAQ, 1/N portfolio and strategy portfolio.
Table 2: Annualized tear sheet for July 1, 2022 to June 23, 2023.
Portfolio | NASDAQ | 1/N | Strategy |
Returns (%) | 21.25 | 39.77 | 116.21 |
Volatility (%) | 23.46 | 24.81 | 26.68 |
Sharpe Ratio | 0.780 | 1.337 | 2.944 |
Max Drawdown (%) | -20.9 | -19.3 | -13.1 |
Based on statistics above, the following traits can be observed:
The NASDAQ index exhibits respectable performance in terms of its returns, volatility, and Sharpe ratio. According to the given data, the index achieves a return of 21.25%, a volatility of 23.46%, and a Sharpe ratio of 0.780. These results establish the NASDAQ index as a credible benchmark for reflecting overall market performance, making it a viable option for investors seeking to track the market. However, it is worth noting that the Sharpe ratio remains below 1 and the index has a maximum drawdown of -20.9%, indicating that its returns may not fully compensate for its volatility and that there is still room for improvement in terms of stability.
The 1/N portfolio, comprising market-leading stocks, is capable of outperforming the market index even with a completely passive investment strategy. According to the given data, it achieves a return of 39.77%, a volatility of 24.81%, a Sharpe ratio of 1.337, and a maximum drawdown of -19.3%. While it demonstrates some improvement compared to the NASDAQ index, such as a Sharpe ratio above 1 and a slightly smaller maximum drawdown, the extent of enhancement remains limited. This suggests that while the 1/N portfolio may be a good choice compared to the market index, there may still be better options available for investors seeking higher returns.
In contrast, the strategy portfolio delivers exceptional performance, as evidenced by its remarkable return of 116.21% and Sharpe ratio of 2.944. This signifies a significant improvement in returns while maintaining volatility at 26.68%, an increase of less than 10%. The strategy portfolio exhibits an impressive excess return of 76.2% compared to the 1/N portfolio, and its maximum drawdown falls to -13.1%, which is 6-7% lower than the two portfolios mentioned before. These results highlight the superior performance of the strategy portfolio in terms of both returns and risk control.
4. Conclusion
In conclusion, this study presents a unique approach to portfolio management that deviates from the constraints of traditional mean-variance theory. By prioritizing trading volume as a key indicator of liquidity, the paper aims to achieve higher returns while maintaining appropriate risk control. The selected 12 stocks, carefully chosen based on their trading activity and significance in their respective sectors, form the foundation of the portfolio. Using the Long Short-Term Memory (LSTM) neural network model, the study predicts stock prices and implements a weekly rebalancing strategy based on the predicted returns. The performance of the strategy portfolio is then compared against two benchmarks, the Nasdaq index and an equally weighted portfolio.
The results demonstrate that the strategy portfolio outperforms both benchmarks significantly. Despite a slight increase in volatility, the strategy portfolio achieves substantial improvements in returns. Overall, the strategy proves to be successful in achieving the desired objectives of this paper. However, it is important to note that the current approach could benefit from further enhancements. The focus on model selection and data preprocessing has been limited, and future research could explore the incorporation of additional factors such as operation and technical indicators, as well as comprehensive data mining and feature engineering. Moreover, refining the model design to align with the richness of available data could potentially enhance the accuracy of predictions and improve the performance of the portfolio. Higher-frequency data sets with more noise could also be included once the enhancements above are realized, which may possibly increase the feasibility of implementing similar strategies in more frequent trading scenarios. The proposed methodology offers potential for further refinement and extension in future research to achieve even better results, potentially unlocking further opportunities for enhancing portfolio management strategies and delivering improved investment outcomes.
References
[1]. Zhang, D., Hu, M., and Ji, Q. (2020) Financial markets under the global pandemic of COVID-19. Finance Research Letters, 36, 101528.
[2]. Lu, R. and Sun, X. Y. (2021) Institutional Investors’ Preference for Concept Stocks and the Stock Market Bubble Riding. China Industrial Economics, 03, 174-192.
[3]. Liang, Y. and Liu, J.X. (2021) Analysis of Individual Investors' Stock Investment Behaviour in the Securities Market - A Survey Based on the Pearl River Delta Region. Science & Technology Ecnony Market, 09, 62-64.
[4]. Ma, Y., Han, R., and Wang, W. (2021) Portfolio optimization with return prediction using deep learning and machine learning. Expert Systems with Applications, 165, 113973.
[5]. Omer, B. S., Mehmet, U. G., and Ahmet, M. O. (2020) Financial time series forecasting with deep learning: A systematic literature review: 2005–2019, Applied Soft Computing, 90, 106181.
[6]. Lin, Y. H., Liu, S, C., and Yang, H. J. (2022) A Novel Stock Investment Strategy Using Fusion of Machine Learning Techniques and Candlestick Charting. China Journal of Econometrics, 01, 126-140.
[7]. Zhang, X.L., and Luo, C. (2017) Summary and Analysis of Continuation and Reversal Patterns in Candlestick Charts. Modern Economic Information, 15, 396-399.
[8]. Hu, Y. W. (2021) Stock Forecast Based on Optimized LSTM Model. Computer Science, S1, 151-157.
[9]. Xu, H.R., Xu, B., and Xu, K. W. (2020) Analysis on Application of Machine Learning in Stock Forecasting. Computer Engineering and Applications, 56(12), 19-24.
[10]. Murphy, J. J. (1999) Technical analysis of the financial markets: A comprehensive guide to trading methods and applications. Penguin.
Cite this article
Liu,H. (2023). Portfolio Management Strategy Based on LSTM. Advances in Economics, Management and Political Sciences,47,233-241.
Data availability
The datasets used and/or analyzed during the current study will be available from the authors upon reasonable request.
Disclaimer/Publisher's Note
The statements, opinions and data contained in all publications are solely those of the individual author(s) and contributor(s) and not of EWA Publishing and/or the editor(s). EWA Publishing and/or the editor(s) disclaim responsibility for any injury to people or property resulting from any ideas, methods, instructions or products referred to in the content.
About volume
Volume title: Proceedings of the 2nd International Conference on Financial Technology and Business Analysis
© 2024 by the author(s). Licensee EWA Publishing, Oxford, UK. This article is an open access article distributed under the terms and
conditions of the Creative Commons Attribution (CC BY) license. Authors who
publish this series agree to the following terms:
1. Authors retain copyright and grant the series right of first publication with the work simultaneously licensed under a Creative Commons
Attribution License that allows others to share the work with an acknowledgment of the work's authorship and initial publication in this
series.
2. Authors are able to enter into separate, additional contractual arrangements for the non-exclusive distribution of the series's published
version of the work (e.g., post it to an institutional repository or publish it in a book), with an acknowledgment of its initial
publication in this series.
3. Authors are permitted and encouraged to post their work online (e.g., in institutional repositories or on their website) prior to and
during the submission process, as it can lead to productive exchanges, as well as earlier and greater citation of published work (See
Open access policy for details).
References
[1]. Zhang, D., Hu, M., and Ji, Q. (2020) Financial markets under the global pandemic of COVID-19. Finance Research Letters, 36, 101528.
[2]. Lu, R. and Sun, X. Y. (2021) Institutional Investors’ Preference for Concept Stocks and the Stock Market Bubble Riding. China Industrial Economics, 03, 174-192.
[3]. Liang, Y. and Liu, J.X. (2021) Analysis of Individual Investors' Stock Investment Behaviour in the Securities Market - A Survey Based on the Pearl River Delta Region. Science & Technology Ecnony Market, 09, 62-64.
[4]. Ma, Y., Han, R., and Wang, W. (2021) Portfolio optimization with return prediction using deep learning and machine learning. Expert Systems with Applications, 165, 113973.
[5]. Omer, B. S., Mehmet, U. G., and Ahmet, M. O. (2020) Financial time series forecasting with deep learning: A systematic literature review: 2005–2019, Applied Soft Computing, 90, 106181.
[6]. Lin, Y. H., Liu, S, C., and Yang, H. J. (2022) A Novel Stock Investment Strategy Using Fusion of Machine Learning Techniques and Candlestick Charting. China Journal of Econometrics, 01, 126-140.
[7]. Zhang, X.L., and Luo, C. (2017) Summary and Analysis of Continuation and Reversal Patterns in Candlestick Charts. Modern Economic Information, 15, 396-399.
[8]. Hu, Y. W. (2021) Stock Forecast Based on Optimized LSTM Model. Computer Science, S1, 151-157.
[9]. Xu, H.R., Xu, B., and Xu, K. W. (2020) Analysis on Application of Machine Learning in Stock Forecasting. Computer Engineering and Applications, 56(12), 19-24.
[10]. Murphy, J. J. (1999) Technical analysis of the financial markets: A comprehensive guide to trading methods and applications. Penguin.