


1.Introduction
Portfolio optimization is a methodology of adopting and modifying investments to maximize prospective return while minimizing risk. Portfolio optimization plays a crucial role in managing risk, maximizing returns, aligning with investment goals, utilizing capital efficiently, adapting to market conditions, and facilitating quantitative decision-making [1]. By employing optimization techniques, investors can construct well-balanced portfolios that aim to achieve the desired risk-return trade-off and enhance long-term investment performance [2].
Modern portfolio theory (MPT) was initially described in an essay by economist Harry Markowitz in 1952 [3]. On the basis of Markowitz’s research, many scholars and researchers have proposed various improvements and extensions to investment portfolio management decisions. As an illustration, the Capital Asset Pricing Model (CAPM) is widely used model for valuing stocks and other financial assets, which associates risk with expected returns [4]. In recent years, the Long Short-Term Memory (LSTM) model has emerged as an advanced machine learning technique that shows promise in financial forecasting tasks [5].
LSTM has the benefit of being able to recognize long-term relationships and nonlinear patterns in sequential data, which makes it potentially suitable for forecasting financial time series data [6]. Its ability to model complex relationships can be beneficial in forecasting asset prices or returns, which are crucial inputs for portfolio optimization [7]. However, it is worth noting that the integration of LSTM with portfolio optimization is still in its early stages, with limited research available [8]. Further exploration is needed to fully understand the potential benefits and challenges associated with combining LSTM and portfolio optimization techniques effectively.
Therefore, this article is interested in applying LSTM model to the field of investment portfolio and observing how the portfolio will perform. To reach the goal, the research is constructed in following steps. The paper focuses on analyzing stocks data from six distinct industries: New Energy, Artificial Intelligence, Pharmaceuticals, Aerospace Industry, Banking, and Internet. The selected companies representing these industries are Tesla, Nvidia, Johnson & Johnson, Boeing, JPMorgan Chase, and Microsoft. The time period under consideration for the analysis spans from January 2022 to June 2023. By examining the stocks data of these companies within their respective industries, the paper aims to gain insights and draw conclusions regarding their performance and potential trends. Second, the paper extracts the top 80% of the data and use LSTM model to construct training set, and the bottom 20% of the data as the testing set to generate the prediction. Third, evaluate the performance of the constructed portfolio using the testing dataset. Calculating various performance metrics such as portfolio returns, volatility, Sharpe ratio, and maximum drawdown. Examine the LSTM-based portfolio's performance to that of other benchmark portfolios or strategies.
2.Data
The study focuses on analyzing the stock data of prominent companies representing six diverse industries: New Energy, Artificial Intelligence, Pharmaceuticals, Aerospace Industry, Banking, and Internet. Specifically, the selected companies for analysis are Tesla for New Energy, Nvidia for Artificial Intelligence, Johnson & Johnson for Pharmaceuticals, Boeing for the Aerospace Industry, JPMorgan Chase for Banking, and Microsoft for the Internet industry. The study considers a comprehensive time frame, encompassing the period from January 2022 to June 2023.
By examining the stock data of these specific companies within their respective industries, the research aims to gain valuable insights and draw meaningful conclusions regarding their performance and potential trends. This approach allows for a focused analysis of how these companies, operating in various sectors, have fared during the specified time period.
By considering a diverse set of industries and prominent companies within each sector, the study provides a comprehensive view of the broader market dynamics and the performance of these specific stocks. The selected time frame allows for an in-depth examination of trends, potential correlations, and significant events that may have influenced the performance of these companies.
This analysis serves as a foundation for understanding the behavior of these stocks and provides insights into their potential future movements. By studying the performance of these industry-leading companies, investors and researchers can gain valuable knowledge to inform their investment decisions and further their understanding of the dynamics within these sectors (See Table 1 and Figure 1).
Table 1: Considered assets.
|
Stock Symbol |
Companies Name |
|
TSLA |
Tesla |
|
BA |
Boeing |
|
JNJ |
Johnson & Johnson |
|
JPM |
JPMorgan Chase |
|
NVDA |
Nvidia |
|
MSFT |
Microsoft |
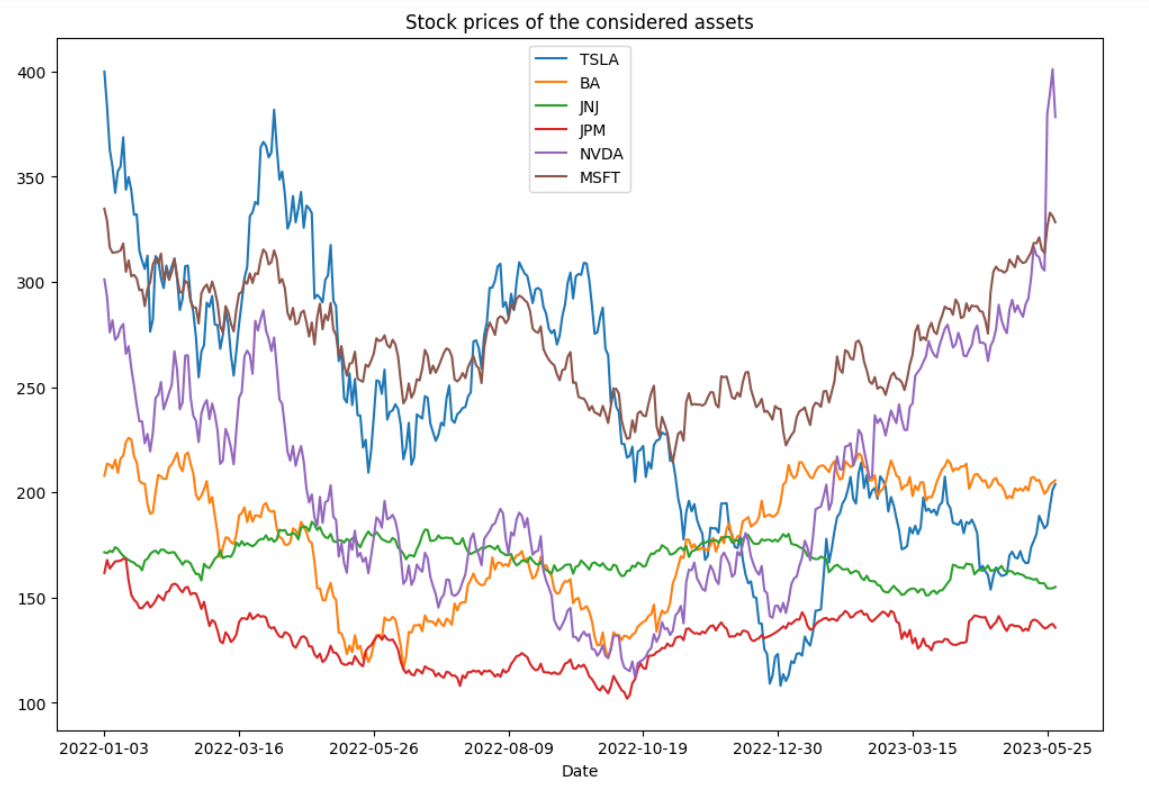
Figure 1: The Plot of stock price of the considered assets.
Table 2 uses these closing prices to calculate Log-Return and create a basic statistic, then the cumulative return is shown in Figure 2.
Table 2: Statistic table.
|
TSLA |
BA |
JNJ |
JPM |
NVDA |
MSFT |
|
|
Mean |
-0.407 |
-0.144 |
-0.013 |
-0.193 |
-0.326 |
-0.193 |
|
Std |
0.160 |
0.143 |
0.047 |
0.081 |
0.183 |
0.079 |
|
Skew |
0.131 |
-0.361 |
-0.347 |
0.285 |
0.537 |
0.209 |
|
Kurt |
-0.856 |
-1.226 |
-0.681 |
0.055 |
-0.139 |
-0.922 |
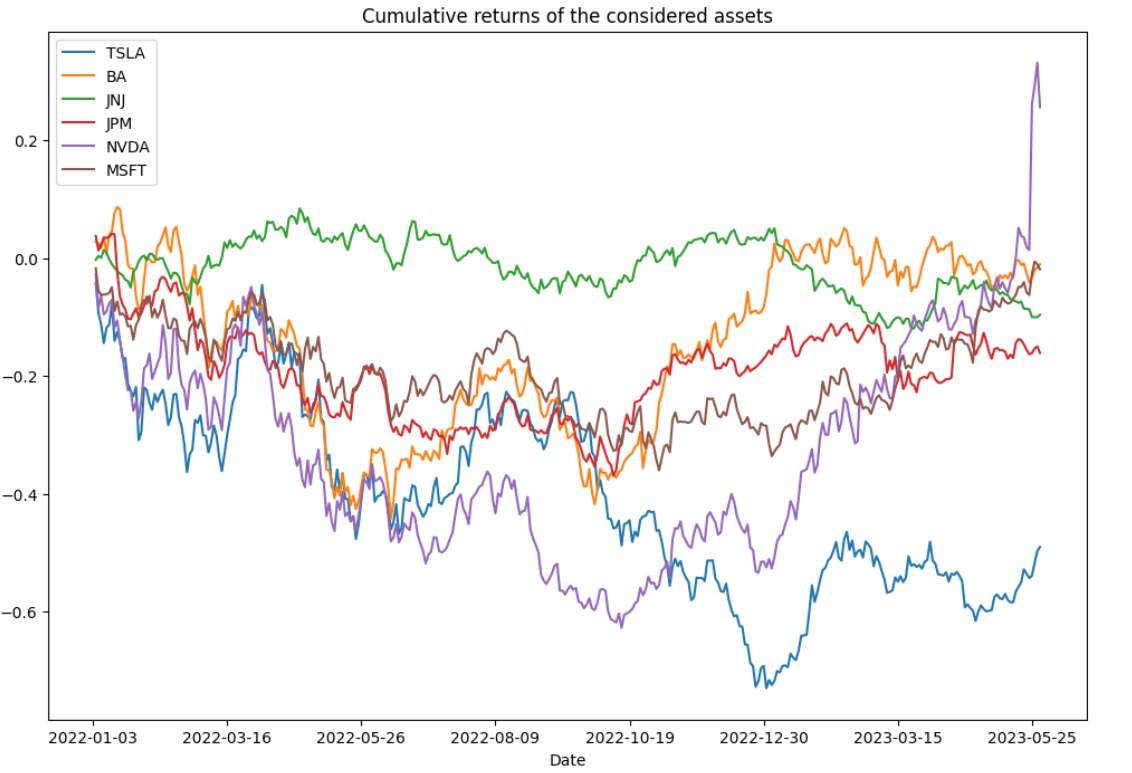
Figure 2: Cumulative returns of six assets.
3.Methods
3.1.Mean-Variance Model
The Mean-Variance Model is a fundamental framework in modern portfolio theory (MPT) that aims to optimize investment portfolios by balancing expected returns and risk. Developed by Harry Markowitz, the model helps investors make rational decisions about asset allocation based on their risk preferences [9].
In the Mean-Variance model, assets are evaluated based on their expected returns and risk. Let’s consider a portfolio consisting of multiple assets, denoted by the\( i \)-th assets with weight\( {w_{i}} \). The weights represent how significant of each asset’s investment within the overall portfolio, and the sum of all weights\( \sum _{i}{w_{i}} \)equals 1. Each asset\( i \)is associated with an expected return\( {r_{i}} \), which represents the anticipated average return of that asset. Then the total expected returns can be represented by the following formula
|
\( {R_{p}}=\sum _{i}{w_{i}}{r_{i}} \) |
(1) |
The portfolio variance formula quantifies the total risk or volatility associated with a portfolio that consists of multiple assets. In this formula,\( {σ_{i}} \)represent the standard deviation of the\( i \)-th assets and\( {ρ_{ij}} \)represent the correlation between the returns of the\( i \)-th and\( j \)-th asset.
|
\( σ_{p}^{2}=\sum _{1}w_{i}^{2}σ_{i}^{2}+\sum _{i}\sum _{j}{w_{i}}{w_{j}}{σ_{i}}{σ_{j}}{ρ_{ij}} \) |
(2) |
The Sharpe Ratio weighs the portfolio's return and risk, taking into account the risk-free rate as a benchmark. It provides a measure of how all the portfolio compensates investors for the level of risk they undertake relative to a risk-free investment.\( {R_{p}} \)stands for the expected portfolio return,\( {R_{f}} \)for the risk-free rate of return and\( {σ_{p}} \)for the portfolio's standard deviation or volatility.
|
\( Sharpe ratio=\frac{{R_{p}}-{R_{f}}}{{σ_{p}}} \) |
(3) |
Investors are particularly interested in two portfolios that are located inside the efficient frontier which return the most favorable Sharpe ratio and the volatility with the least amount. This study constructs the interested portfolios and compares the performance of the portfolios with S&P 500.
3.2.Long Short-Term Memory (LSTM)
Due to its capacity to recognize long-term relationships in sequential data, LSTM is an effective form of RNN utilized in forecasting stock prices. By incorporating memory cells, LSTM can process historical price data and learn complex patterns. By examining historical price patterns and pertinent characteristics, it anticipates forthcoming price changes, encompassing both immediate fluctuations and enduring patterns. LSTM's capabilities improve prediction accuracy compared to conventional models. Input gates, forget gates, and output gates are the three types of gates found in LSTMs. The process of information inside the LSTM cell is directed by these gates.
|
\( i_{t} = \sigma(W_{i} x_{t} + U_{i} h_{t-1} + b_{i}) \)~ (Input gate) |
(4) |
|
\( {f_{t}}=σ({W_{f}}{x_{t}}+{U_{f}}{h_{t-1}}+{b_{f}}) \)~ (Forget gate) |
(5) |
|
\( {O_{t}}=σ({W_{o}}{x_{t}}+{U_{o}}{h_{t-1}}+{b_{o}}) \)~ (Output gate) |
(6) |
The LSTM model updates its memory cell based on the input and forget gates. First, a new candidate cell state is computed using the hyperbolic tangent (tanh) activation function, taking into account the input at hand as well as the prior concealed state. In the context of a memory cell, the input gate determines the extent to which the candidate cell state contributes to the existing memory cell state, whereas the forget gate governs the degree to which the previous memory cell state is retained. These operations adjust the memory cell state accordingly.
Next, the hidden state is calculated based on the updated memory cell state. The memory cell state passes through an output activation stage where the values between -1 and 1 are squashed using the tanh activation function. The output gate determines the extent to which the memory cell's content should be exposed as the hidden state output. The hidden state is obtained by multiplying the adjusted memory cell state with the values from the output gate.
This hidden state serves as the output of the LSTM cell at present time period and becomes the input for the next time step. As a result, the LSTM model can recognize and make use of long-term relationships in the sequential data it analyzes, such as in stock price prediction tasks. This entire process is repeated for each succeeding time step (See Figure 3) [10].
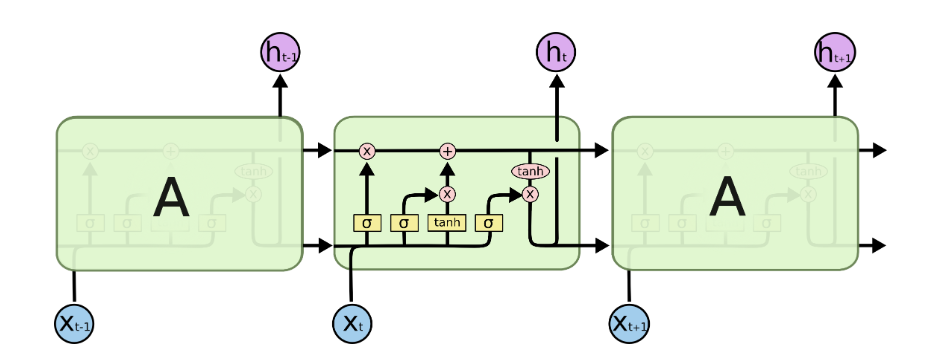
Figure 3: The repeating module of LSTM.
This hidden state serves as the LSTM cell's output at the present time step and is used as the input at the following time step. The entire process repeats for each subsequent time step, enabling long-term relationships to be captured and used by the LSTM model in the sequential data it analyzes, such as in stock price prediction jobs.
3.3.Monte Carlo and Efficient Frontier
The Monte Carlo method uses random sampling and statistical analysis to solve complex problems. It simulates multiple scenarios and analyzes the results to estimate probabilities, make predictions, or approximate solutions. It is effective when deterministic approaches are impractical or overly complex. By generating many outcomes through random sampling, it provides an approximate solution for understanding systems and making informed decisions [11]. Within modern portfolio theory, the efficient frontier embodies a selection of ideal portfolios that embody either maximum expected returns for a particular level of risk or minimum risk for a desired level of expected return. It is a visual depiction of different portfolio asset combinations that offer the optimum risk-return trade-offs. The Monte Carlo approach is used in this research to obtain the effective border.
4.Results
When setting up LSTM network architecture, we define and summarizes a Sequential model with two LSTM layers (100 units each), a dense layer (25 units), and an output layer (1 unit) for predicting sequences and displays the summary of the model architecture. The LSTM model is then trained, and the root mean square error (RMSE) is reported in order to measure the model's performance (See Table 3).
Table 3: Root mean square error of the predictions.
|
Stock Symbol |
Root Mean Square Error (RMSE) |
|
TSLA |
5.958 |
|
BA |
0.905 |
|
JNJ |
2.651 |
|
JPM |
0.493 |
|
NVDA |
7.635 |
|
MSFT |
34.165 |
Then, visualize the predicted prices of the six stocks in a Figure 4.
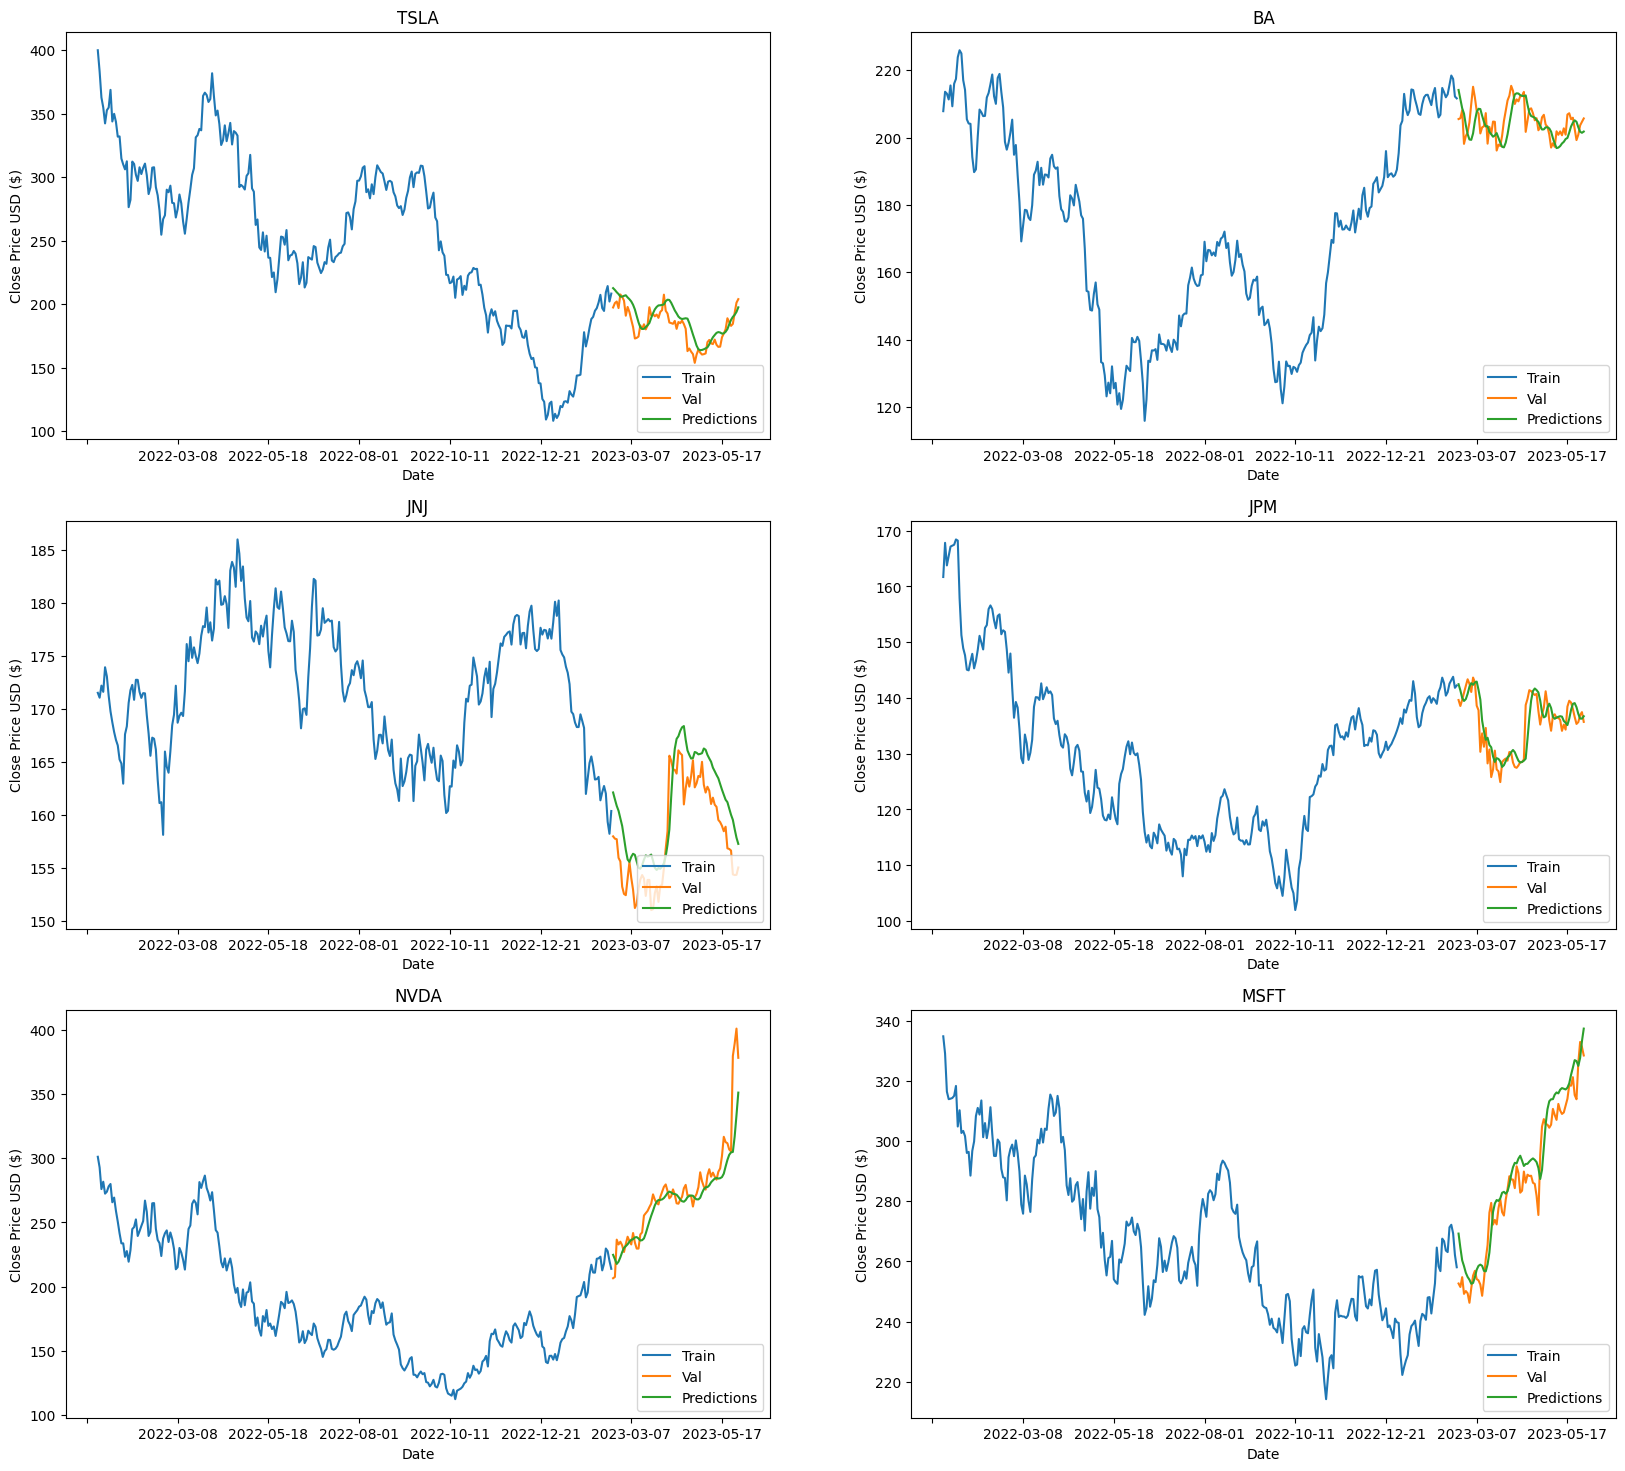
Figure 4: The predicted prices of six stocks.
From the resulting chart, it is evident that the predicted stock prices exhibit a strong correlation with the actual stock prices, closely tracking their overall trend. This observation highlights the effectiveness of utilizing LSTM in analyzing time series or sequential data.
Calculating log returns, derived average returns and a covariance matrix, generated random weights for portfolios, and computed portfolio returns and volatilities. The Sharpe ratio was calculated for each portfolio, and the results were stored in a data frame. The efficient frontier was adjusted by filtering the data points (See Figure 5). The interested asset weights are shown in Table 4.
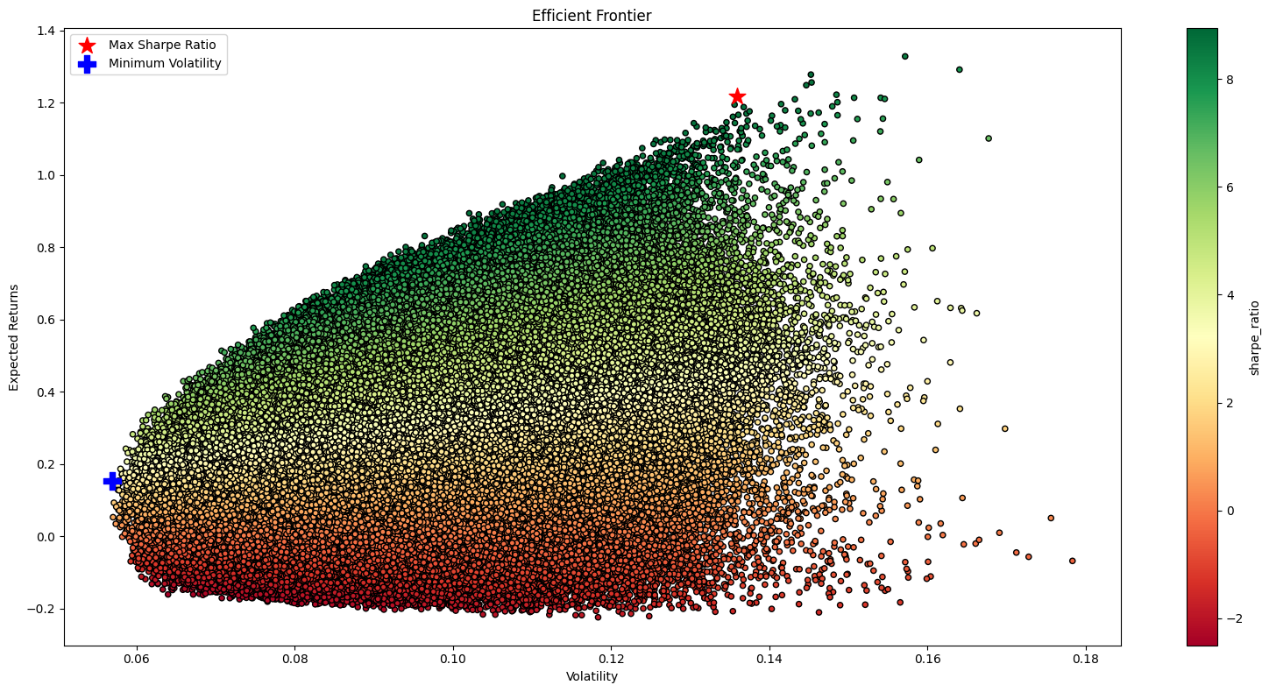
Figure 5: Efficient frontier.
Table 4: The Portfolio allocation of two different method.
|
TSLA |
BA |
JNJ |
JPM |
NVDA |
MSFT |
|
|
Max Sharpe Ratio |
0.07% |
0.50% |
11.84% |
1.01% |
64.35% |
22.24% |
|
Min Volatility |
2.80% |
1.59% |
66.22% |
13.29% |
15.47% |
0.63% |
The portfolio with the maximum Sharpe ratio exhibits exceptional performance, with a return of 121.61% and a volatility of 13.60%. The Sharpe ratio for this portfolio is an impressive 894.37%, indicating a high risk-adjusted return. Notably, NVDA (NVIDIA) holds the largest weight, comprising 64.35% of the portfolio, followed by MSFT (Microsoft) with 22.24%. This suggests a significant emphasis on these two assets in the portfolio's allocation strategy.
The portfolio with the minimum volatility demonstrates a more conservative investment approach with a focus on stability. It has achieved a return of 15.28% with a relatively low volatility of 5.69%, resulting in a Sharpe ratio of 268.64%.JNJ (Johnson & Johnson) holds the largest weight, comprising 66.22% of the portfolio. This indicates a significant emphasis on a stable and established healthcare company. JPM (JPMorgan Chase) and NVDA (NVIDIA) also hold notable weights at 13.29% and 15.47%, respectively.
To compare the performance of an investment portfolio, start by calculating the daily compounded returns. This involves determining the daily returns for each asset or the overall portfolio and then using a compounding formula to calculate the compounded returns. Next, compute the cumulative returns by multiplying the daily compounded returns for each day or by adding them up. By comparing the cumulative returns of the two strategies with the S&P 500 portfolio, this study offers an evaluation of the overall performance of the Maximum Sharpe Ratio portfolio and Minimum Volatility portfolio (See Figure 6).
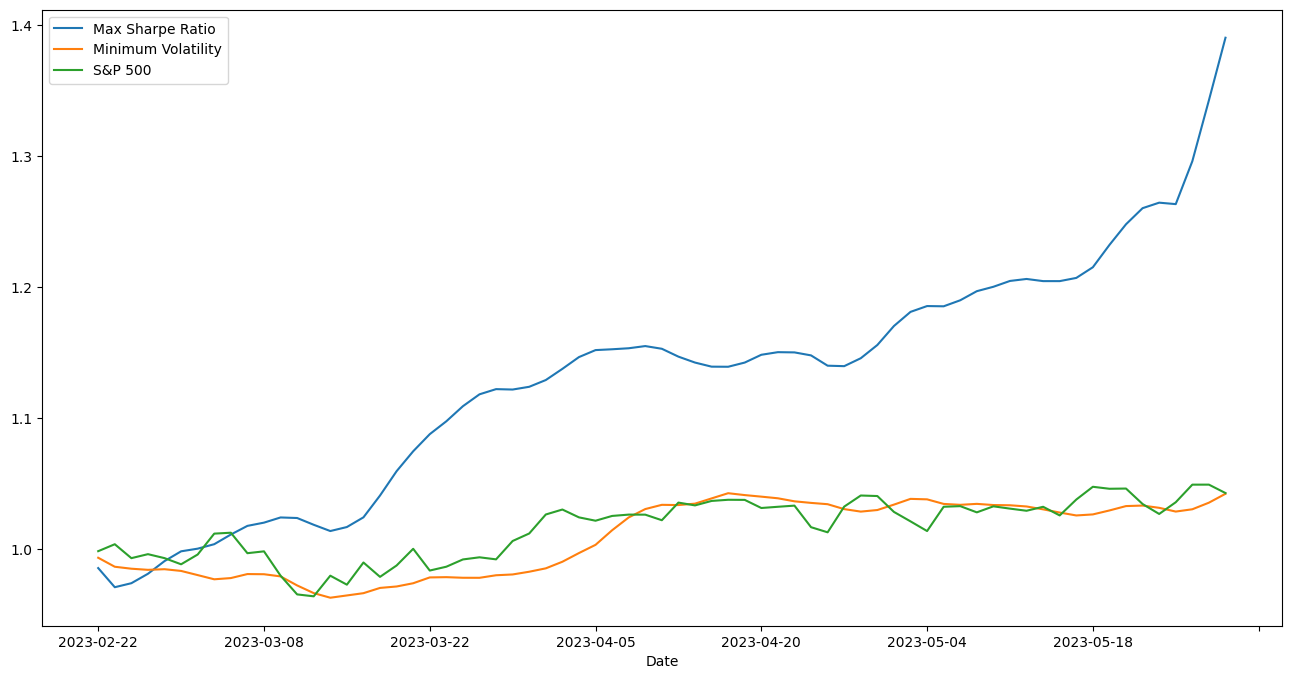
Figure 6: Cumulative return of two method and S&P 500.
From the graph we can find that the cumulative return of Maximum Sharpe Ratio portfolio is considerably greater than S&P 500 index. Also, the performance of Minimum Volatility is very similar to S&P 500. Therefore, we can conclude that the Maximum Sharpe Ratio Model is better than the others.
5.Conclusion
Portfolio optimization is a widely recognized approach that aims to maximize returns and minimize risks. This study focuses on six distinct companies, namely Tesla, Nvidia, Johnson & Johnson, Boeing, JPMorgan Chase, and Microsoft within their respective industries from January 2022 to June 2023. Initially, the LSTM model is employed to train on 80% of the data and predict the remaining 20%. Subsequently, using the portfolio pattern based on the predicted results, the paper constructs both a maximum return model and a minimum risk model using Monte Carlo's effective frontier. By applying these models to the portfolio and comparing the yields with the S&P 500 over the same time, valuable conclusions are drawn that the LSTM-based portfolio should be preferred.
Overall, this research introduces a portfolio methodology that incorporates the advanced LSTM model as a forecasting tool, highlighting the efficacy of combining LSTM and portfolio models for optimal results.
References
[1]. Black, F., and Litterman, R. (1992) Global portfolio optimization. Financial analysts journal, 48(5), 28-43.
[2]. Lu, L., Zhao, S., Shen, X., Dan, C., and Wang, X. (2023) Intelligent Portfolio Optimization Based on Machine Learning. Computer Science and Application, 13(3), 349–357.
[3]. Mangram, M. E. (2013) A simplified perspective of the Markowitz portfolio theory. Global journal of business research, 7(1), 59-70.
[4]. Pan, G. (2016) A Literature Review of the Capital Asset Pricing Model (CAPM). Shi Dai Jin Rong, 14, 279–280.
[5]. Ta, V. D., Liu, C. M., Tadesse, D. A. (2020) Portfolio optimization-based stock prediction using long-short term memory network in quantitative trading. Applied Sciences, 10(2), 437.
[6]. Mohanty, S. (2023) An International Study of Application of Long Short-Term Memory (LSTM) Neural Networks for the prediction of stock and forex markets. IJFMR-International Journal For Multidisciplinary Research, 5(3).
[7]. Peng, Y., Liu, Y., and Zhang, R. (2019) Modeling and Analysis of Stock Price Prediction Based on LSTM. Computer Engineering and Applications, 55(11), 209–212.
[8]. Nafia, A., Yousfi, A., and Echaoui, A. (2023) Equity-Market-Neutral Strategy Portfolio Construction Using LSTM-Based Stock Prediction and Selection: An Application to S&P500 Consumer Staples Stocks. International Journal of Financial Studies, 11(2), 57.
[9]. Steinbach, M. C. (2001) Markowitz revisited: Mean-variance models in financial portfolio analysis. SIAM review, 43(1), 31-85.
[10]. Github, https://colah.github.io/posts/2015-08-Understanding-LSTMs/, accessed on 2023/7/20
[11]. Li, Y., and Wang, H. (2016) Security Portfolio Risk Analysis Based on Monte Carlo Simulation. Xin Jing Ji, 17, 38.
Cite this article
Song,D. (2023). Portfolio Optimization by LSTM with a Selection of Six Stocks. Advances in Economics, Management and Political Sciences,48,46-55.
Data availability
The datasets used and/or analyzed during the current study will be available from the authors upon reasonable request.
Disclaimer/Publisher's Note
The statements, opinions and data contained in all publications are solely those of the individual author(s) and contributor(s) and not of EWA Publishing and/or the editor(s). EWA Publishing and/or the editor(s) disclaim responsibility for any injury to people or property resulting from any ideas, methods, instructions or products referred to in the content.
About volume
Volume title: Proceedings of the 2nd International Conference on Financial Technology and Business Analysis
© 2024 by the author(s). Licensee EWA Publishing, Oxford, UK. This article is an open access article distributed under the terms and
conditions of the Creative Commons Attribution (CC BY) license. Authors who
publish this series agree to the following terms:
1. Authors retain copyright and grant the series right of first publication with the work simultaneously licensed under a Creative Commons
Attribution License that allows others to share the work with an acknowledgment of the work's authorship and initial publication in this
series.
2. Authors are able to enter into separate, additional contractual arrangements for the non-exclusive distribution of the series's published
version of the work (e.g., post it to an institutional repository or publish it in a book), with an acknowledgment of its initial
publication in this series.
3. Authors are permitted and encouraged to post their work online (e.g., in institutional repositories or on their website) prior to and
during the submission process, as it can lead to productive exchanges, as well as earlier and greater citation of published work (See
Open access policy for details).
References
[1]. Black, F., and Litterman, R. (1992) Global portfolio optimization. Financial analysts journal, 48(5), 28-43.
[2]. Lu, L., Zhao, S., Shen, X., Dan, C., and Wang, X. (2023) Intelligent Portfolio Optimization Based on Machine Learning. Computer Science and Application, 13(3), 349–357.
[3]. Mangram, M. E. (2013) A simplified perspective of the Markowitz portfolio theory. Global journal of business research, 7(1), 59-70.
[4]. Pan, G. (2016) A Literature Review of the Capital Asset Pricing Model (CAPM). Shi Dai Jin Rong, 14, 279–280.
[5]. Ta, V. D., Liu, C. M., Tadesse, D. A. (2020) Portfolio optimization-based stock prediction using long-short term memory network in quantitative trading. Applied Sciences, 10(2), 437.
[6]. Mohanty, S. (2023) An International Study of Application of Long Short-Term Memory (LSTM) Neural Networks for the prediction of stock and forex markets. IJFMR-International Journal For Multidisciplinary Research, 5(3).
[7]. Peng, Y., Liu, Y., and Zhang, R. (2019) Modeling and Analysis of Stock Price Prediction Based on LSTM. Computer Engineering and Applications, 55(11), 209–212.
[8]. Nafia, A., Yousfi, A., and Echaoui, A. (2023) Equity-Market-Neutral Strategy Portfolio Construction Using LSTM-Based Stock Prediction and Selection: An Application to S&P500 Consumer Staples Stocks. International Journal of Financial Studies, 11(2), 57.
[9]. Steinbach, M. C. (2001) Markowitz revisited: Mean-variance models in financial portfolio analysis. SIAM review, 43(1), 31-85.
[10]. Github, https://colah.github.io/posts/2015-08-Understanding-LSTMs/, accessed on 2023/7/20
[11]. Li, Y., and Wang, H. (2016) Security Portfolio Risk Analysis Based on Monte Carlo Simulation. Xin Jing Ji, 17, 38.