


1. Introduction
Internet technology companies are technology-oriented companies that use new digital technology to produce various internet-based products, including digital hardware and software, and apply them to all aspects of people's lives to make profits [1]. These companies enter a positive cycle by profiting from various technology patents and products and investing a portion of the profits in research. The core structure of business in the 21st century is the combination and rational utilization of resources, which is also true for internet technology companies [2]. They could rely on their technological innovation to obtain new products and technologies or innovate new products and then assemble better products for sale to get profit. Under the impact of COVID-19, internet-based social media has played a greater role in influencing digital information transmission, residents' entertainment ways, and even political participation, which has provided internet technology companies with various opportunities to develop products and make profits [3]. In addition, China's Science and technology innovation board has reached weak effectiveness [4]. Based on this development, it is found that innovation investment would positively lead to the improvement of stock liquidity and the innovation ability of enterprises, which would lead to the development and progress of enterprises and the expansion of scale [5]. Therefore, internet technology companies in China and the world would have more development opportunities in a relatively effective large market. Additionally, the development prospects of the overall science and technology industry containing digital transformation are profitable and hopeful [6]. Therefore, the investment strategy of listed companies that disperse the investment in the entire science and technology sector is still very promising for development and profit in the future.
Innovation is undoubtedly crucial in the overall mobile phone and hardware industry because consumers will pay for new products and designs, and it will drive the development of related industries [7]. As for Apple, since it entered the market in 2007, relying on its original IOS system, independently developed A-series chips, unique design, and development of patents related to digital computers and telephone data transmission systems, it has ranked the top mobile phone company in the world and occupied huge market shares [8]. Similarly, in the computer field, Apple's original MacOS system and M-series chips also perform well in the overall computing power test, which attracts consumers to pay for it [9]. In general, relying on its nearly 20 years of accumulation, Apple has entered the forefront of technology companies and occupied many market shares in mobile phones, computers, and other fields [8]. Therefore, the development and progress prospects for Apple are broad and excellent.
Various hardware, software, electronic devices, and electronic applications created by internet technology companies occupy a large share of people's daily lives [10]. The development potential and innovation level of internet technology companies will affect the convenience of residents' daily life [10]. As a result, it is crucial to study these internet technology companies and their corresponding progressive environment and development prospects. Various literature studies on internet technology companies' development status and trends after 20 years suggest relevant development modes. For instance, a combination of three aspects has been proposed: greater market competition, government support, and technical conditions in human resources [11]. The method to increase research and development expenditure on product marketing and technology has been proposed, considering that sustained investment would have a long-term positive impact on the company's profitability [12]. However, few existing studies consider the return of technology companies as investment directions alone.
This paper mainly focuses on the momentum strategy in stock market investment, based on the basic momentum strategy, and attempts to add factors in the Fama-French three-factor model to innovate this strategy. This strategy is used to analyze the stock data of 30 companies in the US stock science and technology innovation sector in the past eight years. Then, the training and testing performance of the overall strategy under different moving-average indicator formulations would be conducted. At the same time, considering the impact of transaction costs, the overall return curve of this strategy and the corresponding investment suggestions will be obtained and shown.
Considering its risk factors and the largest proportion of sharp ratio, the test and training income chart of the overall optimal method is finally obtained, and based on this income chart, the investment advice and planning of the overall technology company are given. At the same time, the overall development of the science and technology board is predicted based on the overall return chart.
2. Method
2.1.Method Introduction
The Momentum strategy is an investment strategy that uses past stock data to act as the criterion for investment. In this strategy, the ineffectiveness or weak effectiveness of the market, that is, the stock price would keep a similar trend to increase or decrease with the stock's past price, is believed. Besides, when the price of one corporation increase and people buy it and not vice versa. The phenomenon that the basic and traditional momentum strategy has various defects, such as the random process of the stock market in truth [13]. Therefore, the basic model would only partially forecast the movements of the stock market and get a negative return [13]. This article adds the value of market excess return, small minus big (SMB), and high minus low (HML) as the new parameters in the momentum strategy construction to improve the whole strategy performance.
2.2.Model Construction
Based on the original momentum strategy and stock data of technology companies, the overall momentum strategy would be constructed, and the most suitable would be found to establish the moving average indicator. Through constructing the moving average, the average value of the past N days or months would be used as the moving average.
MANt=1N∑ts=t−NRes (1)
Then, the simple linear prediction model is formulated. The simple linear prediction model is a formula that shows the return is constructed by constant term, moving average, excess market return, SMB, and HML times its corresponding coefficients, and unpredictable noise.
R_{t}^{e}=α+βMA_{t-1}^{N}+ρ(Mkt-RF)+σSMB+τHML+{ϵ_{t}} (2)
In addition, the linear regression is performed to explore the linear relation between the return of the overall investment and the moving average indicator, market excess return, small minus big factor (SMB), and high minus low factor (HML). After that, the mean-variance optimal portfolio would be calculated, and the optimal allocation based on this calculation is the amount of investment for each company. The mean-variance optimal portfolio is the expected return of the whole strategy divided by the corresponding variance and risk-aversion indicator.
{\hat{x}_{t-1}}=\frac{α+βMA_{t}^{N}ρ(Mkt-RF)+σSMB+τHML}{γσ_{ϵ}^{2}} (3)
Besides, all corporations' returns multiplied by the investment amount would be added up to calculate the return of the whole strategy.
Afterward, the eight-year data period would be divided into two parts, which contain three years for training and five years for tests. The backtesting would be conducted for training and testing. Besides, the overall sharp ratio, the expected return divided by the standard deviation, would be calculated and compared to analyze the risk of the whole strategy. Because of the transaction and trading in high frequency, transaction cost would be substantial, and it would be considered to compare the return without transaction cost and return with it to test the rationality of the strategy.
2.3.Assumption
The trading indicator is the moving average of past stock returns, which contains N as the lookback period meaning that the mean value of the past days or months' data would be calculated to act as the moving average.
Efficient market hypothesis: Information from past returns is already shown in the stock price, and no other useful information would change the stock price.
The risk-aversion indicator is 1, meaning that investors are normally risk-averse and would give up investing in a stock with a high return and risk.
3. Result
3.1.Daily Result Display
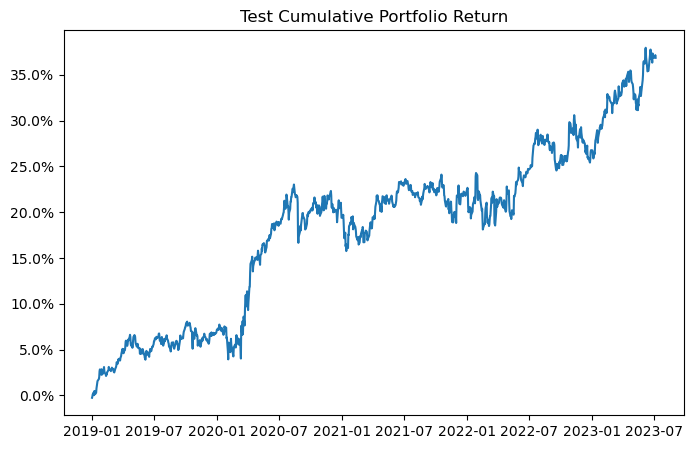
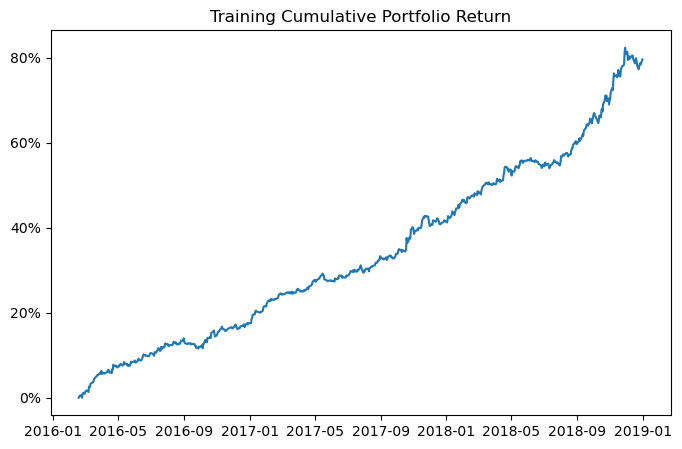
Figure 1: The test and training return of daily price.
According to Figure 1, the result of the whole strategy constructed by daily stock data of the top thirty internet technology corporations in the US stock market, the conclusion that both returns of test and train have a positive relationship with the period would be obtained. Besides, the test return reaches 35%, and the training return reaches 80% at the highest point. That means internet technology companies' development tendency and prospect is positive and advantageous. The traditional momentum strategy generally shows reasonable and profitable performance when applied to internet technology companies through the past eight years of data.
Table 1: The analysis of the test result of daily price. | ||||
Indicator | Shape Ratio | Max Drawdown | Skewness | Kurtosis |
Value | 0.0401 | 0.0767 | 0.0604 | 6.6990 |
Table 2: The analysis of the training result of daily price | ||||
Indicator | Shape Ratio | Max Drawdown | Skewness | Kurtosis |
Value | 0.2948 | 0.0144 | 0.5399 | 4.6484 |
Based on Table 1 and Table 2, the shape ratios of both test and training are less than one and numerically small, meaning that the whole strategy could perform better while considering the risk. The maximum drawdown is also numerically small, which means that the change of the assets from the maximum to the minimum is small, and the whole property of the stock is stable. Each skewness is positive but less than one, which shows that the whole stock statistical data is the distribution's positive deviation. Each kurtosis is positive and larger than one, which shows that the overall distribution of the statistical data of the stocks is steeper than the normal distribution with a sharp peak.
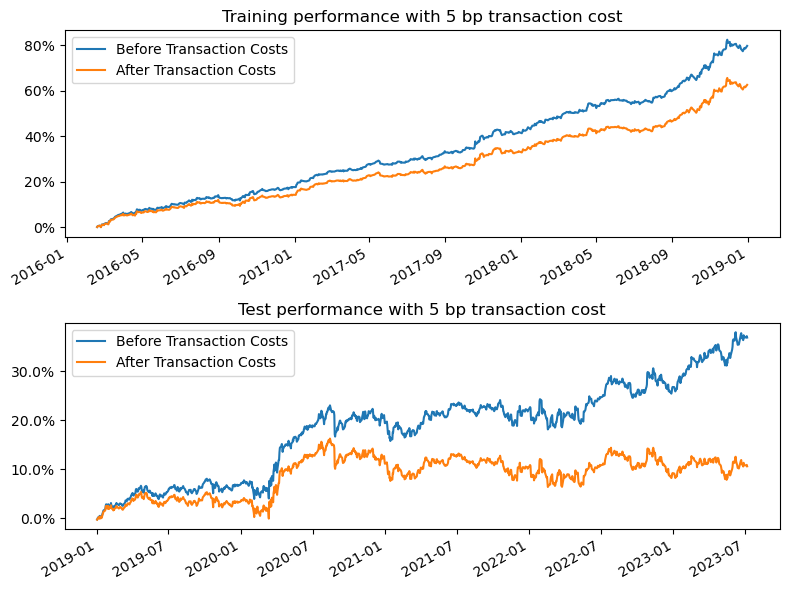
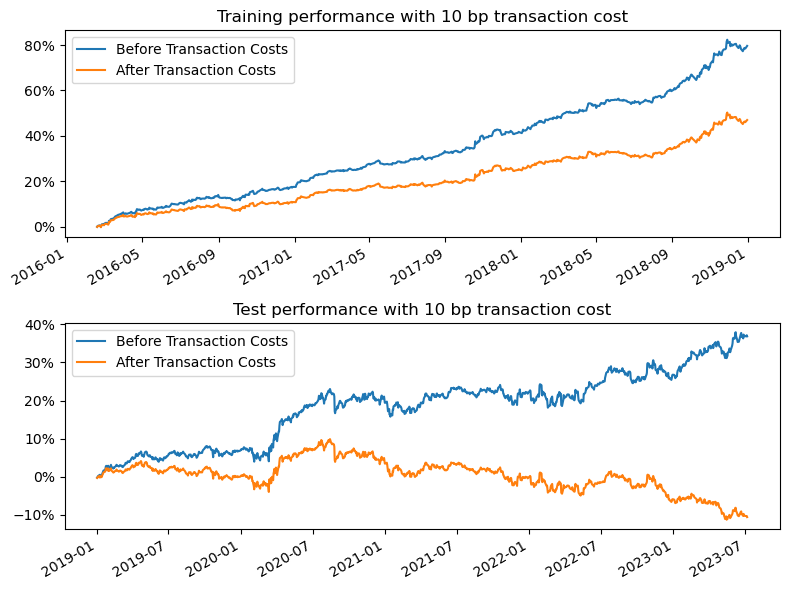
Figure 2: The test and training return of daily price after considering the transaction cost.
After considering the transaction cost, according to Figure 2, the phenomenon that with the amount of transaction cost increasing, the return of the whole strategy would decrease to a higher level would be obtained. While the transaction cost is 10 one ten-thousandth, the test performance of the strategy would only be positive at a short period with low return, which shows that the transaction cost would cause serious adverse effects towards the strategy's return. Therefore, while the transaction cost is more than 10 one ten-thousandth, though the training performance is relatively fine, the whole strategy would perform negatively and unprofitable because of considerable trading costs.
3.2.Monthly Result Display
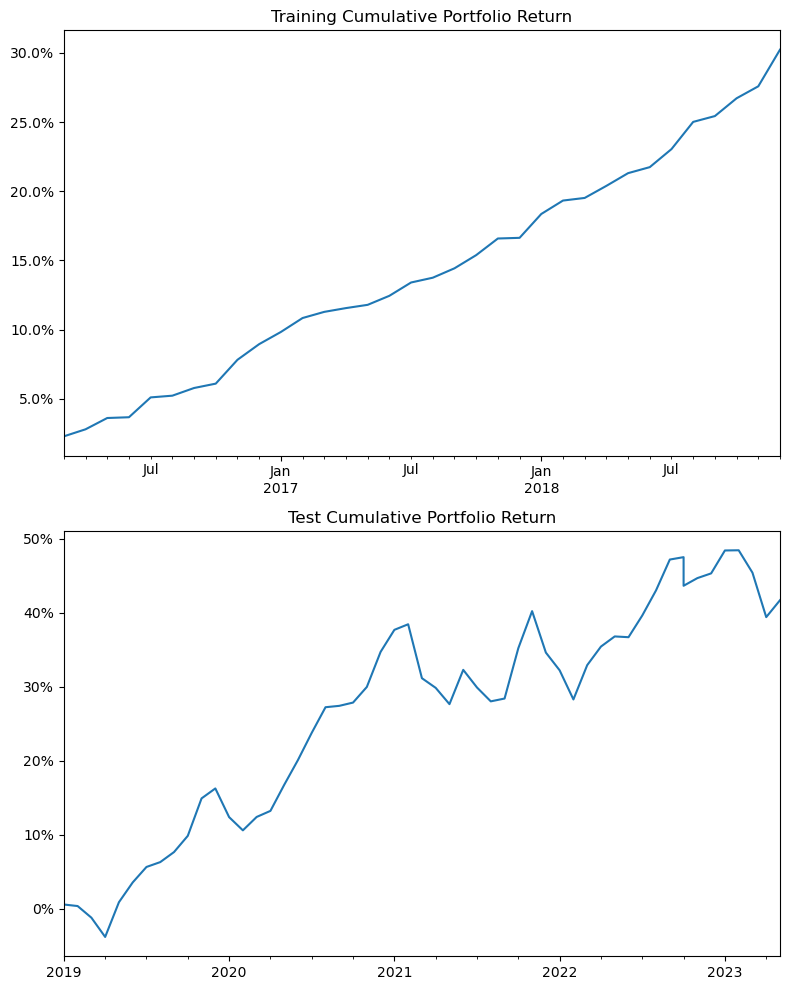

Figure 3: The test and training return of monthly price.
According to Figure 3, the test and training return of the overall strategy structured by monthly stock data of the top thirty internet technology corporations listed on the US stock market, the conclusion that the return of train has a positive relationship with the period and the return of test has massive fluctuation would be obtained. The test return would reach 50% at the peak point, and the training return would attain the highest 30%. That means internet technology companies' progress tendency and prospect is profitable and advantageous. Although there are some fluctuations and instability throughout the period, the general increasing trend and positive return of strategy would be undisputed. In summary, the traditional momentum strategy shows reasonable and profitable performance when applied to internet technology companies through the past eight years of data.
Table 3: The analysis of the test result of monthly price. | ||||
Indicator | Shape Ratio | Max Drawdown | Skewness | Kurtosis |
Value | 0.2776 | 0.0851 | -0.3790 | 2.6265 |
Table 4: The analysis of the training result of monthly price. | ||||
Indicator | Shape Ratio | Max Drawdown | Skewness | Kurtosis |
Value | 1.4031 | 0.0 | 0.9818 | 3.7693 |
Based on Table 3 and Table 4, the shape ratio of the test is similar to the test shape ratio of daily data and relatively small. On the contrary, the shape ratio of training is larger than 1, which means that the whole strategy performs well during training but badly during the test while considering the risk. The maximum drawdowns of both test and train are also numerically small, which means that the variation of the overall assets from the maximum to the minimum is small, and the whole property of stock is steady. The skewness of the test is negative, showing that the statistical data of all stocks during the test is a negative deviation of the distribution. Conversely, the skewness of training is positive and approximately 1, which shows that the whole statistical data of the stocks during training is a positive deviation of the distribution. Each kurtosis is positive and larger than one, meaning that the overall distribution of the statistical data of the stocks is steeper than the normal distribution with a sharp peak.
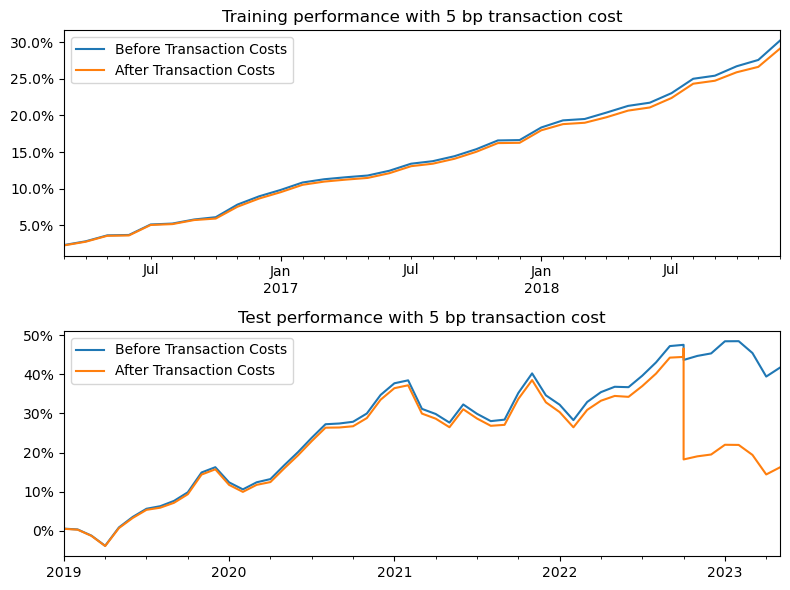
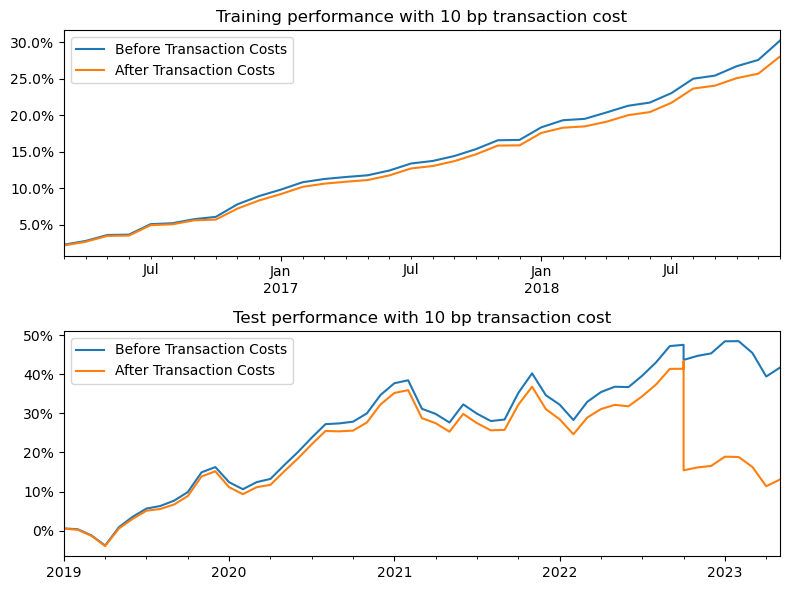
Figure 4: The test and training return of monthly price after considering the transaction cost.
After considering the transaction cost, based on the figure 4, the phenomenon that the overall return of strategy decreases to a small level would be acquired. Compared with the performance of the strategy using the daily data while considering the transaction cost, the decreased degree of transaction cost using the monthly data is much smaller. This abnormality might be due to the decrease in trading cost caused by the decrease in transaction frequency, which only happens once a month. This phenomenon means that though there are different transaction cost levels, the trading strategy using the monthly data would keep purchasing or selling because of the low adverse influence towards the return of the transaction cost. However, during the test process, the unusual phenomenon that after transaction cost, the return decreases fiercely from 2022-09 would be caused by the acute increase of transaction cost caused by the wild fluctuation of different stocks' weight.
4. Discussion
4.1.Reason Analysis
In the beginning, the overall tendency of internet technology companies containing the digital economy and their corresponding stocks is positive and hopeful with the policy and financial support of the government [14]. While applying the momentum strategy in the internet technology companies' stocks, the return is positive. It increases with time because the whole internet and technology sector's trend is positive, and the momentum strategy, particularly with monthly data, is relatively suitable for the stock market. In addition, the disposition effect would drive the development and change of general momentum indicators causing variation in the ability to profit from the momentum strategy [15]. In summary, all these factors contribute to the increase of the overall technology sector and the return of the momentum strategy.
4.2.Result Analysis
According to the continuously steady and positive development trend and perspective of the overall strategy, the investment in the entire industry of internet technology is advantageous and profitable. At the same time, because of the positive influence of the internet on the import and export of companies, internet technology companies would have a relatively large space for development in the future, which will bring more investment returns for investors [16]. While selecting the companies included in the strategy, it is possible to focus on large internet technology companies such as Apple and Microsoft and distribute more investment among them because of the brand effect [17]. In addition, a small part of investment can be invested in emerging internet technology companies to obtain higher returns.
4.3.Limitation Analysis
It should be noted that because the data used in this paper are obtained through the API from the alpha vantage website, processing some variable data in this paper has limitations. First of all, the data itself may need to be more accurate due to inadequate updates or inaccurate recording of the website, which would affect the overall results. Secondly, this model construction only uses the traditional momentum model, which only partially forecasts and reflects the stock market's movements. Although factors are added to the model according to the Fama-French three-factor model, other data supports are not considered in the overall strategy and model construction. Therefore, there will be some errors in the model itself. Finally, as the total amount of company stock data included in the strategy is only 30 in the past eight years, the small amount of data will cause systematic errors and influence the overall result.
5. Conclusion
This study has three findings. Firstly, suppose its development trend in the past period is kept. In that case, the development prospects of internet technology companies and the stock market's overall scientific and creative sector are broad and internet technology companies have a bright future. In addition, there is a large space for the progress and expansion of internet technology companies in the future. Secondly, Apple attracts many consumers and gradually develops into an internet technological giant through its product design and innovation. Thirdly, relying on the development and progress of the science and technology part, the momentum strategy has good performance and relatively high returns in the science and technology part. However, the momentum strategy has a moderate performance and could not benefit investors economically. Although the outbreak of the COVID-19 epidemic in 2020 caused huge losses to the overall industry economy and led to economic regression in many fields, it did not have much impact on the internet-related economy. It even caused most people to work at home due to the blockade strategy, which increased the demand for internet technology and promoted the development of related industries. Therefore, with the help of more financing, internet technology companies could increase their investment in scientific research to obtain considerable results, profit, and development. As for the momentum strategy, its performance could be better because it cannot fully reflect the market trend, and its structure is relatively simple, even if the strategy is applied to the rapidly developing internet industry. Finally, this study only considers the leading companies and their stocks in Internet technology, not other startups. Meanwhile, improving the traditional momentum strategy includes the three factors in the fama-french model. In the future, relevant research can increase the number of companies, extend the time, and consider more factors and indicators to improve the model and the whole analysis process.
References
[1]. Zuo, L., Li, H., Gao, H. and Zhu, M. (2022). Sustainable improvement of efficiency of Internet companies in the context of digital transformation. Sustainability, 14(9), 5600.
[2]. Faghih, N., Dastourian, B., Sajadi, S. M., Henten, A. and Foroudi, P. (2018). A business model framework for strategic innovation in ICT firms: the importance of information. The Bottom Line, 31(1), 16-41.
[3]. Aydoğan, F. (2022). Digital Citizenship: Beyond Big Data, technical skills, Industry 4.0 and COVID-19. Omics : A Journal of Integrative Biology, 26(11), 589-593.
[4]. Gao, H. and Chen, D. (2023) The Analysis of the Effectiveness of China Science and Technology Board Market [J]. Hebei Finance , No.548(04), 32-38.
[5]. Li, Q., Chen, J. and Zhang, H. (2023) Research on stock market liquidity and Enterprise Innovation based on Science and Technology Board listed enterprises [J/OL]. Operation and Management, 1-10.
[6]. Dobrolyubova, E. (2021). Measuring outcomes of digital transformation in public administration: Measuring the outcomes of the digital transformation of public administration: a literature review and possible steps forward. Network of colleges and Schools of Public Administration in Central and Eastern Europe. the NISPAcee Journal of Public Administration and Policy, 14(1), 61-86.
[7]. Hamdouch, A. and Samuelides, E. (2001). The innovation dynamics of mobile phone services in France. European Journal of Innovation Management, 4(3), 153-162.
[8]. Yang, Y. (2022). The rise and fall of mobile phone companies: an analysis of competitive advantage based on patents. Contemporary Management Research, 18(2), 133-163.
[9]. Kasperek, D., Antonowicz, P., Baranowski, M., Sokolowska, M. and Podpora, M. (2023). Usability comparison of Apple M2 and M1 processors for various machine learning tasks. Sensors, 23(12), 5424.
[10]. Edwards, J. (2019). Signal Processing Drives Consumer electronics: New research influences and improves how users interact with mobile and wearable devices in their daily lives [Special Report]. IEEE Signal Processing Magazine, 36(3), 12-15.
[11]. Guo, J., Zhang, Y. and Cao, C. (2022). Research on the driving path of ambidextrous innovation in science and technology enterprises: An exploration based on qualitative comparative analysis of fuzzy sets. Mathematical Problems in Engineering, 2022.
[12]. Tuna, G. and Yildiz, S. (2016). The impact of operating expenditure on corporate performance in Turkey: evidence from the technology sector. Ekonomika, 62(4), 1-15.
[13]. Louis K. C. C., Jegadeesh, N. and Lakonishok, J. (1996). Momentum Strategies. The Journal of Finance, 51(5), 1681–1713.
[14]. Mickiewicz, B. and Volkava, K. (2022). Digital economy development status, evaluation and direction. VUZF Review, 7(2), 78-87.
[15]. Sadhwani, R. and Bhayo, M. U. R. (2021). Momentum and disposition effect in the US stock market. Cogent Economics and Finance, 9(1)
[16]. Huang, X., Song, X. and Hu, X. (2018). Does “Internet plus” promote new export space for firms? evidence from china. China and World Economy, 26(6), 50-71.
[17]. Crass, D., Czarnitzki, D. and Toole, A. A. (2019). The dynamic relationship between investments in brand equity and firm profitability: Evidence using trademark registrations. International Journal of the Economics of Business, 26(1), 157-176.
Cite this article
Wang,H. (2023). Investment Strategy Analysis of Internet and Technology Companies —Taking Apple Inc as an Example. Advances in Economics, Management and Political Sciences,48,116-124.
Data availability
The datasets used and/or analyzed during the current study will be available from the authors upon reasonable request.
Disclaimer/Publisher's Note
The statements, opinions and data contained in all publications are solely those of the individual author(s) and contributor(s) and not of EWA Publishing and/or the editor(s). EWA Publishing and/or the editor(s) disclaim responsibility for any injury to people or property resulting from any ideas, methods, instructions or products referred to in the content.
About volume
Volume title: Proceedings of the 2nd International Conference on Financial Technology and Business Analysis
© 2024 by the author(s). Licensee EWA Publishing, Oxford, UK. This article is an open access article distributed under the terms and
conditions of the Creative Commons Attribution (CC BY) license. Authors who
publish this series agree to the following terms:
1. Authors retain copyright and grant the series right of first publication with the work simultaneously licensed under a Creative Commons
Attribution License that allows others to share the work with an acknowledgment of the work's authorship and initial publication in this
series.
2. Authors are able to enter into separate, additional contractual arrangements for the non-exclusive distribution of the series's published
version of the work (e.g., post it to an institutional repository or publish it in a book), with an acknowledgment of its initial
publication in this series.
3. Authors are permitted and encouraged to post their work online (e.g., in institutional repositories or on their website) prior to and
during the submission process, as it can lead to productive exchanges, as well as earlier and greater citation of published work (See
Open access policy for details).
References
[1]. Zuo, L., Li, H., Gao, H. and Zhu, M. (2022). Sustainable improvement of efficiency of Internet companies in the context of digital transformation. Sustainability, 14(9), 5600.
[2]. Faghih, N., Dastourian, B., Sajadi, S. M., Henten, A. and Foroudi, P. (2018). A business model framework for strategic innovation in ICT firms: the importance of information. The Bottom Line, 31(1), 16-41.
[3]. Aydoğan, F. (2022). Digital Citizenship: Beyond Big Data, technical skills, Industry 4.0 and COVID-19. Omics : A Journal of Integrative Biology, 26(11), 589-593.
[4]. Gao, H. and Chen, D. (2023) The Analysis of the Effectiveness of China Science and Technology Board Market [J]. Hebei Finance , No.548(04), 32-38.
[5]. Li, Q., Chen, J. and Zhang, H. (2023) Research on stock market liquidity and Enterprise Innovation based on Science and Technology Board listed enterprises [J/OL]. Operation and Management, 1-10.
[6]. Dobrolyubova, E. (2021). Measuring outcomes of digital transformation in public administration: Measuring the outcomes of the digital transformation of public administration: a literature review and possible steps forward. Network of colleges and Schools of Public Administration in Central and Eastern Europe. the NISPAcee Journal of Public Administration and Policy, 14(1), 61-86.
[7]. Hamdouch, A. and Samuelides, E. (2001). The innovation dynamics of mobile phone services in France. European Journal of Innovation Management, 4(3), 153-162.
[8]. Yang, Y. (2022). The rise and fall of mobile phone companies: an analysis of competitive advantage based on patents. Contemporary Management Research, 18(2), 133-163.
[9]. Kasperek, D., Antonowicz, P., Baranowski, M., Sokolowska, M. and Podpora, M. (2023). Usability comparison of Apple M2 and M1 processors for various machine learning tasks. Sensors, 23(12), 5424.
[10]. Edwards, J. (2019). Signal Processing Drives Consumer electronics: New research influences and improves how users interact with mobile and wearable devices in their daily lives [Special Report]. IEEE Signal Processing Magazine, 36(3), 12-15.
[11]. Guo, J., Zhang, Y. and Cao, C. (2022). Research on the driving path of ambidextrous innovation in science and technology enterprises: An exploration based on qualitative comparative analysis of fuzzy sets. Mathematical Problems in Engineering, 2022.
[12]. Tuna, G. and Yildiz, S. (2016). The impact of operating expenditure on corporate performance in Turkey: evidence from the technology sector. Ekonomika, 62(4), 1-15.
[13]. Louis K. C. C., Jegadeesh, N. and Lakonishok, J. (1996). Momentum Strategies. The Journal of Finance, 51(5), 1681–1713.
[14]. Mickiewicz, B. and Volkava, K. (2022). Digital economy development status, evaluation and direction. VUZF Review, 7(2), 78-87.
[15]. Sadhwani, R. and Bhayo, M. U. R. (2021). Momentum and disposition effect in the US stock market. Cogent Economics and Finance, 9(1)
[16]. Huang, X., Song, X. and Hu, X. (2018). Does “Internet plus” promote new export space for firms? evidence from china. China and World Economy, 26(6), 50-71.
[17]. Crass, D., Czarnitzki, D. and Toole, A. A. (2019). The dynamic relationship between investments in brand equity and firm profitability: Evidence using trademark registrations. International Journal of the Economics of Business, 26(1), 157-176.