


1. Introduction
Investors usually want to obtain maximum with minimum risk. Faced with these two conflicting investment objectives, the investment decision should be set to invest in several securities simultaneously. That is, to construct a portfolio and implement diversification of investment. In this case, the losses caused by the falling prices of some securities can be compensated by the gains caused by the rising prices of some other securities. Diversification can enhance the welfare of households by reducing their exposure to any particular risk of speculation undertaken by them. In recent years, China's capital market has been developing continuously and has begun to become weak and effective. However, China's capital market is characterized as late start, imperfect laws and regulations, unreasonable investor structure and numerous factors affecting securities prices, and thus huge risks have been brought to investors, and social instability has been indirectly increased. The construction of an investment portfolio can use the negative correlation between securities to offset fluctuations, stabilize investor sentiment, disperse risks and bring greater utility to investors.
Since Markowitz pioneered modern portfolio theory in 1952, the development of portfolio theory has entered a new stage. Modern portfolio theory holds that, based on metrics such as variance and correlation, an investor can build a portfolio of multiple assets that can deliver higher returns without increasing risk. This theory assumes that investors are risk averse and that the ultimate goal is to create the most efficient combination [1]. Sharp (1964) stated that the asset pricing Model (CAPM) was on the basis of portfolio theory, which became another cornerstone of portfolio management, and CAPM describes the association between an asset's systemic risk and expected return and is widely used to price risky securities [2].
Sirtee & Alagidede found that Sterling and Treynor ratios can provide better-performing portfolios, with the statistical distribution helping investors use them in a proper time [3]. These new methods help produce an ebtter performance in current indices, and make funds more robust than the capital asset pricing model that is utilized to analyze investment portfolios [3]. Donghan studied the price-to-book ratio of stocks under the background of stochastic portfolio theory and presented portfolio examples and their empirical results, finding that in addition to scale, value factors affect portfolio performance [4]. In growing artificial intelligence, Jang & Seong take consideration of both the modern portfolio theory with reinforcement learning theory to solve multimodal problems by performing Tucker decomposition based on a model using technical analysis and stock returns. It is found that the proposed method has better performance than the most advanced algorithms with respect to Sharpe ratio, annualized return, and maximum retract [5].
However, because of the late start of China's capital market, the research on investment portfolios could be much better, and the current research is closely related to the frontier hot spots. From the perspective of investment in new R&D institutions, Zhang et al. constructed the Markowitz mean-variance theory model and used a non-dominated ranking genetic algorithm to simulate and test the applicability of decentralized strategy in venture capital of new R&D institutions, showing that the diversified portfolio strategy can effectively reduce the non-systemic risk brought by a single project of a new R&D institution [6]. Wang et al. introduced the portfolio theory from economics as a trade-off tool between returns and risks against the background of the "dual carbon" goal and proposed a power allocation method for wind-view storage stations to participate in the day-before, intra-day and real-time markets so that wind-view storage stations can obtain maximum returns while bear minimum risks [7].
In order to fill the gap in the research of mean-variance theory in the Chinese capital market, this paper selects six stocks in different industries of Yahoo Finance and analyzes their adjusted closing prices. We divided the adjusted closing price into a training set and a test set, used the mean-variance model of "maximum return under tolerable risk conditions" to find covariance, correlation coefficient and other indicators among stocks, and obtained the maximum Sharpe ratio comparison chart and minimum volatility ratio comparison chart. After removing the least weighted asset in the maximum Sharpe ratio portfolio, the return of the effective frontier, the return of the maximum Sharpe ratio portfolio and the return of the minimum volatility portfolio, the return of the effective frontier, the return of the maximum Sharpe ratio portfolio and the return of the minimum volatility portfolio, the return of the minimum volatility portfolio are recalculated. Finally, the portfolio is compared with the market, and the difference between the portfolio constructed by this method and the market's overall performance is obtained.
2. Data
This paper picks 6 stocks from Yahoo Finance from the cloud, which are Ping An Bank, Yunnan Baiyao, Wuliangye, IFLYTEK, HITHINK ROYALFLUSH, and Shenzhen Fountain. The reason why we choose these 6 stocks is that they essentially occupy leading positions in their respective industries and their excellent performance is favored by investors.
We select adjust close prices of these six stocks in the period of January 1st,2015 to December 31st,2019, and divide them into training set and testing set. Use the first four years’ data from January 1st,2015 to December 31st,2018 to find the optimal weighting ratio for the portfolio of these six stocks. Then based on the weighting ratio we get, calculate actual earnings in the remaining year from January 1st,2019 to December 31st,2019, and contrast them with the market in order to evaluate the performance of the portfolio model. The basic information of six stocks is shown in Table 1 below:
Table 1: Descriptive statistics of assets.
Min | Max | Mean | Variance | |
PingAn Bank | -0.179119 | 0.100351 | 0.00007 | 0.000467 |
Yunnan Baiyao | -0.281594 | 0.100039 | 0.000107 | 0.000453 |
Wuliangye | -0.100164 | 0.100025 | 0.001272 | 0.0006 |
IFLYTEK | -0.334754 | 0.100167 | 0.001067 | 0.001071 |
HITHINK ROYALFLUSH | -0.450205 | 0.180802 | 0.001454 | 0.001462 |
Shenzhen Fountain | -0.101010 | 0.101562 | -0.000229 | 0.000756 |
According to Table 1, both minimum and maximum return belong to HITHINK ROYALFLUSH. Besides HITHINK ROYALFLUSH has the highest average return while Shenzhen Fountain’s average revenue is negative during the selected period. In terms of variance of each stock’s return, Yunnan Baiyao is the lowest, meaning it has no huge fluctuations and is more stable than others, whereas HITHINK ROYALFLUSH is larger than other five stocks.
3. Method
As we all know, financial markets change rapidly and there is no single theoretical model that can be applied to any situation in the securities environment. Therefore, each model has its corresponding assumptions, so as mean-variance model which assumes following premises [8]:
Each asset portfolio analysis is performed in a specific single period.
Investors evaluate the risk of asset portfolio based on two knowable parameters: mean and variance.
All assets are at risk and infinitely divisible.
Returns on all assets are normally distributed and returns on each asset are linearly uncorrelated.
Investors seek to maximize return for the same risk profile or consider minimizing risk for the same level of return.
There are two classical types of mean-variance models, one is to obtain maximum return under tolerable risk conditions and the other is to minimize risk provided a certain level of return is achieved [9]. Portfolio return is calculated by adding the product of each stock’s return rate and its weight:
\( E({R_{p}})=\sum _{i=1}^{6}{w_{i}}{r_{i}} \) (1)
Where \( {R_{p}} \) represents the returns of portfolio, \( {w_{i}} \) is the weight of each asset and \( {r_{i}} \) is the return rate of each asset. Then we need to calculate the variance of the return we got before to measure its performance:
\( σ_{p}^{2}=var{(\sum _{i=1}^{6}{w_{i}}{r_{i}})}=\sum _{i=1}^{6}\sum _{j=1}^{6}{w_{i}}{w_{j}}{σ_{ij}} \) (2)
Where \( σ_{p}^{2} \) is the variance of the portfolio, \( {σ_{ij}} \) is the covariance of two assets. Also, Sharpe Ratio is a common method to measure the risk of our portfolio model:
\( SR=\frac{E({R_{p}})-{R_{f}}}{{σ_{p}}} \) (3)
Where \( {R_{f}} \) is the return of asset under risk-free [10]. In this paper we focus on two specific models: minimum variance and maximum Sharpe rate.
4. Results
4.1. Effective Frontiers
We first implement the Monte Carbo simulation, and the results are shown in the following Figure 1:
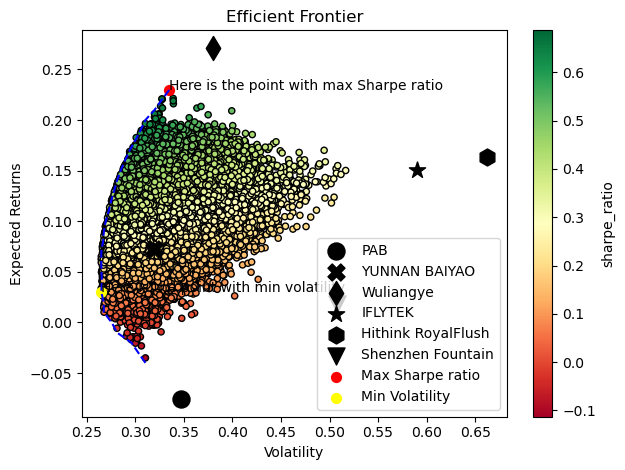
Figure 1: Effective frontiers.
4.2. Analysis the Portfolios and Back Testing
The portfolios with maximum Sharpe ratio and minimum volatility would be a good choice. Portfolio with the maximum Sharpe ratios strike a good balance between risk and return, while portfolios with minimal volatility achieve higher returns while reducing risk.
4.2.1. Portfolio with Maximum Sharpe Ratio
By portfolio with maximum Sharpe ratio, we have the Sharpe ratio equal to 68.70%. Figure 2 shows that Wuliangye is 73.55% weighted. It is the one with the highest proportion. While the Shenzhen Fountain is only 0.16% weighted.
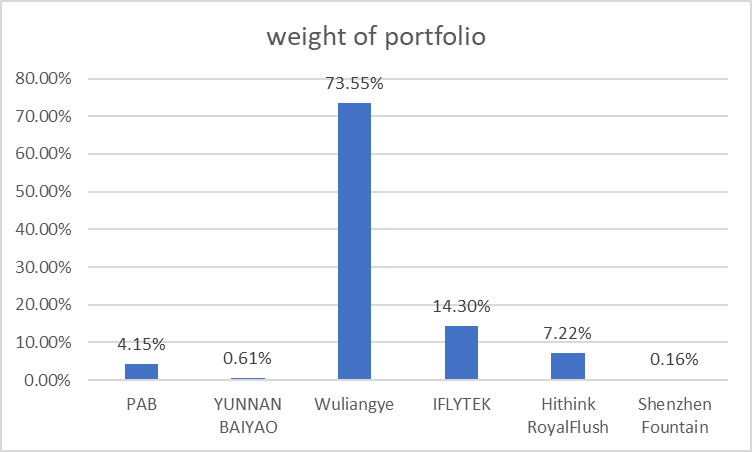
Figure 2: Weight of portfolio.
We combine the above weights and the real return of the assets, calculating the real return of the portfolio in the test period. Then, the cumulative return is shown in Figure 3:
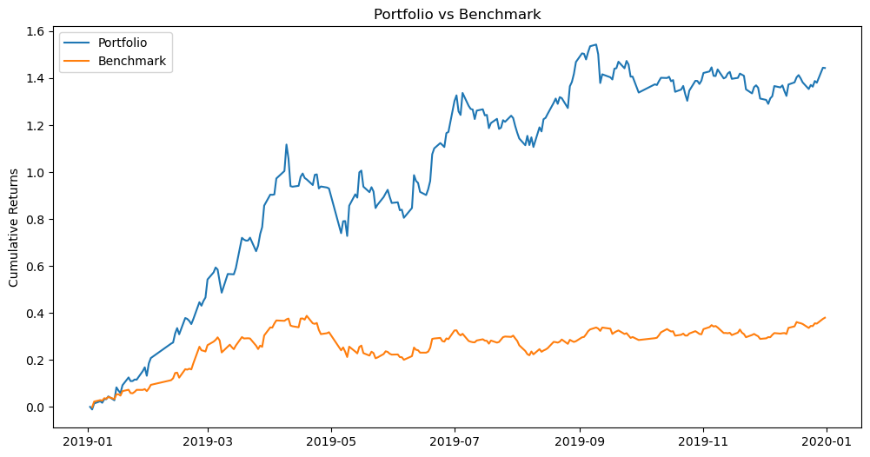
Figure 3: Cumulative return.
Through backtesting, we found that the portfolio with the maximum Sharpe ratio yielded significantly higher returns than the market. Although the portfolio has shown great responsiveness to market volatility, it can be very profitable when the market is doing well.
4.2.2. Portfolio with Minimum Volatility
By portfolio with minimum volatility, we have the volatility equal to 26.48%. It shows that PAB and YUNNAN BAIYAO are 37.78% and 37.85% weighted. They are the two with the highest proportion. While the Hithink RoyalFlush is only :0.73% weighted (See Figure 4).
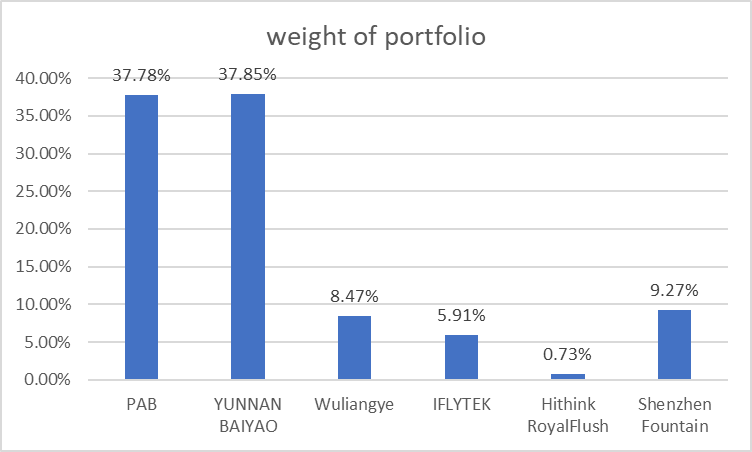
Figure 4: Weight of portfolio.
Similarly, the cumulative return of this case is shown in the Figure 5:
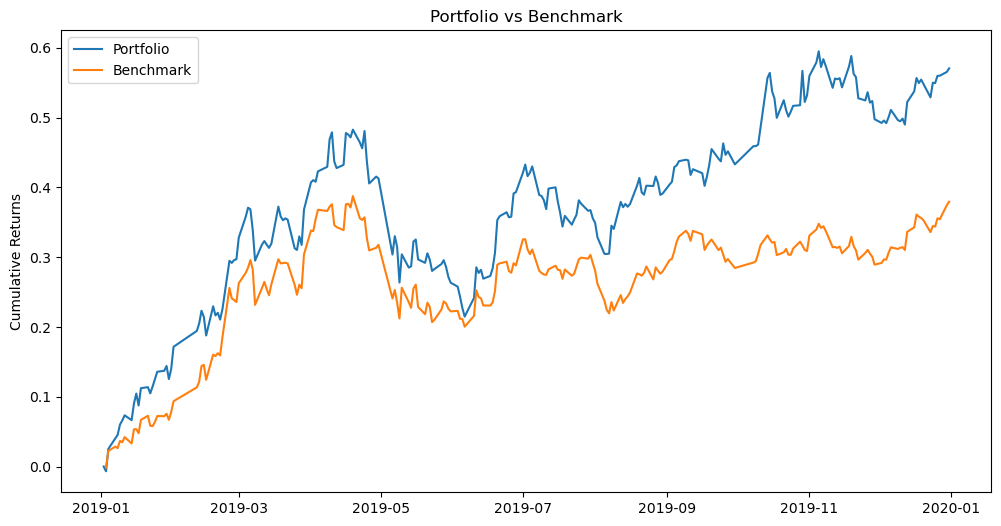
Figure 5: Cumulative return.
The portfolio’s returns are not as high as the portfolio with maximum Sharpe ratio. But it has shown resistance to market volatility and still has returns over the market. When the market is not optimistic, it can still guarantee that the losses will not be too large.
4.3. Stability Testing
By removing the stock with smallest proportion in the portfolios, the stability of the portfolios could be tested. The author would build new effective frontiers without the stocks with smallest proportion in the portfolios separately.
4.3.1. Effective Frontiers Without Shenzhen Fountain
Through a Monte Carlo simulation, the author generates a large number of random weights and records the expected returns and variance of the random portfolio (See Figure 6).
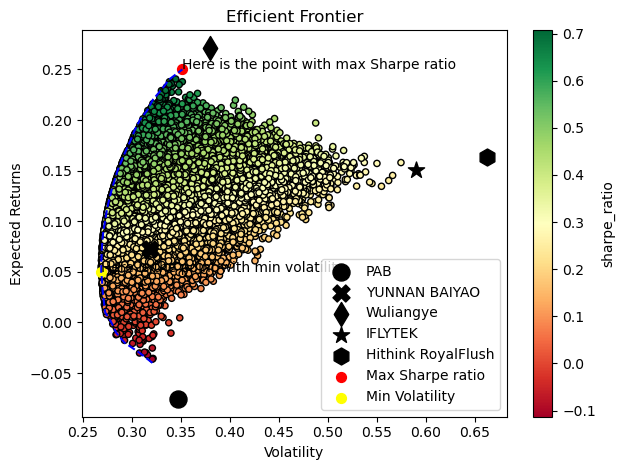
Figure 6: Effective frontiers.
By portfolio with maximum Sharpe ratio, we have the Sharpe ratio equal to 70.71%. Figure 7 shows that Wuliangye is 83.12% weighted. It is still the one with the highest proportion.
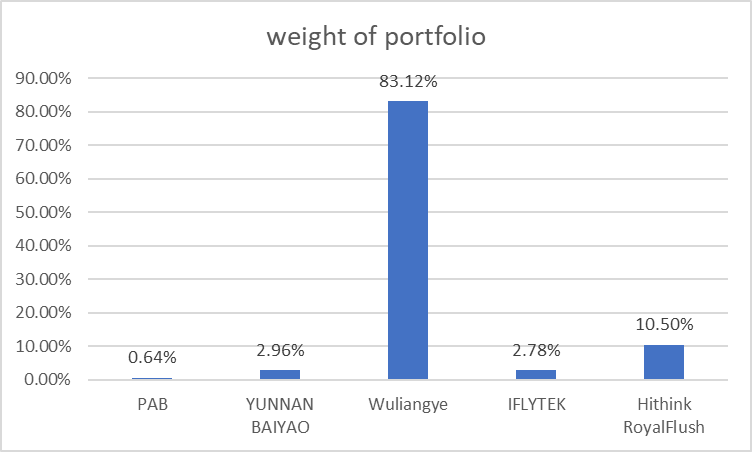
Figure 7: Weight of portfolio.
The cumulative return is shown below in Figure 8:
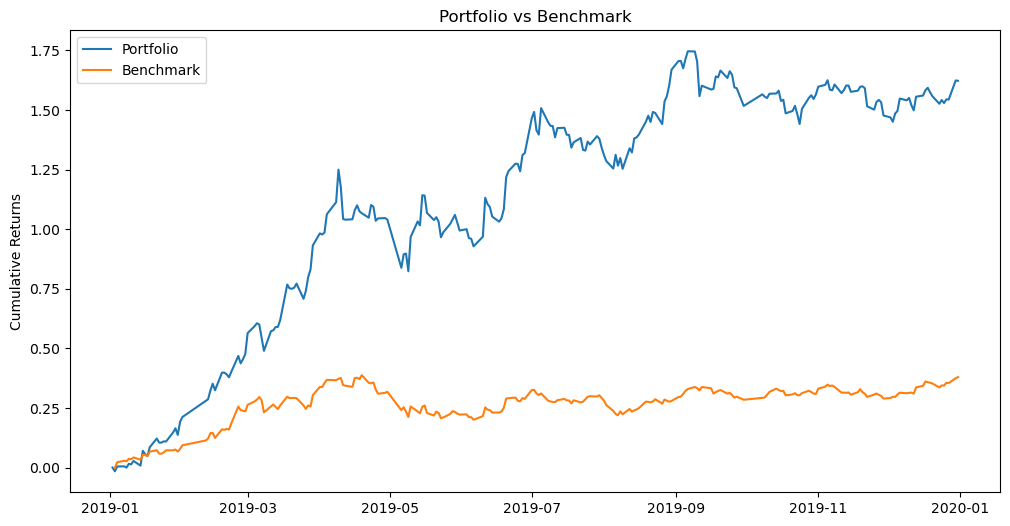
Figure 8: Cumulative return.
By portfolio with minimum volatility, we have the volatility equal to 26.87%. Figure 9 shows that PAB and YUNNAN BAIYAO are 34.45% and 43.30% weighted. They are still the two with the highest proportion.
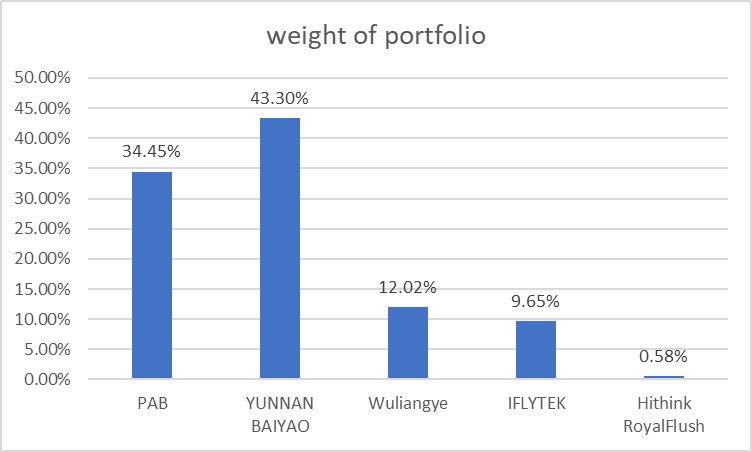
Figure 9: Weight of portfolio.
The cumulative return is shown in Figure 10:
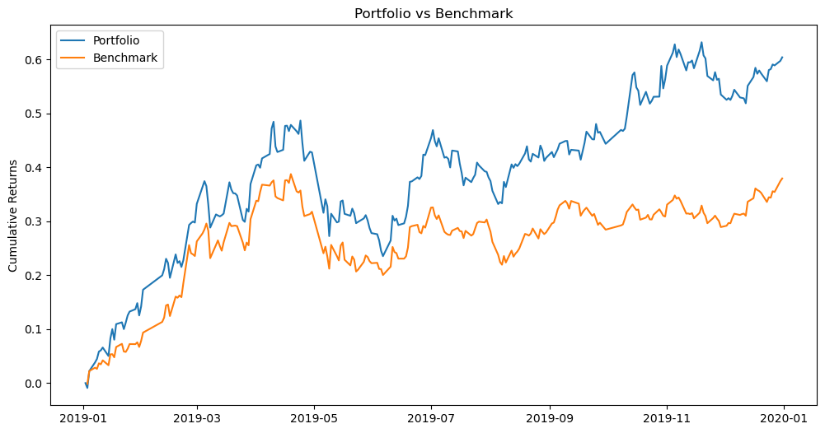
Figure 10: Cumulative return.
4.3.2. Effective Frontiers Without Hithink RoyalFlush
Through a Monte Carlo simulation, the authors generate a large number of random weights and records the expected returns and variance of the random portfolio (See Figure 11).
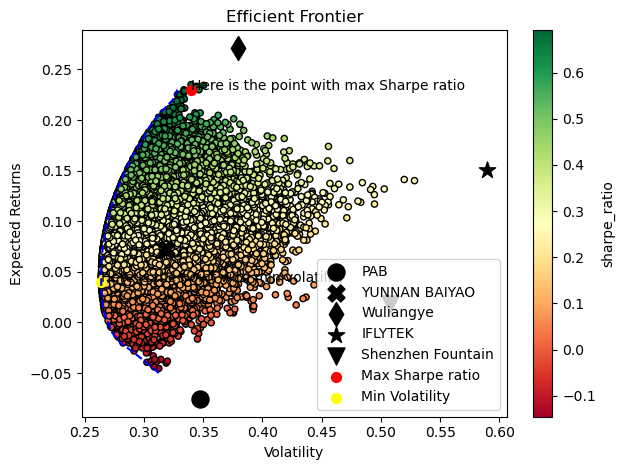
Figure 11: Effective frontiers.
By portfolio with maximum Sharpe ratio, we have the Sharpe ratio equal to 69.15%. Figure 12 shows that Wuliangye is 80.91% weighted. It is still the one with the highest proportion. The cumulative return is shown in Figure 13:
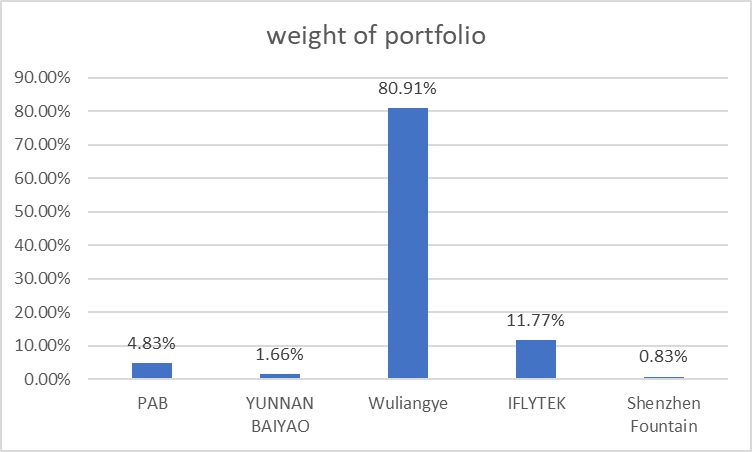
Figure 12: Weight of portfolio.
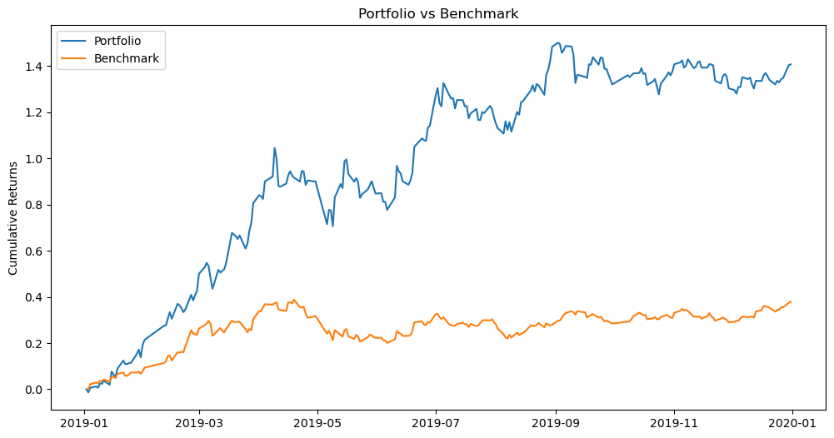
Figure 13: Cumulative return.
By portfolio with minimum volatility, we have the volatility equal to 26.39%. Figure 14 shows that PAB and YUNNAN BAIYAO are 32.72% and 39.74% weighted. They are still the two with the highest proportion. The cumulative return is shown in Figure 15:
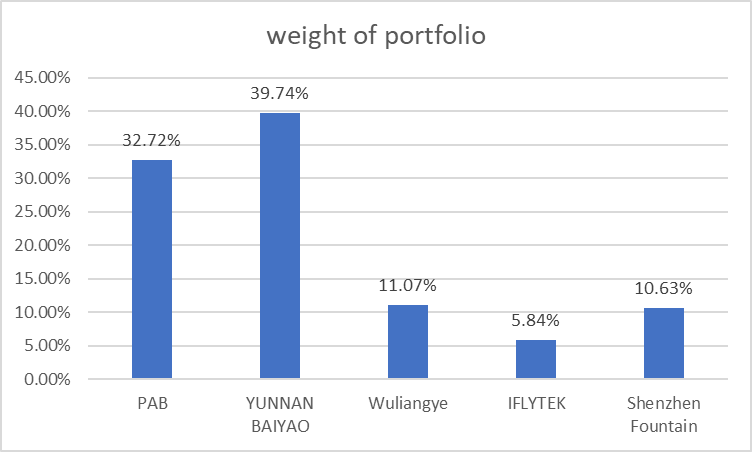
Figure 14: Weight of portfolio.
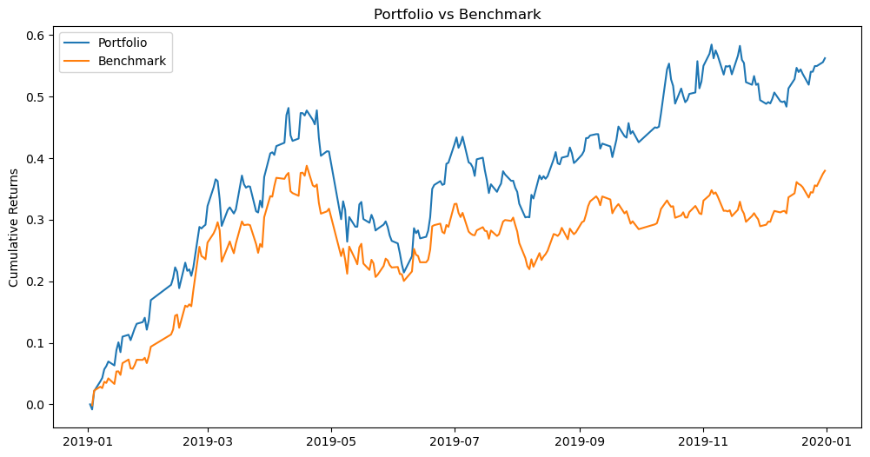
Figure 15: Cumulative return.
Thus, these portfolios are stable while removing the stocks that are not heavy weighted.
5. Conclusion
Overall, this paper uses Monte Carlo simulation to simulate a hundred thousand random portfolios. Then adopt the mean-variance model to examine two portfolio allocation approaches: minimum variance and maximum Sharp ratio for 6 selected Chinese stocks. By plotting the expected return chart against volatility, the data is visualized, allowing for a clear understanding of the efficient frontier.
By comparing with CSI 300 Index, it is obvious to find that both two portfolios exceed the market, with the maximum Sharp ratio portfolio yielding the highest cumulative return. After removing the smallest share of stocks in the two scenarios, respectively, the maximum Sharpe ratio model and the minimum variance model still outperform the market in terms of returns, with the maximum Sharp ratio model earning much higher than others.
In terms of gaining return, there is no doubt that the maximum Sharp ratio model is the best choice. But such high returns come with a corresponding high risk. Investors should choose the appropriate investment strategy according to their risk tolerance. When the market is pessimistic, it is recommended to apply the minimum variance portfolio which is more consistent with the investment portfolio's goals of taking the least risk.
Authors Contribution
All the authors contributed equally, and their names were listed in alphabetical order.
References
[1]. Markowitz H. (1952) Portfolio Selection. The Journal of Finance, 7, 77-91.
[2]. Sharp, W. F. (1963) A Simplified Model for Portfolio Analysis. Management Science, 9, 277-293.
[3]. Surtee, T. G.H., and Alagidede, I. P. (2023). A novel approach to using modern portfolio theory. Borsa Istanbul Review, 23(3), 527-540.
[4]. Kim, D. (2023) Market-to-book ratio in stochastic portfolio theory. Finance and Stochastics, 27, 401-434.
[5]. Jang, J., and Seong, N. (2023) Deep reinforcement learning for stock portfolio optimization by connecting with modern portfolio theory. Expert Systems With Applications, 218 (15), 119556.
[6]. Zhang et al. (2022) Application of diversified investment strategy in venture capital of new R&D institutions: Based on the perspective of Markowitz Portfolio Theory. Science and Technology Management Research, 22, 145-152.
[7]. Wang et al. (2023) Power allocation optimization method of Fengguang storage Station participating in multi-time scale power spot market based on portfolio theory. Engineering Science and Technology, 55(1), 101-109.
[8]. Rubinstein, M. (2002) Markowitz's" portfolio selection": A fifty-year retrospective. The Journal of finance, 57(3), 1041-1045.
[9]. Pástor, Ľ. (2000) Portfolio selection and asset pricing models. The Journal of Finance, 55(1), 179-223.
[10]. Agarwal, V., and Naik, N. Y. (2004) Risks and portfolio decisions involving hedge funds. The Review of Financial Studies, 17(1), 63-98.
Cite this article
Chen,Z.;Gao,J.;Yang,Y. (2023). Portfolio Optimization Based on Six Chinese Stocks. Advances in Economics, Management and Political Sciences,48,207-216.
Data availability
The datasets used and/or analyzed during the current study will be available from the authors upon reasonable request.
Disclaimer/Publisher's Note
The statements, opinions and data contained in all publications are solely those of the individual author(s) and contributor(s) and not of EWA Publishing and/or the editor(s). EWA Publishing and/or the editor(s) disclaim responsibility for any injury to people or property resulting from any ideas, methods, instructions or products referred to in the content.
About volume
Volume title: Proceedings of the 2nd International Conference on Financial Technology and Business Analysis
© 2024 by the author(s). Licensee EWA Publishing, Oxford, UK. This article is an open access article distributed under the terms and
conditions of the Creative Commons Attribution (CC BY) license. Authors who
publish this series agree to the following terms:
1. Authors retain copyright and grant the series right of first publication with the work simultaneously licensed under a Creative Commons
Attribution License that allows others to share the work with an acknowledgment of the work's authorship and initial publication in this
series.
2. Authors are able to enter into separate, additional contractual arrangements for the non-exclusive distribution of the series's published
version of the work (e.g., post it to an institutional repository or publish it in a book), with an acknowledgment of its initial
publication in this series.
3. Authors are permitted and encouraged to post their work online (e.g., in institutional repositories or on their website) prior to and
during the submission process, as it can lead to productive exchanges, as well as earlier and greater citation of published work (See
Open access policy for details).
References
[1]. Markowitz H. (1952) Portfolio Selection. The Journal of Finance, 7, 77-91.
[2]. Sharp, W. F. (1963) A Simplified Model for Portfolio Analysis. Management Science, 9, 277-293.
[3]. Surtee, T. G.H., and Alagidede, I. P. (2023). A novel approach to using modern portfolio theory. Borsa Istanbul Review, 23(3), 527-540.
[4]. Kim, D. (2023) Market-to-book ratio in stochastic portfolio theory. Finance and Stochastics, 27, 401-434.
[5]. Jang, J., and Seong, N. (2023) Deep reinforcement learning for stock portfolio optimization by connecting with modern portfolio theory. Expert Systems With Applications, 218 (15), 119556.
[6]. Zhang et al. (2022) Application of diversified investment strategy in venture capital of new R&D institutions: Based on the perspective of Markowitz Portfolio Theory. Science and Technology Management Research, 22, 145-152.
[7]. Wang et al. (2023) Power allocation optimization method of Fengguang storage Station participating in multi-time scale power spot market based on portfolio theory. Engineering Science and Technology, 55(1), 101-109.
[8]. Rubinstein, M. (2002) Markowitz's" portfolio selection": A fifty-year retrospective. The Journal of finance, 57(3), 1041-1045.
[9]. Pástor, Ľ. (2000) Portfolio selection and asset pricing models. The Journal of Finance, 55(1), 179-223.
[10]. Agarwal, V., and Naik, N. Y. (2004) Risks and portfolio decisions involving hedge funds. The Review of Financial Studies, 17(1), 63-98.