


1. Introduction
The accurate forecasting of the unemployment rate is of utmost importance for policymakers, businesses, and individuals seeking to navigate the complexities of the labor market [1]. Fluctuations in the unemployment rate hold substantial implications for various stakeholders, necessitating precise forecasts to inform decision-making and strategic planning. In recent years, the United States has experienced significant economic events, notably the global financial crisis of 2007-2008 and the subsequent COVID-19 pandemic, which have had profound effects on labor markets [2]. These crises resulted in unprecedented disruptions, including business closures, extensive job losses, and a sharp increase in unemployment rates. Policymakers faced the considerable challenge of formulating effective measures to mitigate economic downturns and foster recovery.
During times of crisis, policymakers rely heavily on accurate unemployment rate forecasts to gauge the severity of economic downturns, allocate resources for relief measures, and design targeted interventions to promote economic growth and reduce unemployment. Likewise, businesses depend on precise forecasts to inform critical decisions related to human resource planning, talent acquisition, and operational strategies. Understanding anticipated shifts in labor supply and demand enables companies to align their workforce strategies, optimize resource allocation, and enhance their competitive positioning [3]. Furthermore, individuals stand to gain significant benefits from unemployment rate forecasts as they make career decisions, evaluate job security, and plan for potential employment fluctuations. The ability to anticipate labor market conditions empowers job seekers to make informed choices concerning job search strategies, geographic mobility, and skill development efforts [4]. Access to accurate forecasts equips individuals to navigate labor market complexities, increasing the likelihood of securing stable employment and achieving long-term career success.
This research paper focuses on forecasting the unemployment rate in the United States, utilizing the widely recognized Autoregressive Integrated Moving Average (ARIMA) model. Insights are drawn from extensive historical data spanning from January 1, 2000, to May 1, 2023. By incorporating the historical context of significant events, such as the global financial crisis and the COVID-19 pandemic, this paper aims to provide policymakers, businesses, and individuals with reliable forecasts that inform decision-making, strategic planning, and labor market navigation.
2. Methodology
2.1. Data Collection
The research uses the American unemployment rate as the target in this paper to forecast. The unemployment rate is a significant economic statistic that indicates the percentage of people in the labor force who are jobless and actively looking for work. The unemployment rate is an essential indicator of a country's economic strength and residents' well-being since it gives insight into the health of an economy, the availability of job opportunities, and the general situation of the labor market [5]. High unemployment rates result in economic contraction, income inequality, reduced consumer confidence, increased social costs, and higher government expenditures. Conversely, low unemployment rates are associated with a stronger economy, increased consumer confidence, higher wages, reduced income inequality, and decreased government expenditures.
2.2. Data Selection
The data selection for this research encompasses the United States' unemployment rate data for the period 2000 to 2023, sourced from the Federal Reserve Economic Data (FRED) [6]. This period is chosen due to its encapsulation of diverse economic phases including a time of relative stability in 2000 post the late 1990s recession, the 2007-2008 financial crisis marked by a significant surge in unemployment rates, and the ensuing recovery period. Moreover, it covers the impact of COVID-19 pandemic. The selected timeframe thus spans a wide spectrum of unemployment rate variations, allowing for a robust and nuanced exploration of the temporal patterns and influencing factors of U.S. unemployment trends.
2.3. Methodological and Statistical Approach
This research undertakes a comprehensive methodological and statistical approach to analyze and forecast the U.S. unemployment rate, incorporating both foundational and advanced statistical models.
2.3.1. Preliminary Data Assessment
The research initiates with an examination of the time series data's white noise and stationarity characteristics. Utilizing the Augmented Dickey-Fuller (ADF) test, potential non-stationarity in the time series data, indicated by the presence of unit roots, is evaluated. In addition, the Ljung-Box test is employed to determine the presence of white noise characteristics within the time series. These crucial preliminary tests aid in shaping the subsequent analytical approach by identifying the inherent properties of the dataset.
2.3.2. Data Transformation
Given the initial non-stationary nature of the dataset, the research applies a series of transformations, specifically differencing and logarithmic transformations, to convert the data into a stationary sequence. Achieving stationarity is a critical prerequisite for successful application of time series modeling techniques.
2.3.3. Moving Average (MA) Model and Autoregressive (AR) Model
The Moving Average (MA) and Autoregressive (AR) models serve as the building blocks of this analysis. The MA model provides a smoothing technique that highlights longer-term trends or cycles in the time series by averaging out short-term fluctuations. The AR model incorporates past data points within the same time series as predictors, enabling the model to capture forms of temporal dependency.
2.3.4. Autoregressive Integrated Moving Average (ARIMA) Model
The ARIMA model, which integrates the principles of the AR and MA models and includes a differencing step, is applied to handle the time series data. This model effectively accommodates data with a trend, making it particularly useful when autocorrelation and trend are simultaneously present in the series.
2.3.5. Box-Jenkins Methodology
Underpinning the entire analytical process is the Box-Jenkins methodology. This method provides a structured framework for identifying, fitting, checking, and using integrated ARIMA models. The procedure encompasses model identification using the Autocorrelation Function (ACF) and Partial Autocorrelation Function (PACF), model fitting, and model validation through diagnostic tests.
2.3.6. Seasonality Examination and Forecasting
The research further incorporates an examination of seasonality patterns inherent in the unemployment rate data, enhancing the forecasting's robustness. Upon validating the chosen model, the forecast is generated and subsequently assessed using a Box test on the prediction residuals. This step ensures the forecasts' accuracy and the model's effectiveness in minimizing systematic patterns or biases. The amalgamation of these various statistical models and methodological approaches enables a rigorous and robust analysis of the U.S. unemployment rate, contributing significantly to the reliability and relevance of the research outcomes.
3. Results
Upon the initial assessment of the time series, the Augmented Dickey-Fuller (ADF) test, as presented in Table 1, indicated that the analyzed data was non-stationary due to a p-value of 0.4611, significantly above the established significance level of 0.05. This result necessitated a transformation of the dataset to a stationary form before proceeding with further analysis.
Table 1: ADF test of the initial data.
Alternative hypothesis | Stationary |
Lag order | 6 |
p-value | 0.4611 |
The first transformation process involved differencing the data, leading to an ADF test that yielded a p-value of 0.01, as shown in Table 2. This result suggested stationarity within the differenced dataset.
Table 2: ADF test of the differencing data.
Alternative hypothesis | Stationary |
Lag order | 6 |
p-value | 0.01 |
However, a subsequent Ljung-Box test, as shown in Table 3, produced a p-value of 0.5118, signifying the presence of white noise in the series, and hence, indicating that additional transformation was required.
Table 3: Box test of the differencing data.
Box Test | |
X- squared | 0.43031 |
p-value | 0.5118 |
As a response, a logarithmic transformation was implemented on the original dataset, followed by another differencing process, as shown in Table 4. The transformed dataset then underwent an ADF test, which resulted in a p-value of 0.01. This result suggests that the dataset is now stationary.
Table 4: ADF test of the logged and differencing data.
Alternative hypothesis | Stationary |
Lag order | 6 |
p-value | 0.01 |
Subsequently, a Box test was conducted, yielding a p-value of 0.085, as shown in Table 5. This result indicates the existence of a non-white noise process, suggesting that the logarithmic transformation and differencing effectively removed white noise characteristics and rendered the series stationary.
Table 5: Box test of the logged and differencing data.
Box Test | |
X- squared | 2.9601 |
p-value | 0.08534 |
Following the successful transformations and establishment of stationarity, the data series was then modeled using the Auto ARIMA algorithm. (Table 6) This process identified the ARIMA (0,0,2) (0,0,2) [12] model as the most appropriate fit for the dataset, thereby capturing the inherent temporal dependencies and seasonal patterns. The first "0" denotes the order of the 'Autoregressive' (AR) part (p). It indicates how many past values from the time series are used. In this case, no past values are being used. The second "0" is for the 'Integrated' (I) part (d), representing the order of differencing required to make the time series stationary. In this context, the series didn't require any differencing. The "2" is for the 'Moving Average' (MA) part (q). It indicates the number of lagged forecast errors that are included in the model. In this context, it means that two lagged forecast errors are used. The seasonal component (P, D, Q) [s] of the model, represented as (0,0,2) [12], shows that the data has a seasonal component repeating every 12 periods (likely indicating monthly data with yearly seasonality). The (0,0,2) parameters suggest that no autoregressive or differencing terms are used for the seasonal component, but two past seasonal forecast errors are incorporated in the model [7].
Table 6: ARIMA model.
ARIMA (0,0,2) (0,0,2) [12] | ||||
Coefficients | ma1 | ma2 | sma1 | sma2 |
0.1014 | -0.1711 | 0.1848 | 0.1144 | |
s.e. | 0.0608 | 0.0697 | 0.0598 | 0.0544 |
AIC | -516.57 | |||
AICc | -516.35 | |||
BIC | -498.4 | |||
Seasonality patterns within the model were then explored. During the month of January, the unemployment rate tends to be higher. One reason for this could be the conclusion of the holiday season, including Christmas and New Year's, during which time businesses often slow down operations and reduce hiring. Additionally, colder weather during this period might discourage job-seeking activities, further contributing to the elevated unemployment rates (in Figure 1 and Figure 2).
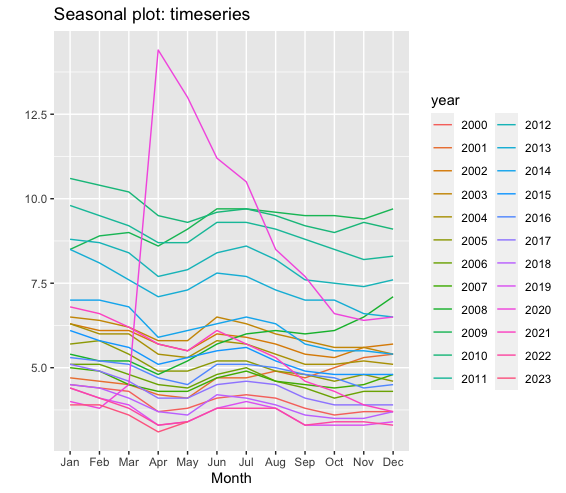
Figure 1: Seasonal pattern.
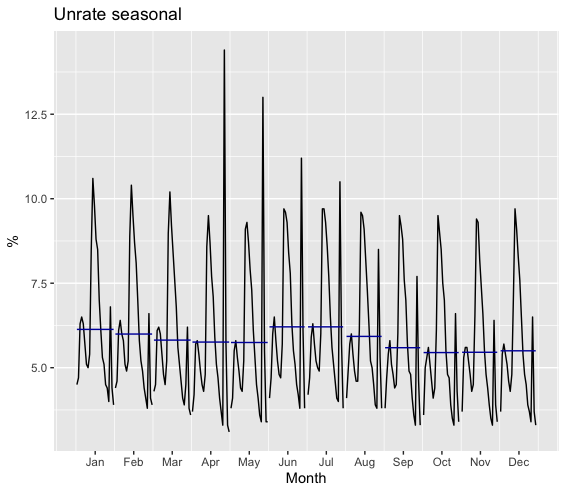
Figure 2: Seasonality.
From February to April, an increase in job-seeking activities is observed, aligning with the observed decrease in the unemployment rate during this timeframe. This could be attributed to businesses resuming normal operations after the holiday season, leading to increased job openings. Furthermore, improving weather conditions during this period might encourage individuals to actively seek employment.
However, the months of June and July exhibit relatively higher unemployment rates. This could be due to various factors, such as seasonal industries, like tourism, undergoing temporary downturns. Additionally, some job seekers might temporarily stop seeking employment due to holiday breaks or warmer weather conditions.
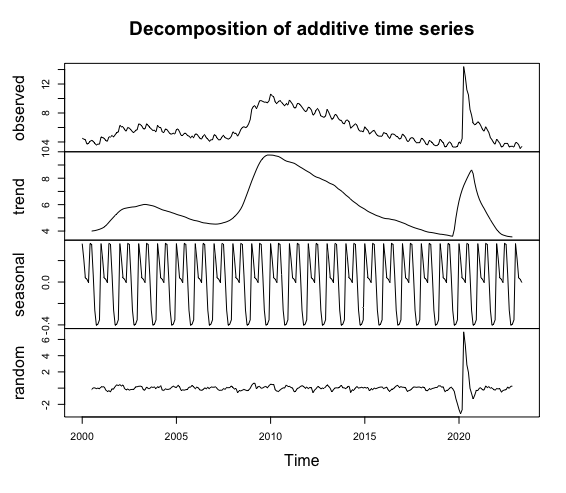
Figure 3: Decomposition.
The significant decrease in the unemployment rate observed in September 2019, reaching 3.5% (the lowest rate since December 1969), might be due to a combination of factors such as favorable economic conditions, increased job opportunities in certain sectors, and potential policy changes [8]. However, without specific data related to these factors, it is difficult to conclusively attribute this decrease to any single factor (Figure 3).
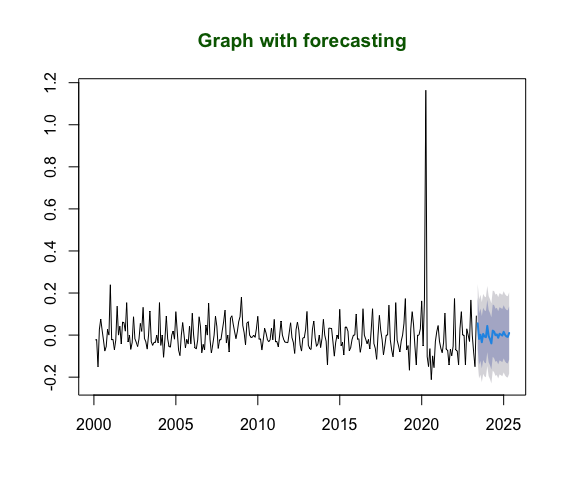
Figure 4: Graph with forecasting.
A forecast generated based on these insights was subjected to a Box test, the result of which is depicted in Figure 4. Furthermore, these forecasts were subjected to a Ljung-Box test to evaluate the residuals for white noise characteristics, which means the model is well-done (Table 7).
Table 7: Box test of the forecasting residuals.
Box Test | |
X- squared | 0.019014 |
p-value | 0.8903 |
Considering the extreme variables of COVID-19 pandemic, the research built a new model by using the same method (Table 8). Following the strategic removal of data collected during and after the pandemic outbreak, predictions were generated using the refined dataset. Notably, these new predictions were remarkably consistent with the forecasts derived solely from the pre-2020 data, despite the significant disruptions caused by the 2020 events (Figure 5).
Table 8: New ARIMA model.
ARIMA (5,0,1) (1,1,2) [12] | |||||||||
Coefficients | ar1 | ar2 | ar3 | ar4 | ar5 | ma1 | sar1 | sma1 | sma2 |
0.3508 | 0.2048 | -0.1356 | -0.0014 | 0.3785 | -0.4140 | -0.8278 | -0.0121 | -0.6126 | |
s.e. | 0.1254 | 0.0661 | 0.0703 | 0.0684 | 0.0723 | 0.1291 | 0.2080 | 0.2296 | 0.2051 |
AIC | -924.97 | ||||||||
AICc | -923.95 | ||||||||
BIC | -890.72 | ||||||||
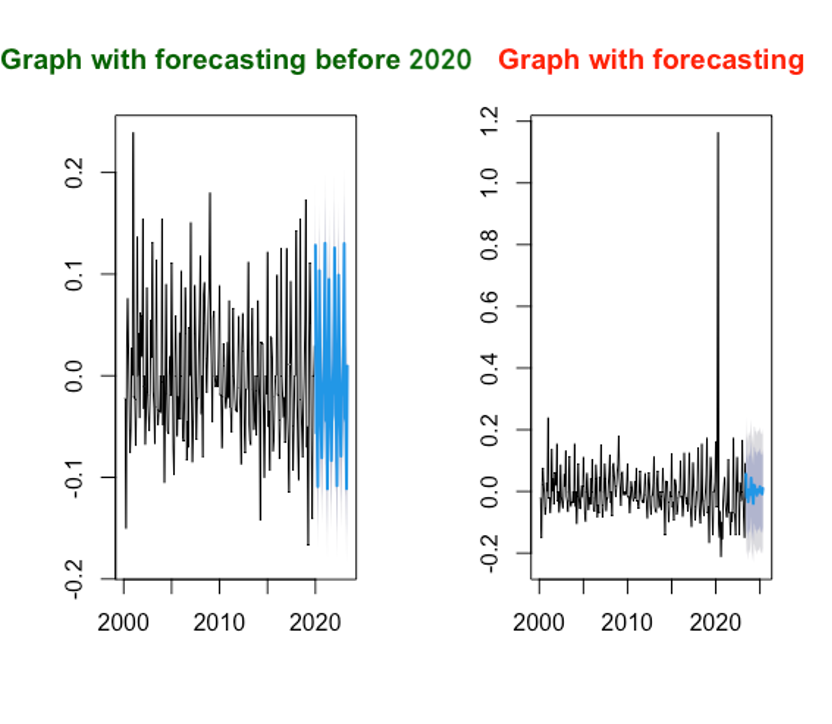
Figure 5: Comparing of the forecasts.
This consistency suggests that the original model effectively captures underlying patterns and dynamics of the time series, even in the face of unprecedented disturbances. The fact that the original model's predictions did not greatly deviate during the 2020 disruption underscores its capacity to adapt to change and adjust forecasts accordingly.
Such resilience bolsters confidence in the reliability and accuracy of the model's predictions, enhancing their usefulness for informed decision-making. The exclusion of post-outbreak data and the achievement of comparable predictions helps to offset potential biases and anomalies brought about by the pandemic's extraordinary circumstances. This approach allows for more reliable and consistent forecasts, as indicated by the model's proven performance.
4. Discussion
The findings from the ARIMA model used to forecast unemployment rates demonstrate the considerable potential of time series analysis in labor market predictions. This research highlights the importance of initial assessments, data transformation, modeling, and validation procedures to achieve accurate forecasts.
An interesting observation from the research was the effect of seasonal fluctuations on unemployment rates, with increases observed in January and during the summer months. This finding indicates that any forecasts of unemployment rates need to account for such regular annual patterns. Despite the widespread disruptions caused by the COVID-19 pandemic, the model was remarkably consistent with the forecasts derived solely from pre-2020 data, pointing to its robustness and resilience. This underscores the potential of ARIMA models to adapt to change and adjust forecasts accordingly, which is crucial in an increasingly dynamic and uncertain global economy [9].
The model's ability to provide accurate forecasts despite the unprecedented disruptions caused by the pandemic could be attributed to the way the ARIMA model incorporates past values and errors to predict future trends. By doing so, the model can adjust to new data and provide accurate forecasts, even in the face of sudden changes in trends.
However, it is important to remember that while the ARIMA model can effectively capture past trends and dynamics in the data, it does not explicitly consider other potential macroeconomic influences. Future research could consider expanding the scope of the ARIMA model to incorporate external variables such as GDP, inflation rates, or labor market policies, which may provide even more accurate and robust forecasts of unemployment rates [10].
5. Conclusion
The endeavor to predict the unemployment rate accurately is a significant and complex task, driven by the compelling need to navigate the labyrinthine nature of labor markets, particularly in the face of major economic events. This research arose from the motivation to provide robust forecasts of unemployment rates to enable more informed decision-making for a wide spectrum of stakeholders, including policymakers, businesses, and individuals. Given the substantial impacts of fluctuations in unemployment rates, precise predictions are essential for strategic planning, policy formulation, human resource management, and career decision-making.
The research methodology adopted for this research involved the use of the Autoregressive Integrated Moving Average (ARIMA) model, a widely recognized statistical tool for time series analysis. Utilizing this approach, along with the extensive dataset from the Federal Reserve Economic Data (FRED) spanning 2000 to 2023, this paper generated insightful forecasts by capturing the inherent temporal dependencies and seasonal patterns in the unemployment rates. Furthermore, the research findings underscore the resilience of the ARIMA model, as evidenced by its ability to generate accurate forecasts despite significant disruptions such as the global financial crisis and the COVID-19 pandemic. This capacity to adapt to rapidly changing economic conditions reinforces the ARIMA model's suitability for employment forecasting. This research bears significant importance for various stakeholders. Policymakers can leverage these insights to formulate more effective measures to tackle economic downturns and foster recovery. Businesses can utilize these predictions to inform human resource planning, talent acquisition, and operational strategies. Individuals, on the other hand, can make more informed career decisions and plan for potential employment fluctuations.
However, the research is not without limitations. Although the ARIMA model can effectively capture the past trends and dynamics in the data, it does not explicitly consider other potential macroeconomic influences. Future research, therefore, could expand the scope of the ARIMA model to incorporate external variables such as GDP, inflation rates, or labor market policies. By integrating these factors, the forecasting model could provide even more accurate and robust predictions of unemployment rates, further enhancing its utility and relevance in labor market analysis.
References
[1]. Davidescu, A. A., Apostu, S.-A., & Paul, A. (2021). Comparative analysis of different univariate forecasting methods in modelling and predicting the Romanian unemployment rate for the period 2021–2022. Entropy, 23(3), 325.
[2]. Job retention schemes during the COVID-19 lockdown and beyond. (2020). OECD Policy Responses to Coronavirus (COVID-19).
[3]. Siami‐Namini, S., Lyford, C., & Trindade, A. A. (2020). The effects of monetary policy shocks on income inequality across U.S. states. Economic Papers: A Journal of Applied Economics and Policy, 39(3), 204–221.
[4]. The importance of workforce and Labor Market Information. URL: https://www.dol.gov/sites/dolgov/files/ETA/wioa/pdfs/Informational_Handout.pdf, last accessed 2023/07/25.
[5]. Pratap, P., Dickson, A., Love, M., Zanoni, J., Donato, C., Flynn, M. A., & Schulte, P. A. (2021). Public health impacts of underemployment and unemployment in the United States: Exploring Perceptions, gaps and opportunities. International Journal of Environmental Research and Public Health, 18(19), 10021.
[6]. Federal Reserve Bank of St. Louis. (n.d.). Welcome to Fred, your trusted source for economic data since 1991. FRED. URL: https://fred.stlouisfed.org/, last accessed 2023/07/25.
[7]. Lawal, O. A., & Teh, J. (2023). Assessment of Dynamic Line Rating Forecasting methods. Electric Power Systems Research, 214, 108807.
[8]. U.S. Bureau of Labor Statistics. https://www.bls.gov/opub/mlr/2020/article/job-market-remains-tight-in-2019-as-the-unemployment-rate-falls-to-its-lowest-level-since-1969.htm, last accessed 2023/07/25.
[9]. Ahmad, M., Khan, Y. A., Jiang, C., Kazmi, S. J., & Abbas, S. Z. (2021). The impact of <scp>covid</scp> ‐19 on unemployment rate: An intelligent based unemployment rate prediction in selected countries of Europe. International Journal of Finance & Economics, 28(1), 528–543.
[10]. Nguyen, P.-H., Tsai, J.-F., Kayral, I. E., & Lin, M.-H. (2021). Unemployment rates forecasting with grey-based models in the post-covid-19 period: A case study from Vietnam. Sustainability, 13(14), 7879.
Cite this article
Zhang,D. (2023). Forecasting USA Unemployment Rate Base on ARIMA Model. Advances in Economics, Management and Political Sciences,49,67-76.
Data availability
The datasets used and/or analyzed during the current study will be available from the authors upon reasonable request.
Disclaimer/Publisher's Note
The statements, opinions and data contained in all publications are solely those of the individual author(s) and contributor(s) and not of EWA Publishing and/or the editor(s). EWA Publishing and/or the editor(s) disclaim responsibility for any injury to people or property resulting from any ideas, methods, instructions or products referred to in the content.
About volume
Volume title: Proceedings of the 2nd International Conference on Financial Technology and Business Analysis
© 2024 by the author(s). Licensee EWA Publishing, Oxford, UK. This article is an open access article distributed under the terms and
conditions of the Creative Commons Attribution (CC BY) license. Authors who
publish this series agree to the following terms:
1. Authors retain copyright and grant the series right of first publication with the work simultaneously licensed under a Creative Commons
Attribution License that allows others to share the work with an acknowledgment of the work's authorship and initial publication in this
series.
2. Authors are able to enter into separate, additional contractual arrangements for the non-exclusive distribution of the series's published
version of the work (e.g., post it to an institutional repository or publish it in a book), with an acknowledgment of its initial
publication in this series.
3. Authors are permitted and encouraged to post their work online (e.g., in institutional repositories or on their website) prior to and
during the submission process, as it can lead to productive exchanges, as well as earlier and greater citation of published work (See
Open access policy for details).
References
[1]. Davidescu, A. A., Apostu, S.-A., & Paul, A. (2021). Comparative analysis of different univariate forecasting methods in modelling and predicting the Romanian unemployment rate for the period 2021–2022. Entropy, 23(3), 325.
[2]. Job retention schemes during the COVID-19 lockdown and beyond. (2020). OECD Policy Responses to Coronavirus (COVID-19).
[3]. Siami‐Namini, S., Lyford, C., & Trindade, A. A. (2020). The effects of monetary policy shocks on income inequality across U.S. states. Economic Papers: A Journal of Applied Economics and Policy, 39(3), 204–221.
[4]. The importance of workforce and Labor Market Information. URL: https://www.dol.gov/sites/dolgov/files/ETA/wioa/pdfs/Informational_Handout.pdf, last accessed 2023/07/25.
[5]. Pratap, P., Dickson, A., Love, M., Zanoni, J., Donato, C., Flynn, M. A., & Schulte, P. A. (2021). Public health impacts of underemployment and unemployment in the United States: Exploring Perceptions, gaps and opportunities. International Journal of Environmental Research and Public Health, 18(19), 10021.
[6]. Federal Reserve Bank of St. Louis. (n.d.). Welcome to Fred, your trusted source for economic data since 1991. FRED. URL: https://fred.stlouisfed.org/, last accessed 2023/07/25.
[7]. Lawal, O. A., & Teh, J. (2023). Assessment of Dynamic Line Rating Forecasting methods. Electric Power Systems Research, 214, 108807.
[8]. U.S. Bureau of Labor Statistics. https://www.bls.gov/opub/mlr/2020/article/job-market-remains-tight-in-2019-as-the-unemployment-rate-falls-to-its-lowest-level-since-1969.htm, last accessed 2023/07/25.
[9]. Ahmad, M., Khan, Y. A., Jiang, C., Kazmi, S. J., & Abbas, S. Z. (2021). The impact of <scp>covid</scp> ‐19 on unemployment rate: An intelligent based unemployment rate prediction in selected countries of Europe. International Journal of Finance & Economics, 28(1), 528–543.
[10]. Nguyen, P.-H., Tsai, J.-F., Kayral, I. E., & Lin, M.-H. (2021). Unemployment rates forecasting with grey-based models in the post-covid-19 period: A case study from Vietnam. Sustainability, 13(14), 7879.