


1. Introduction
The stock markets in China and the US have long attracted the attention of researchers and investors because of their significant impact on the global economy. The purpose of this study is to analyze the indexes of the Chinese and American stock markets, with the Shanghai Composite Index, NASDAQ, S&P 500 and Dow Jones Index as the main indicators. Stock market index and related stock data from the flush Trading Platform.
In the past, the analysis of the stock exchange market mainly focused on the relationship between the stock indexes of China and the US and their related economic and financial data. He S Y. 's research proves that the return rate of Shanghai Composite Index and Shenzhen Composite Index meet the stability, which indicates that there is a certain causal relationship between major stock market indexes [1]. In addition, several studies have looked at the relationship between stock index movements and economic development. In their research, Mo Y. & Cheng R. chose Shanghai Composite Index and S&P 500 index as indicators, conducted impulse response analysis through Granger causality test and VECM model, and proved the linkage of Chinese and American stock markets [2]. This shows that the interconnectedness of financial markets is becoming more and more prominent in the context of globalization. These indexes not only reflect the overall performance of financial markets, but also influence investor sentiment and market volatility.
In conclusion, the previous research revealed the complexity of the stock exchange market and the interrelationship with economic and financial data. These studies provide important references and guidance for investors, financial analysts and policymakers, enabling them to better understand the volatility, cyclicality and associated risks of the stock market, and formulate appropriate investment and policy strategies. However, there is still a need for in-depth research and exploration, especially in the use of more advanced models and methods to predict the trend of stock indices, in order to improve the accuracy and reliability of forecasts.
Economic and financial data are important factors affecting the trend of these indexes, such as the national deposit interest rate, annualized growth rate of CPI, inflation rate, GDP and exchange rate. Reference to the economic and financial factors that influence the movement of stock market indexes can help to better understand the dynamics of these markets and provide valuable insights to potential investors.
Based on the above literature review and introduction, this study will adopt the following research framework: First, Data collection and preparation: First, obtain the historical closing price data of the Chinese and American stock market index from the Flush Trading Platform, as well as related economic and financial data such as national deposit interest rate, annualized growth rate of CPI, inflation rate, GDP and exchange rate. Second, Time series analysis: ARIMA model was adopted to analyze and model the historical closing prices of Chinese and American stock market indexes. By fitting residual value graph, ACF graph, residual value normal distribution graph and PACF graph, the fitting degree and forecasting ability of ARIMA model to stock index data were evaluated. Choose the appropriate ARIMA model to predict the future movement of the stock market index. Third, Causal analysis: Explore the causal relationship between Shanghai Stock Index, Shenzhen Composite Index and NASDAQ, S&P 500, Dow Jones Index, as well as the causal relationship between the US stock market and Shanghai stock market. Fourth, Impact analysis of economic and financial data: Analyze the national deposit interest rate, annualized growth rate of CPI, inflation rate, GDP, exchange rate and other economic and financial data to study their impact on the trend of the stock market index. Through statistical analysis and correlation test, the author explores the correlation and influence degree between these factors and the stock market index. Fifth, Prediction and verification: The ARIMA model is used to predict the trend of the Chinese and American stock market indexes in the future. The accuracy and predictive power of the model are verified by comparing with actual data, and the effect of the model in short-term and long-term forecasting is evaluated. Through the above research framework, this study aims to deeply understand the correlation and influencing factors of Chinese and American stock exchange markets, and provide important information and decision support for investors, analysts and policy makers on the trend of stock market indexes.
2. Comprehensive Analysis
This study mainly focuses on the stock exchange markets of China and the US. Shanghai Composite Index is an important indicator of the A-share trading market, while NASDAQ, S&P 500 and Dow Jones Index are three important indicators of the US stock trading market. He S Y. used the stationarity test to prove that the return rate of Shanghai Composite Index, Shenzhen Composite Index and other market indexes meet the stationarity, which indicates that there is a certain causal relationship between major stock market indexes [1]. Nishimura, S. used the CFF test to prove that there is a causal relationship between the US stock market and the Shanghai stock market with a one-order lag [3].
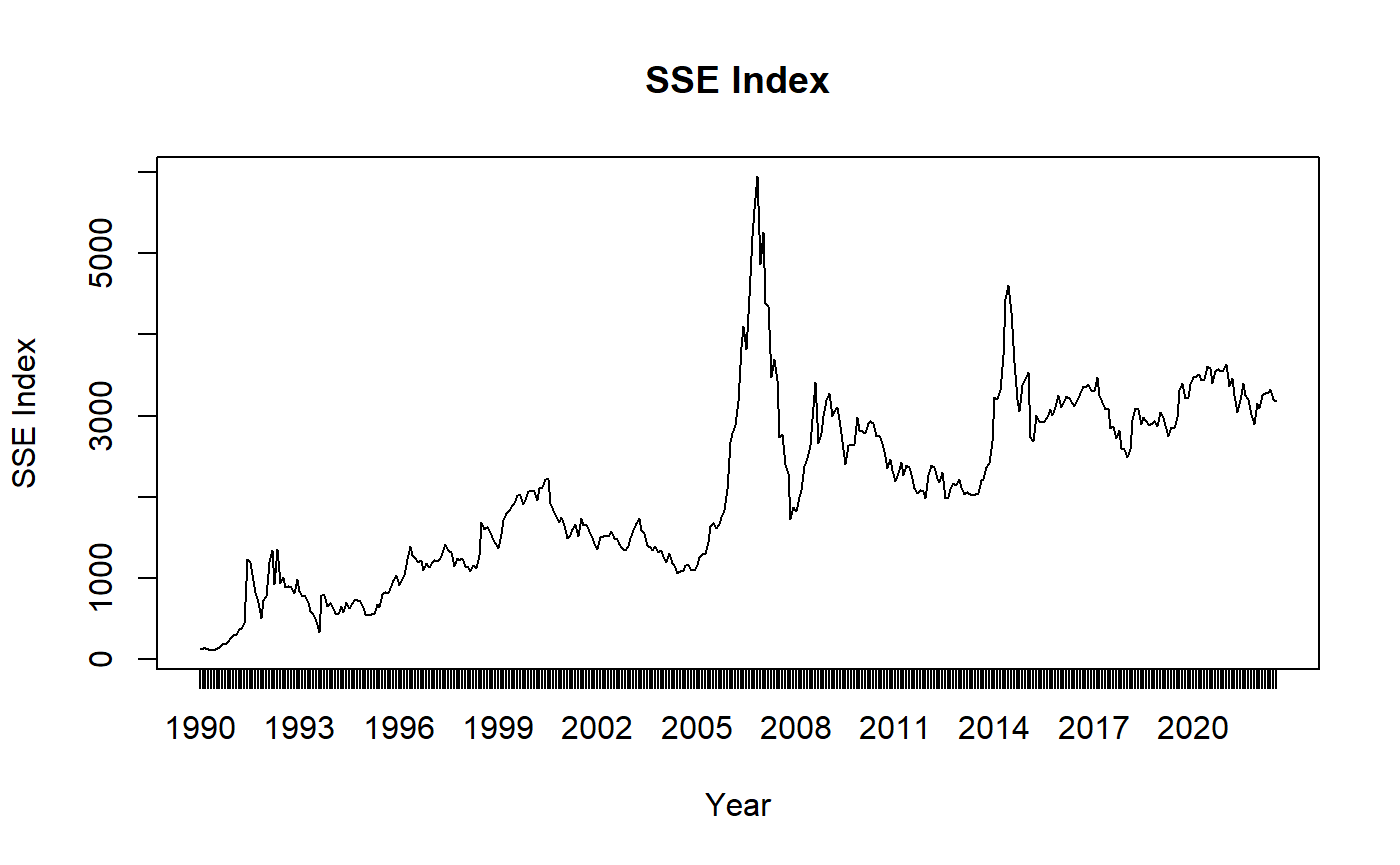
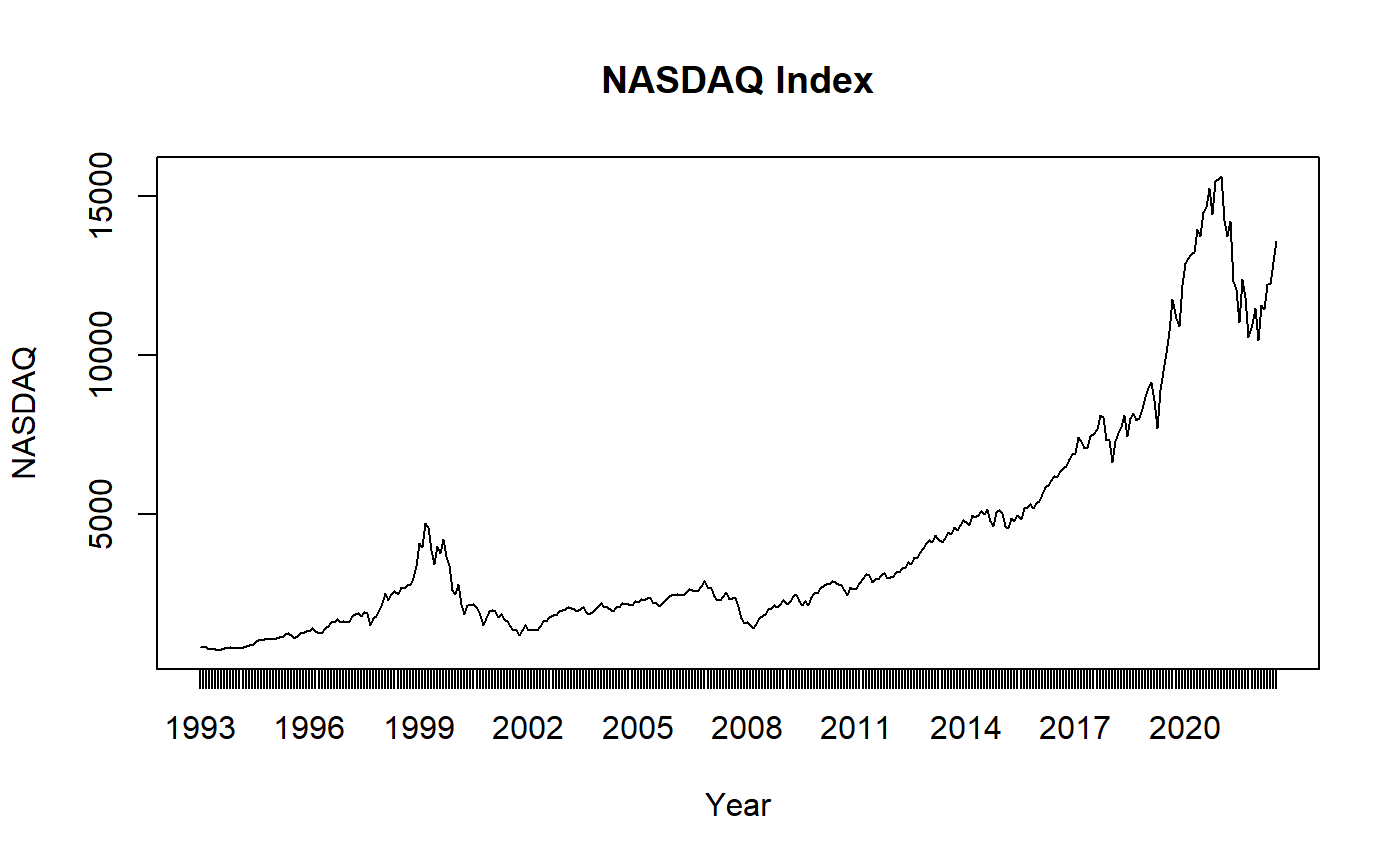
Figure 1: SSE Index chart. Figure 2: NASDAQ Index chart.
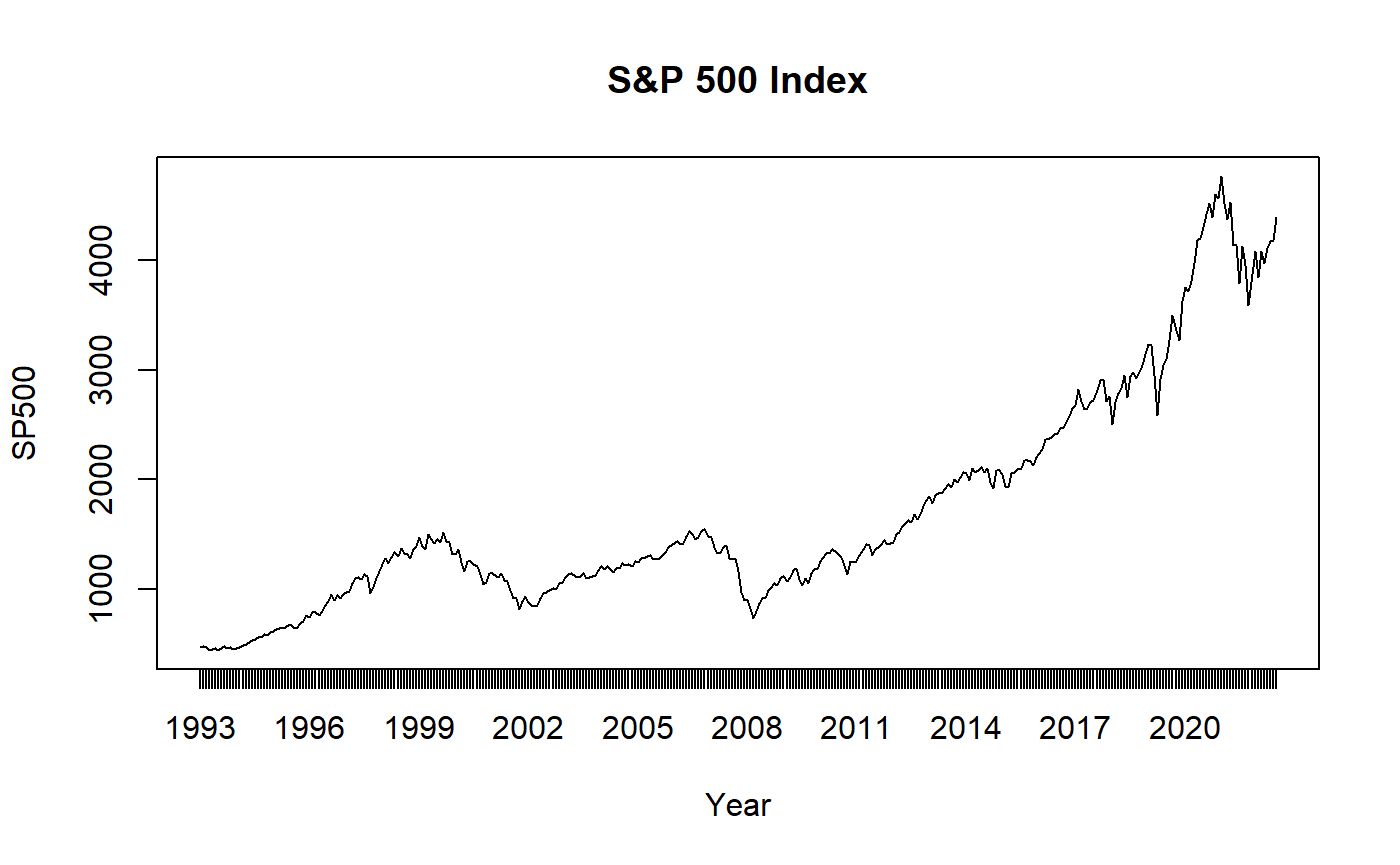
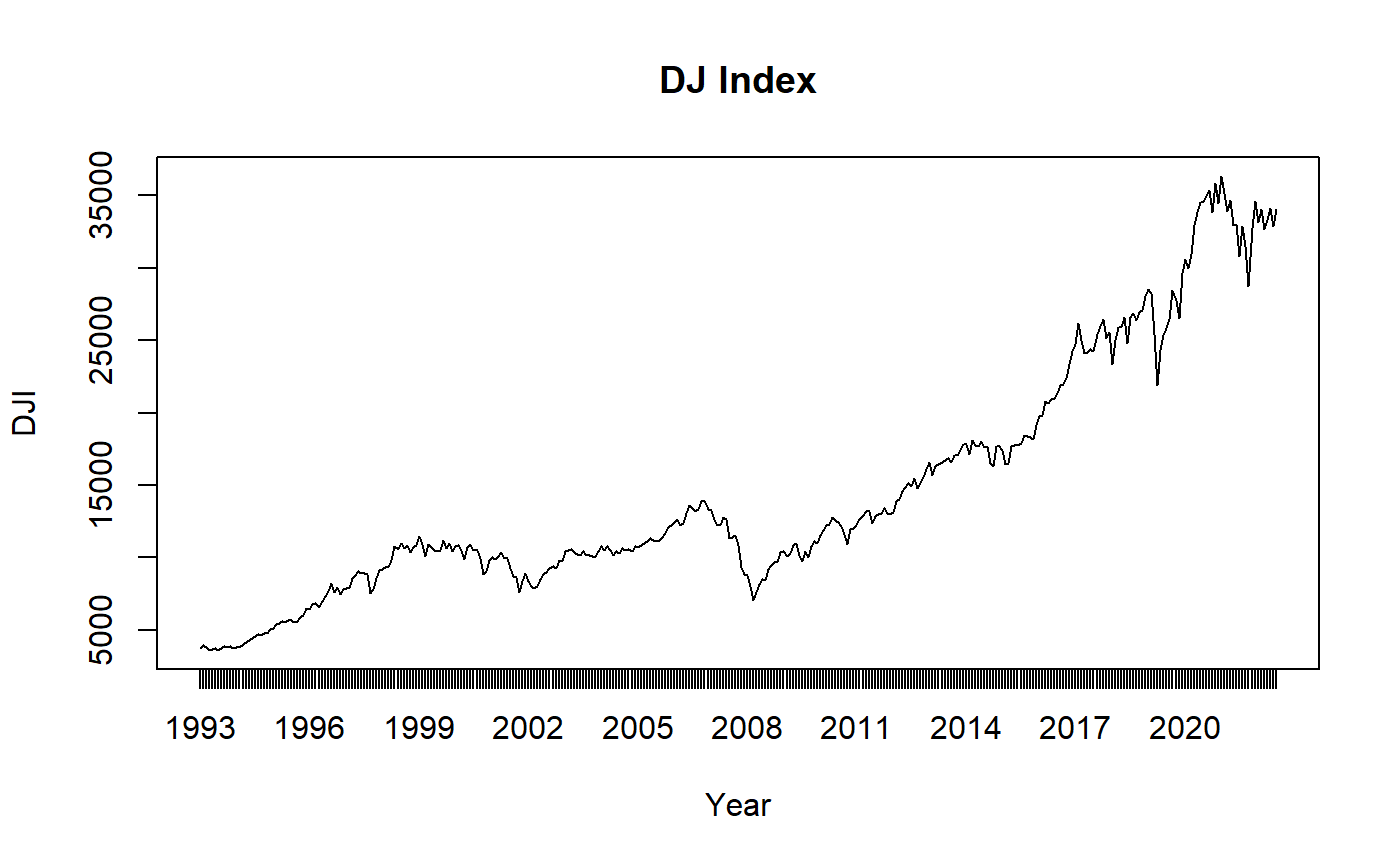
Figure 3: S&P500 Index chart. Figure 4: DJ Index chart.
As can be seen from the Figures 1-4, they show a historical upward trend, which indicates the rapid growth of the national economy, the improvement of the investment environment and the continuous optimization of policies. Mo Y. & Cheng R. selected Shanghai Composite Index and S&P 500 Index as indicators, and after Granger causality test, used VECM model to conduct impulse response analysis to prove the correlation of Chinese and US stock markets [2]. The three major indexes of the US stock market basically showed the same upward trend pattern, which more reflects the linkage of the financial market. These indexes are of great significance in the financial market. They represent the overall performance of the financial stock market and the sentiment of investors. They are used to measure the volatility and periodicity of the market, predict the development trend of the stock market, formulate investment strategies and evaluate portfolio performance. Stock investors, financial analysts, and policy makers all closely watch the movements of these indexes for key signals in the financial markets.
A major factor affecting the trend of related indexes is quantifiable economic and financial conditions.
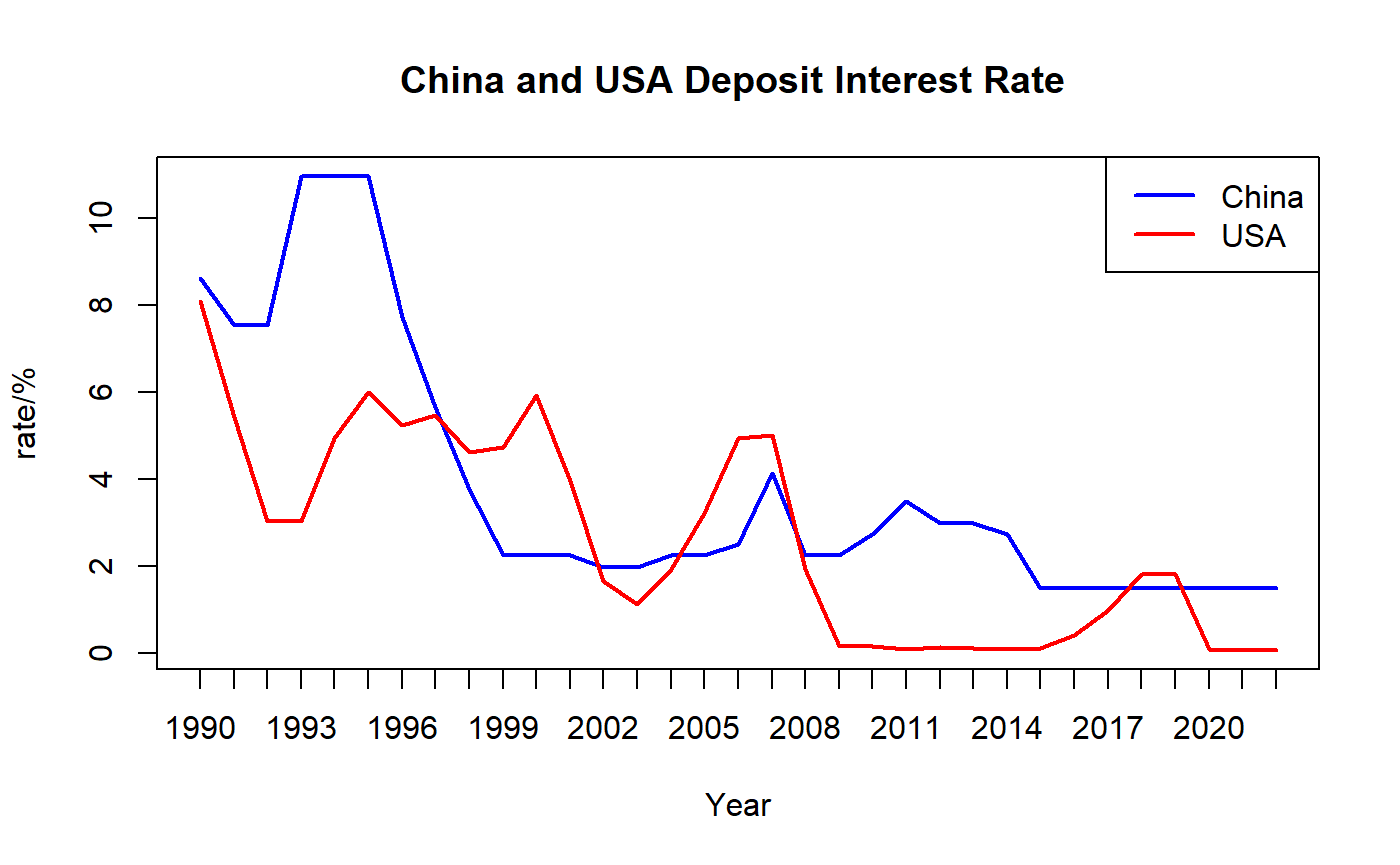
Figure 5: China and USA deposit interest rate.
Figure 5 shows China's national deposit rate and the US Federal funds rate from 1990 to 2022 respectively, both of which have generally declined and become stable from 1990 to 2022. The decline in China's national deposit rate indicates a decline in deposit interest returns, which reduces the enthusiasm of Chinese domestic investors, while the decline in the US federal funds rate indicates a decline in the borrowing costs of US banks, which increases the enthusiasm of US investment banks.
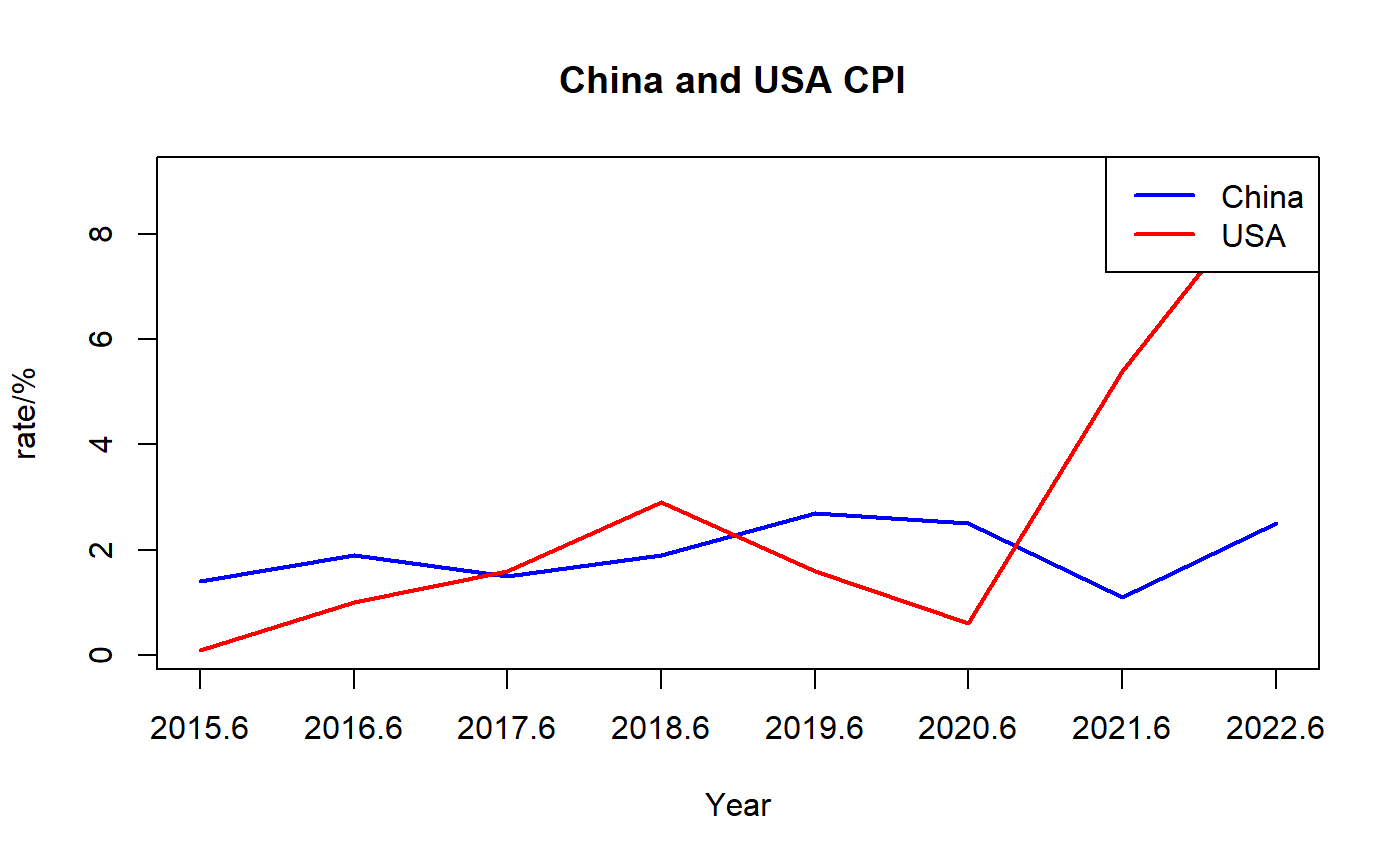
Figure 6: China and USA CPI.
Figure 6 shows the changes in the annualized CPI growth rates for China and the US from June 2015 to June 2022, respectively. China's annualized CPI growth rate basically showed a stable trend, indicating that China's monetary policy was appropriate during this period, and the government always paid attention to changes in the price level and inflation rate and made corresponding policy adjustments.
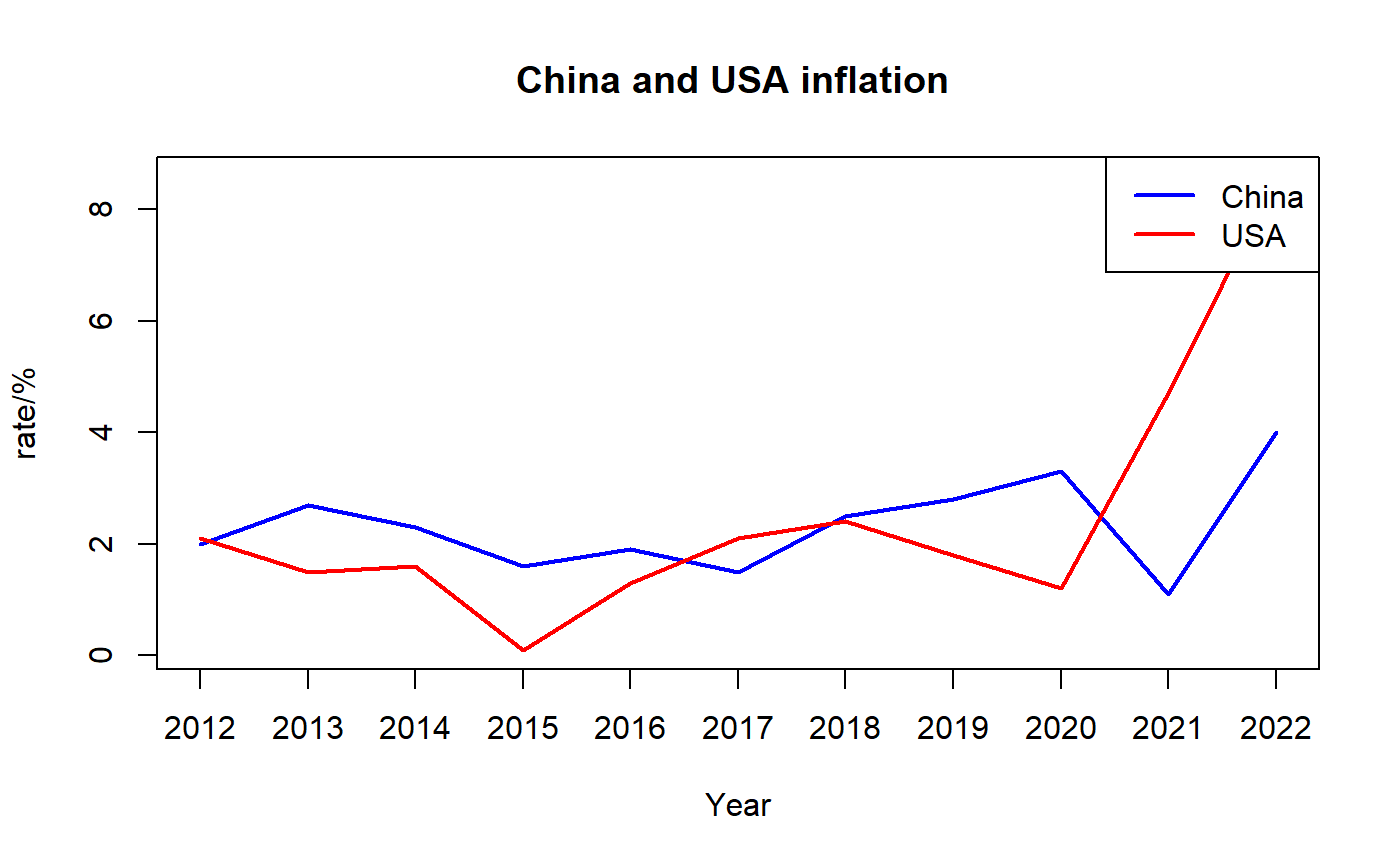
Figure 7: China and USA inflation.
The annualized growth rate of CPI in the US began to increase sharply after 2020, indicating that the price level in the US has increased significantly since the outbreak of COVID-19, coupled with the frequent interest rate hikes and relatively loose monetary policies of the Federal Reserve in the past two years, resulting in a sharp increase in the inflation rate in the US, as shown in Figure 7, which has impacted the purchasing power of consumers and inhibited the economic growth of the US. Liu J Q. & Ma Y N. proved through the relationship model and test between inflation rate and real stock return rate that persistent inflation rate shock would cause a negative correlation between real stock return rate and inflation rate [4].
|
|
Figure 8: China GDP. | Figure 9: USA GDP. |
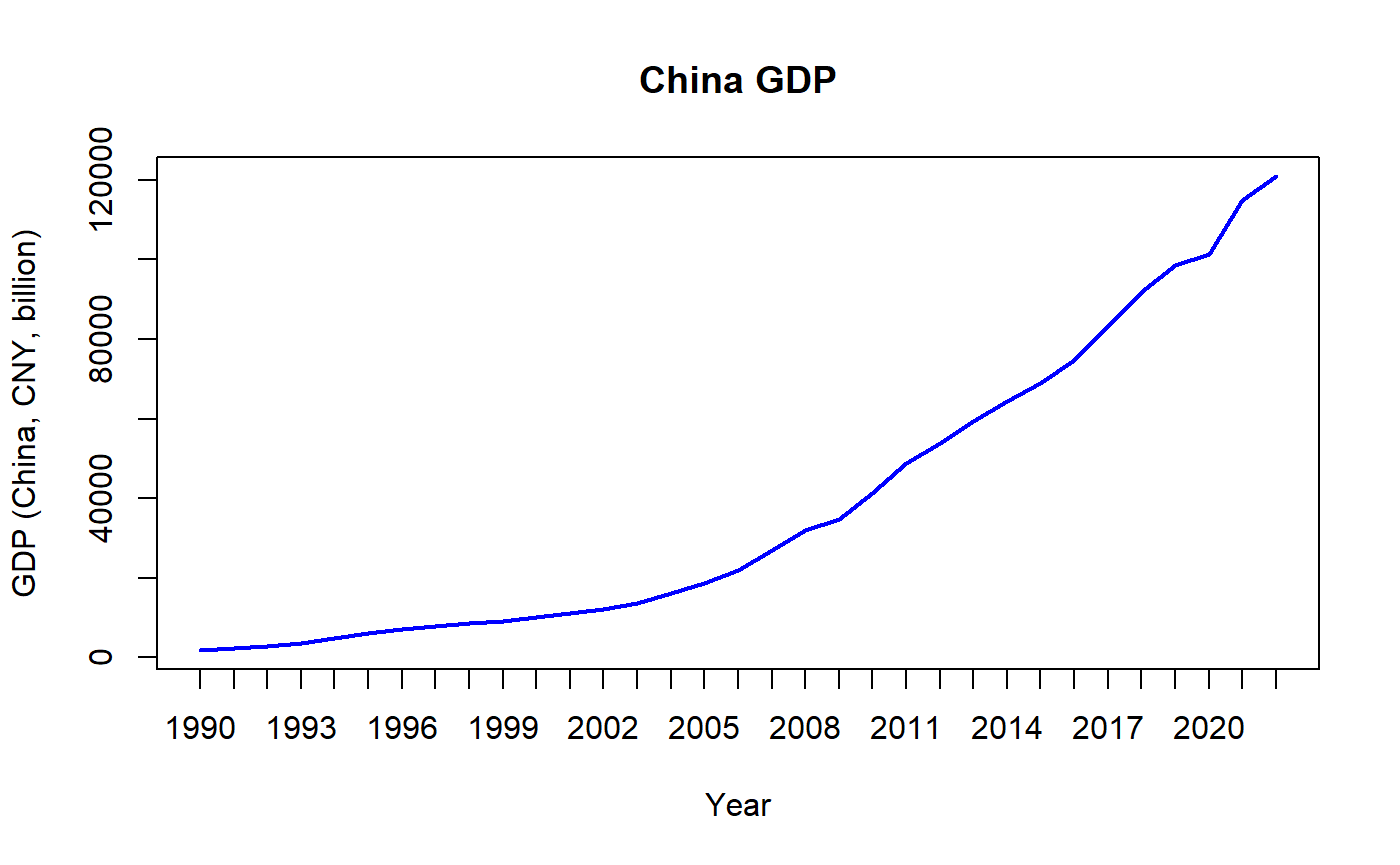
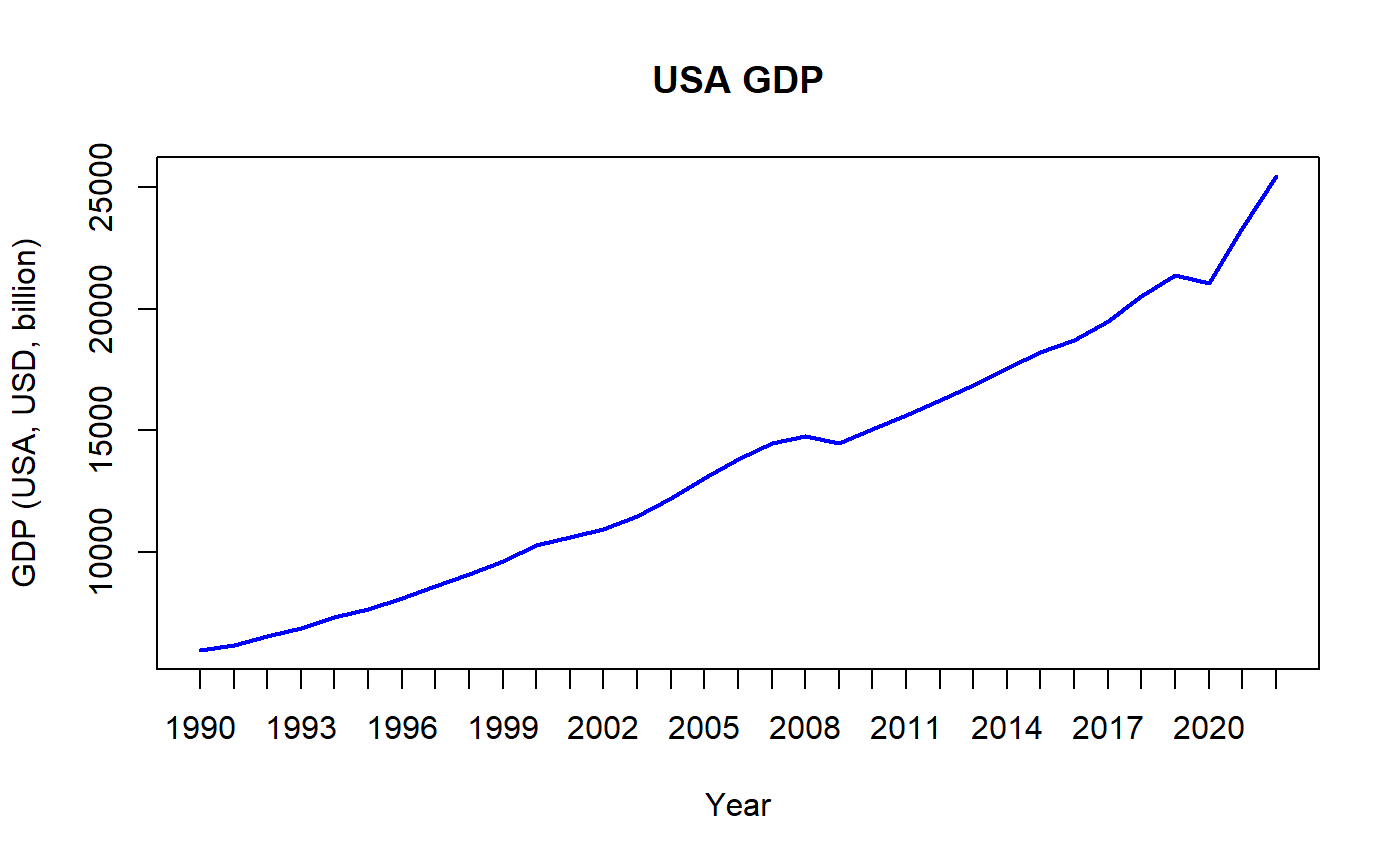
In addition, as shown in Figures 8-9, the GDP of China and the US both suffered an impact at the beginning of the outbreak of COVID-19 in 2020. And the US performed more seriously, there was a decline, resulting in the Shanghai Composite Index and the three major indexes of the US in the period after 2020 suffered a violent decline, the stock market crash, and the economy suffered a serious setback.
Figure 8-9 also show that the GDP of China and the US also suffered heavy losses in 2008, which coincided with the subprime mortgage crisis in the US, the bursting of the bubble of the US real estate market and the collapse of the subprime mortgage market. As shown in Figures 2-4, the three major indices of the US plummeted during this period and the collapse of the US stock market. Zhao L S. & Liu L J. believe that the root cause of the subprime mortgage crisis in the US is that the monetary policy to stimulate economic growth led to the excessive rise of the return on monetary assets and the price of assets (especially the real estate price), which brought about the continuous widening of the "yield margin" between the investment return rate [5].
As the world's largest economy, the US has a strong decisive role in the global economic situation, and its monetary policies have more significant spillover effects on other developing countries. Especially in the late period of the US subprime crisis, the Federal Reserve implemented four rounds of quantitative monetary easing policies, which brought severe shocks to China's financial market and led to the A-share crash, as shown in Figure1 [6]. The Shanghai Composite Index fell off a cliff in the period after 2007. As the world's most important reserve currency and international transaction currency, the USD plays an important role in the international financial market, so the impact of the RMB exchange rate on A-shares is particularly important.
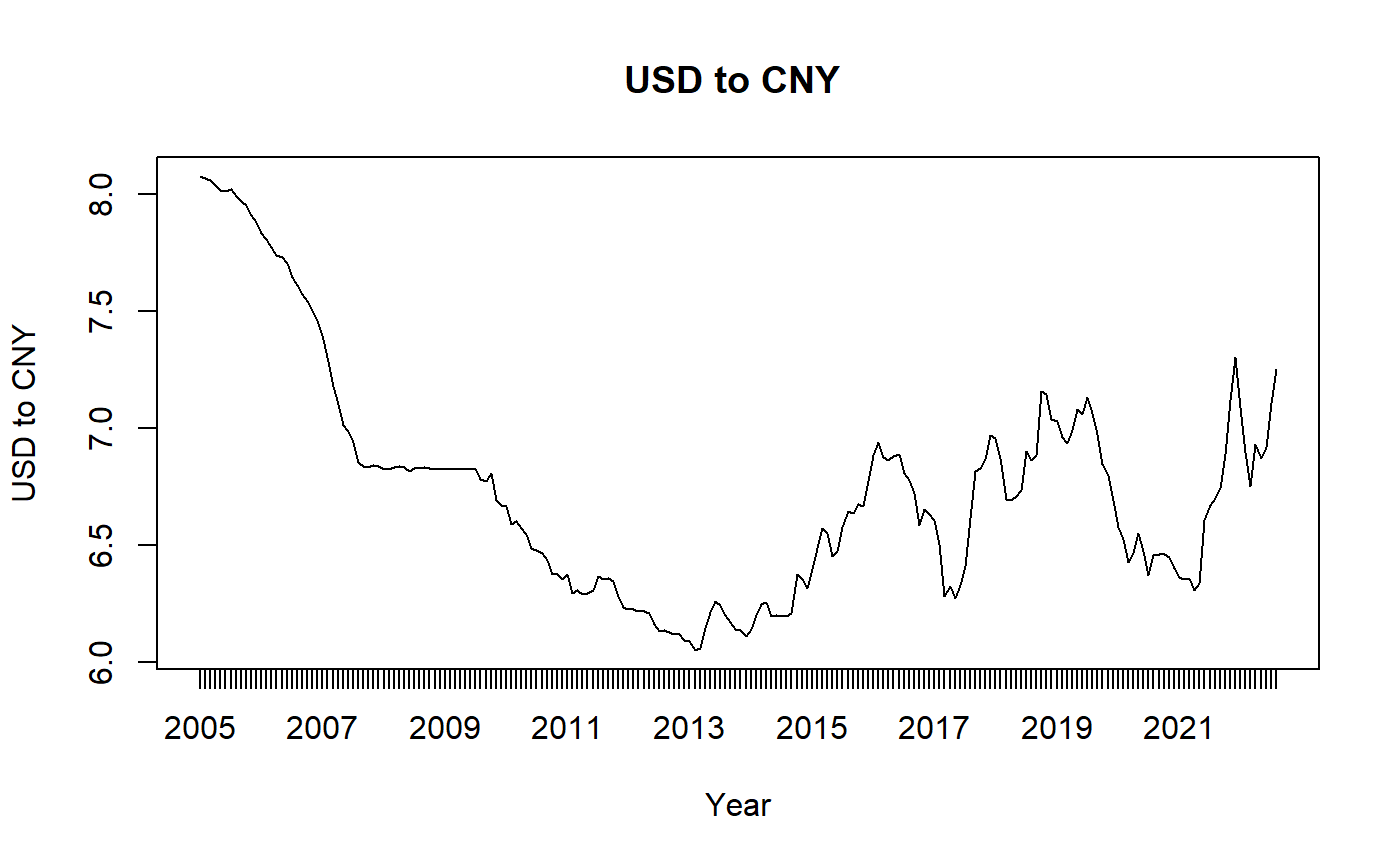
Figure 10: USD to CNY.
As shown in Figure 10, the trend chart of the exchange rate between the USD and the RMB from 2005 to 2023. Factors affecting the exchange rate of RMB and USD are diverse and complex. As shown in Figure 11, currency circulation from onshore to offshore RMB market is mainly realized through foreign trade surplus, while financial account deficit is mainly due to RMB and foreign currency swap [7].
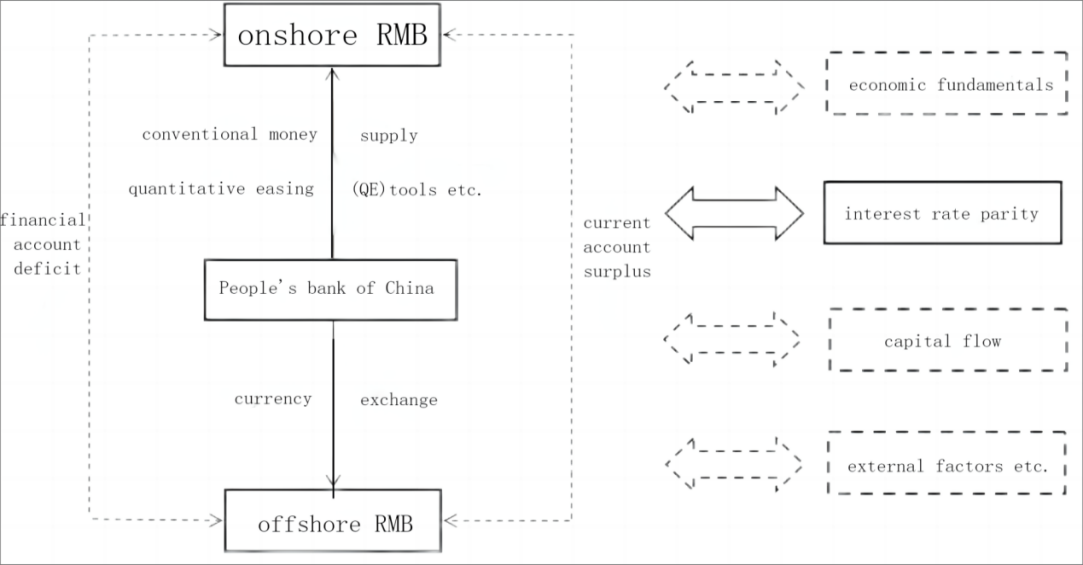
Figure 11: Diagram of factors affecting the exchange rate of RMB and USD.
Ma Q L. used the VAR-MGARCH-BEEK model to analyze the volatility spillover effect between the stock market and exchange rate [8]. Due to the strong position of the US dollar, the fluctuation of the USD to RMB exchange rate is affected by the spillover effect of the US monetary policy. Tan X F. believed that the interest rate hike of the US Federal Reserve led to the narrowing of domestic and foreign interest rate spreads and exchange spreads, and the rising demand for USD in the Chinese market led to capital outflow, which in turn led to the depreciation of RMB [9]. In general, the main factors that determine the value of a currency include national or international economic conditions, cross-border capital flows and exchange rate policies. In July 2005, the Chinese government announced the abandonment of the fixed exchange rate between RMB and USD and adopted a series of floating exchange rate systems, which triggered the depreciation of RMB to a certain extent. The Chinese government has been pursuing an export-oriented economic policy to increase its foreign trade surplus. The outbreak of the US subprime mortgage crisis in 2008 impacted the global economy, in order to stimulate exports and economic growth, China allowed the depreciation of the RMB to some extent. As shown in Figure 10, the RMB showed a depreciation trend from 2005 to 2013, and after 2013, the RMB began to depreciate. The relaxation of foreign exchange control by the Chinese government, trade frictions and disputes between China and the US have increased the uncertainty of the RMB foreign exchange market, and the important impact of the monetary policy of the US Federal Reserve on the US dollar exchange rate, etc. These factors have led to the volatility change of the USD/RMB exchange rate from 2013 to 2023 in Figure 10.
In summary, due to China's economic aggregate, market size, market sentiment and institutional differences, there is a certain gap with the US, resulting in the Shanghai Composite Index not rising as much as the three major indexes in the US, but China's high-speed and high-quality economic development and institutional reform are promoting the progress of the domestic financial industry.
3. Application and Result Analysis of ARIMA Model
The ARIMA model is a common time series analysis model used to predict future time points. It combines autoregressive (AR), differential (I) and moving average (MA) components. The parameters of the ARIMA model can be expressed as ARIMA(p,d,q), where p is the lag number of the autoregressive part,d is the number of differences performed, and q is the lag number of the moving average part. The selection of these parameters is usually determined by looking at autocorrelation graphs (ACF) and partial autocorrelation graphs (PACF).
The mathematical expression of the ARIMA model can be expressed as:
\( (1-{ϕ_{1}}β-{ϕ_{2}}{β^{2}}-…-{ϕ_{p}}{β^{p}})(1-β{)^{d}}({Υ_{t}}-μ)=(1+{θ_{1}}β+{θ_{2}}{β^{2}}…...+{θ_{q}}{β^{ϕ}}){ε_{t}} \) (1)
\( β \) is the Backshift operator, used to indicate the time series lag, \( {ϕ_{1}},{ϕ_{2}},...,{ϕ_{p}} \) is the autoregressive coefficient, \( {θ_{1}},{θ_{2}},...,{θ_{q}} \) is the moving average coefficient, \( {Υ_{t}} \) is the observed value of the time series at time \( t \) , \( μ \) is the constant term (mean), and \( {ε_{t}} \) is the white noise error term. The parameter estimation of the model can be determined using methods such as maximum likelihood estimation.
ARIMA model was used to fit the residual value diagram, ACF diagram, normal distribution diagram of residual value and PACF diagram for the historical closing prices of the Shanghai Composite Index and the three major indexes of the United States respectively, as shown in Figure 12-15.
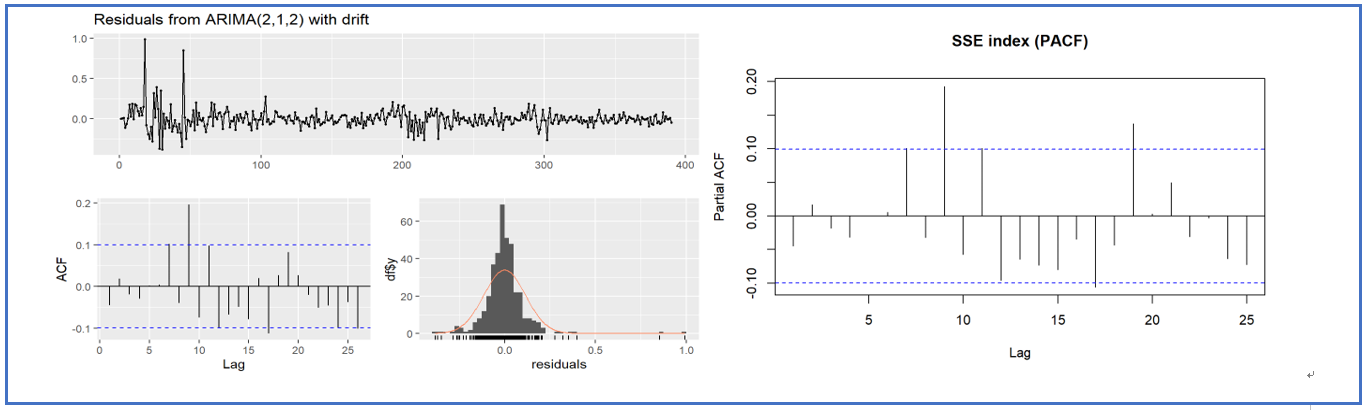
Figure 12: The residual value diagram, ACF diagram, histogram of residual value distribution and PACF diagram of Shanghai Composite Index based on ARIMA(2,1,2) model.
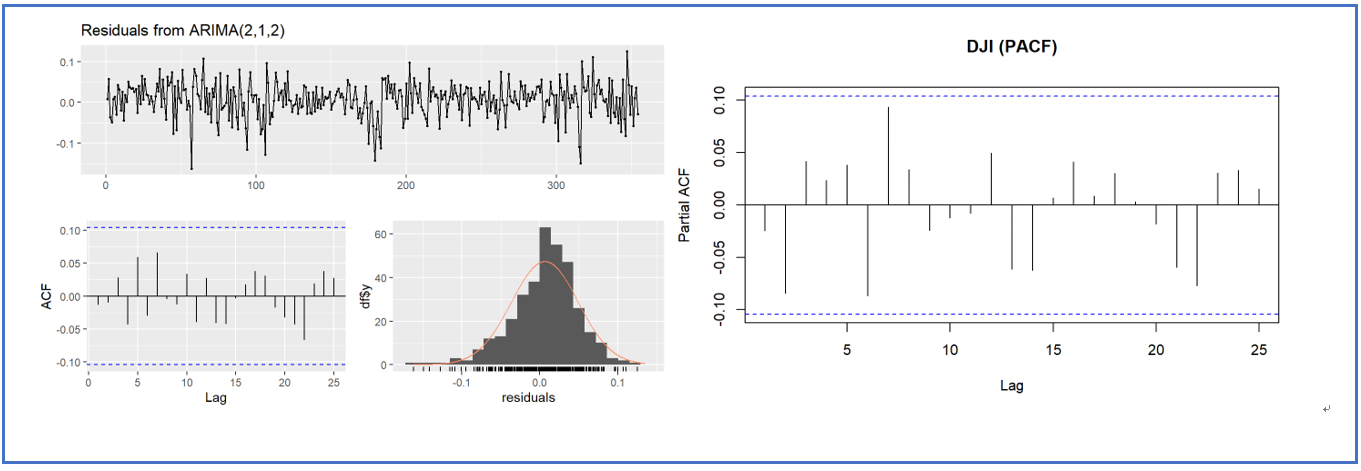
Figure 13: The residual value diagram, ACF diagram, histogram of residual value distribution and PACF diagram of Dow Jones Index based on ARIMA(2,1,2) model.
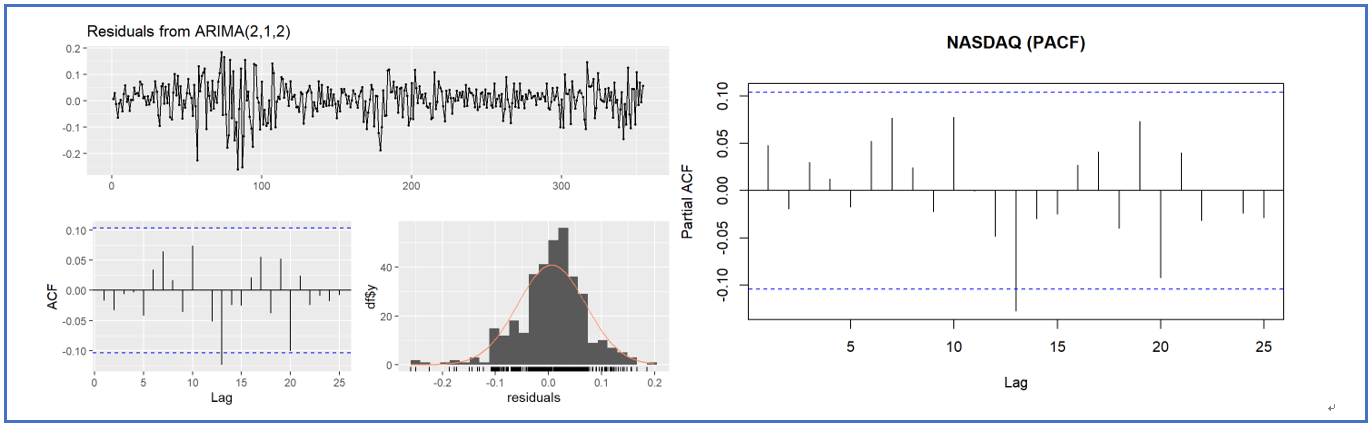
Figure 14: The residual value diagram, ACF diagram, histogram of residual value distribution and PACF diagram of NASDAQ Index based on ARIMA(2,1,2) model.
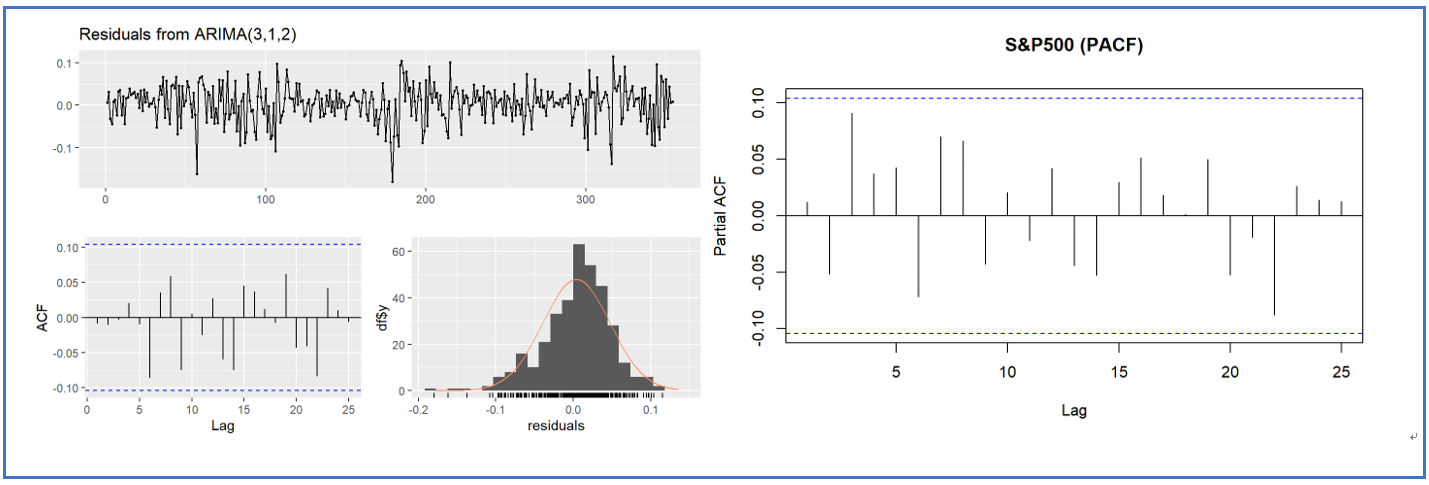
Figure 15: The residual value diagram, ACF diagram, histogram of residual value distribution and PACF diagram of S&P500 Index based on ARIMA(3,1,2) model.
The ARIMA(2,1,2) model is used for Shanghai Composite Index, Dow Jones Index and NASDAQ Index, as shown in Figure 12-14. The ARIMA(3,1,2) model is used for the S&P 500 Index, as shown in Figure 15. The residual value plots of the four indexes have no obvious pattern or trend, and are randomly distributed near the zero line and remain stable throughout the range. It can be seen from the ACF and PACF diagrams that the correlation coefficients of the four indexes are basically within the range of confidence interval, indicating that the correlation coefficients are not significant, and the influence of the lag order can be ignored. Moreover, the distribution of their residual values also shows an obvious normal distribution. The above analysis shows that the model fits the data more appropriately. Continue to use the model to forecast the closing price of the monthly line from July 2023 to June 2024 through the historical closing price of the four major indexes from June 2013 to June 2023.
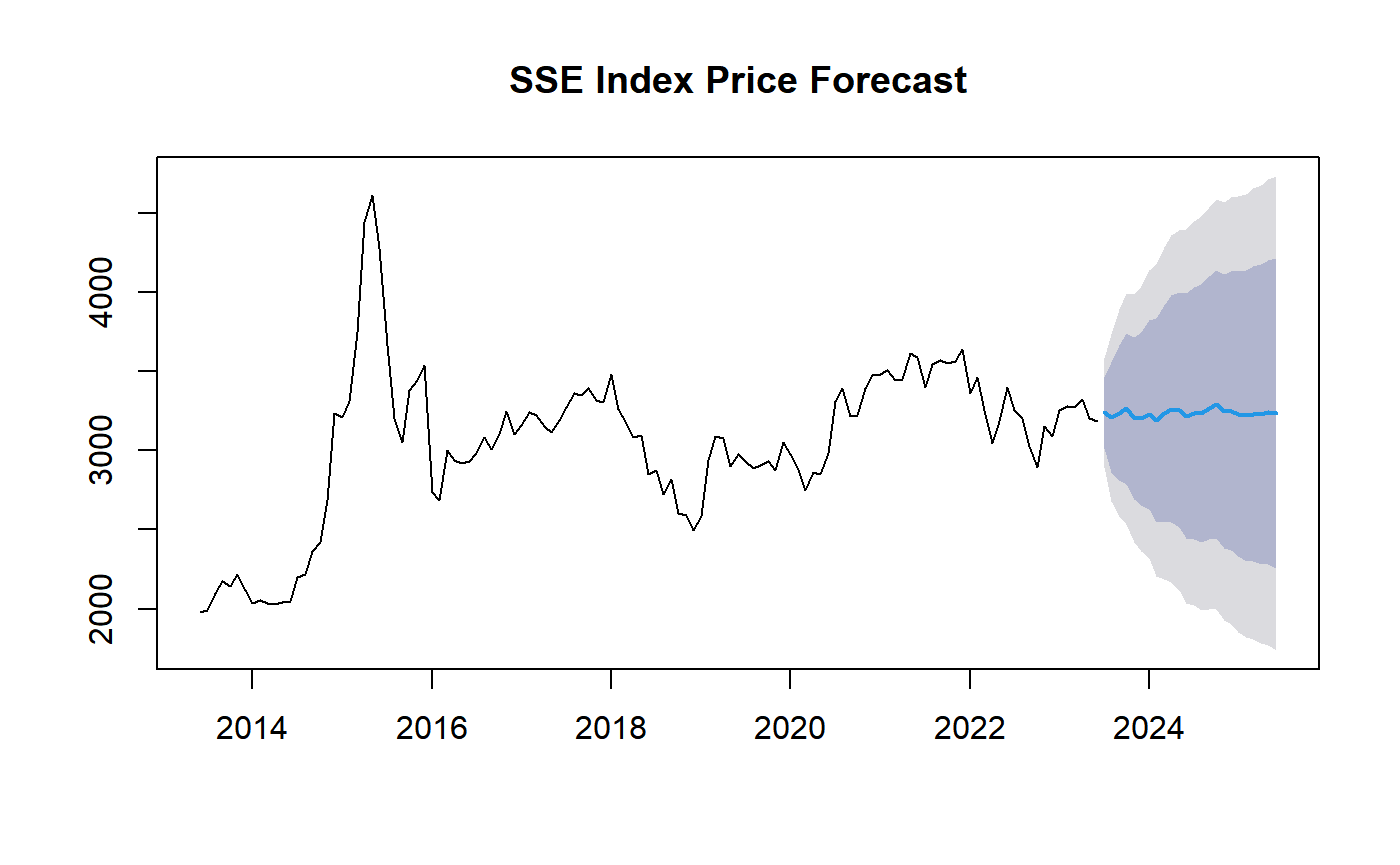
Figure 16: Monthly line price forecast chart of Shanghai Composite Index from July 2023 to June 2024.
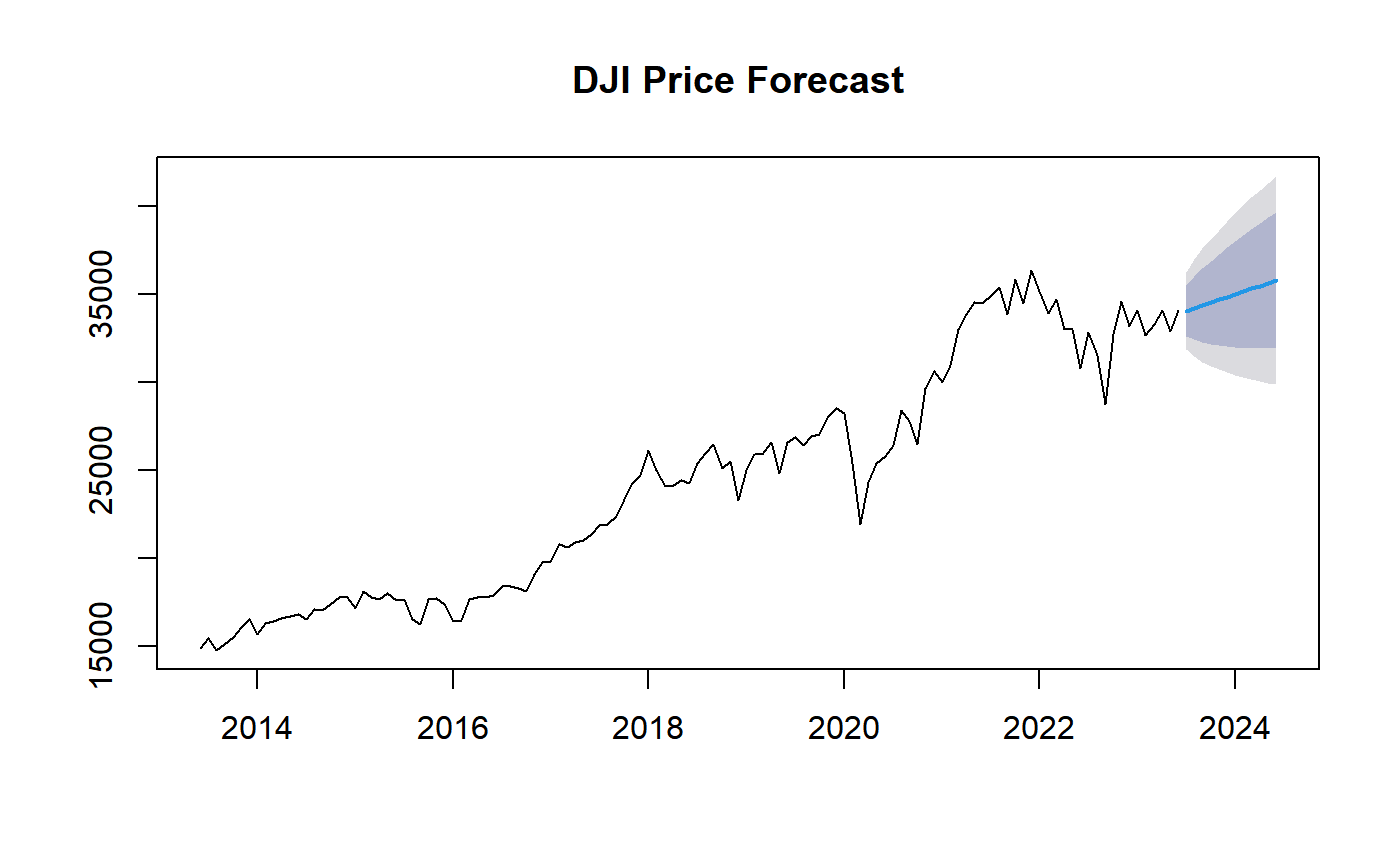
Figure 17: Monthly line price forecast chart of Dow Jones Index from July 2023 to June 2024.
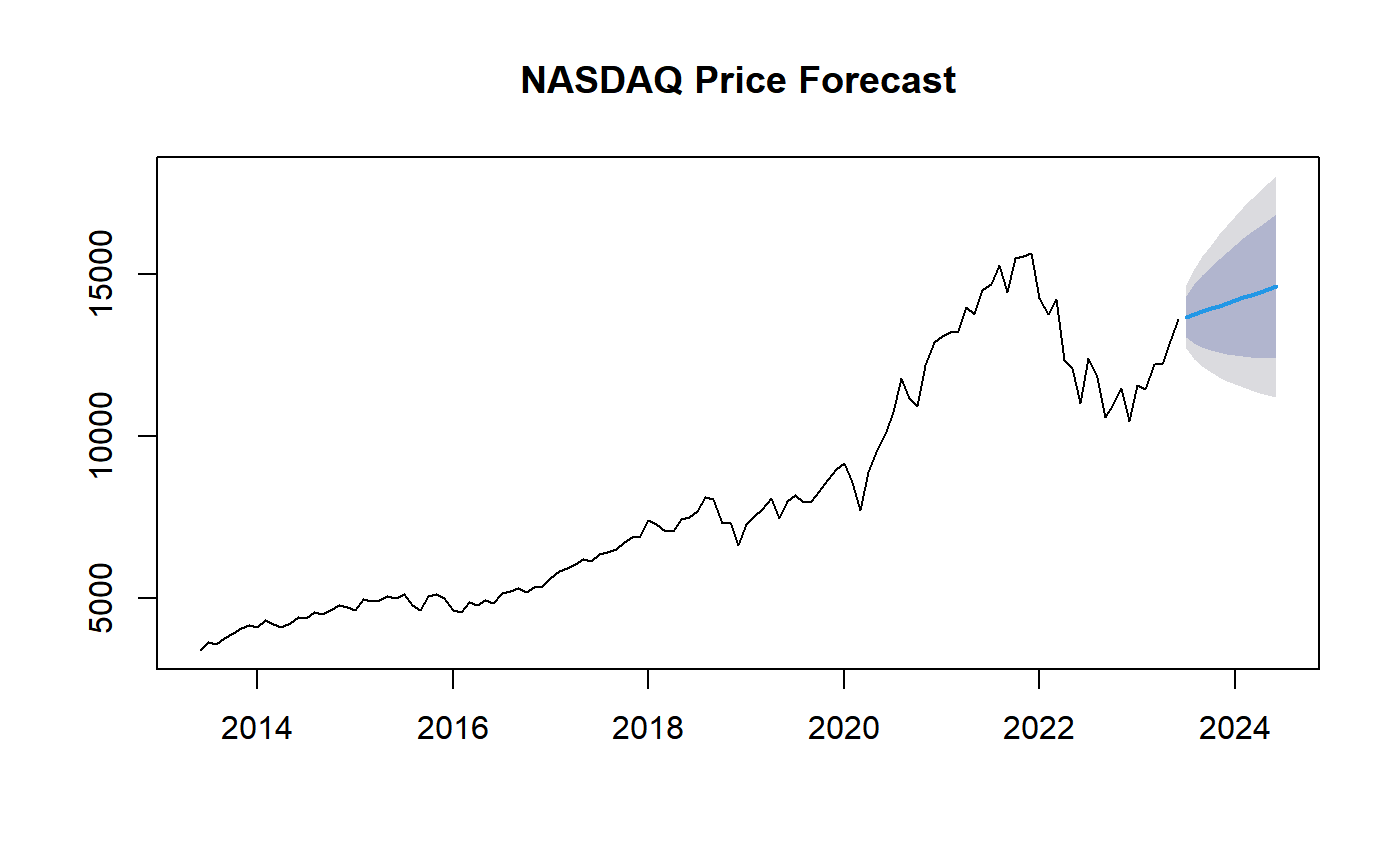
Figure 18: Monthly line price forecast chart of NASDAQ Index from July 2023 to June 2024.
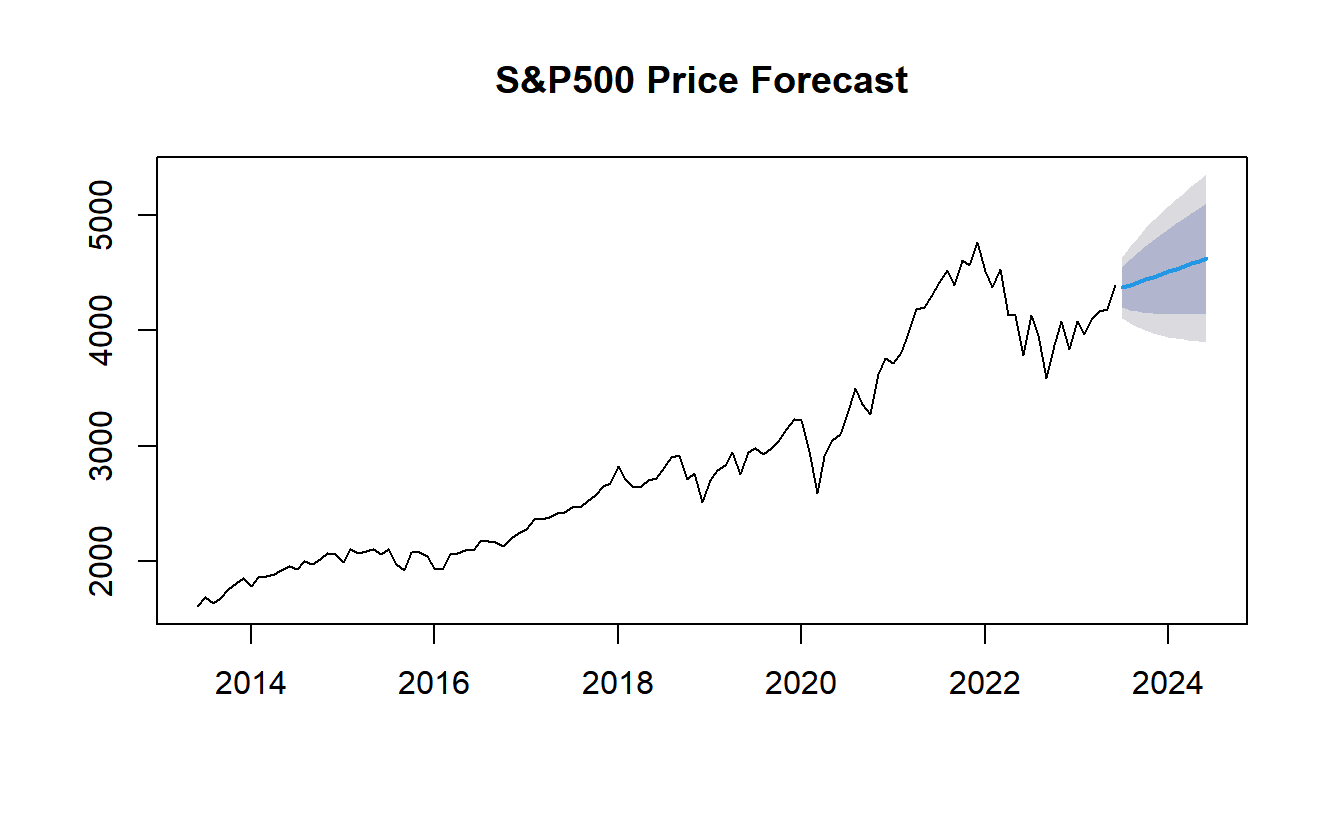
Figure 19: Monthly line price forecast chart of S&P500 Index from July 2023 to June 2024.
In Figure 16-19, the lavender area represents the 80% confidence interval, the pink area represents the 95% confidence interval, and the blue line represents the actual closing price predicted by the four major indexes during this period, all falling within the 80% confidence interval. The real data and the predicted results have similar characteristics. The ARIMA model has achieved the expected results in the short term for the above four indexes, which can provide guidance for potential investors. ARIMA model is used to predict short-term data with small error and excellent forecasting effect, while LSTM model is more accurate in simulating and forecasting long-term stock price data [10]. LSTM model and ARIMA model are both practical and accurate tools for stock price trend analysis. In order to further improve the forecasting performance of ARIMA model, more in-depth prediction methods such as neural network integration can be used [11].
4. Conclusion
The purpose of this study is to deeply analyze the trend of stock exchange markets and their indexes in China and US, and to explore the factors that affect the trend of these indexes. The goal of the study was to address the following questions: Is there a correlation between Chinese and American stock markets? What is the impact of economic and financial factors on the stock market index? At the same time, this study also tries to use ARIMA model to predict the index.
First, a detailed analysis of the historical movements of the Shanghai Composite Index, NASDAQ, S&P 500 and Dow Jones is carried out. These indexes all show a historical upward trend, indicating the influence of factors such as rapid national economic growth, improved investment environment and policy optimization. These indexes are of great significance in the financial market, and are used to measure the volatility and periodicity of the market, predict the development trend of the stock market, formulate investment strategies and evaluate portfolio performance. Stock investors, financial analysts and policymakers all pay close attention to the movements of these indices.
Secondly, the influence of economic and financial data on the trend of the index is studied. These include the national deposit rate, annualized growth rate of CPI, inflation rate and GDP. The study found that the decline in deposit interest rates may have reduced the enthusiasm of domestic investors in China, while the decline in the US federal funds rate has boosted the enthusiasm of US investment banks. In addition, the research results also show that China’s annualized growth rate of CPI is basically stable, while the annualized growth rate of CPI in the US has risen more after the outbreak of the COVID-19. These factors have a certain impact on the stock market index.
In order to predict the trend of the index more accurately, the ARIMA model is used as a tool for time series analysis. By fitting and forecasting the historical closing prices of the four major indexes, it was immediately found that the ARIMA model performed well in short-term forecasting. The model evaluation and result analysis show that the model is suitable for data fitting and can provide valuable prediction information.
However, there are some limitations to this study. First, because the research is based on historical data, it is impossible to take into account future uncertainties and new influencing factors. Second, the ARIMA model may have some limitations in making predictions about long-term stock price data.
Future research could further improve the predictive models, such as using deep learning models (such as LSTM) or neural network integration methods, to improve the accuracy and comprehensiveness of stock price predictions. In addition, more factors can be considered, such as policy factors, international relations, etc., to comprehensively analyze the influencing factors of the stock market index.
To sum up, this study provides valuable reference for investors, financial analysts and policymakers through the analysis of Chinese and American stock exchange markets and indexes, and the use of ARIMA model to forecast. The results are of great significance for understanding stock market trends and formulating related strategies. However, this study also has some limitations, which need to be further improved and further explored. Future research can continue to explore other forecasting methods and factors to improve the ability to accurately predict the trend of stock market indexes.
References
[1]. He S Y. (2016). Research on the linkage between Shanghai and Shenzhen stock and bond markets in China. Journal of Shandong Technology and Business University, 30(3), 6.
[2]. Mo Y. & Cheng R. (2017). Correlation analysis of Chinese and American stock markets based on vector autoregressive model. China's Collective Economy (25), 3.
[3]. Nishimura, S. (2009). A study on the correlation of Chinese and American stock markets: New evidence based on ccf test. Economic Review (2), 7.
[4]. Liu J Q. & Ma Y N. (2009). Research on the correlation between stock return rate and inflation rate: Based on the investigation of China's economic cycle fluctuation process. Journal of Social Sciences, Jilin University, 49(1), 120-125.
[5]. Zhao L S. & Liu L J. (2021). "Wide Yield" and the American subprime Crisis: A Review. (2019-6), 103-109.
[6]. Jin C Y. & Zhang L. (2017). Impact of Federal Reserve Monetary Policy on Chinese economy. Chinese Industrial Economy (1), 18.
[7]. Ba S S, Wang X Y, & Liu R. Spillover effects of specific fomc announcements on the RMB/USD exchange rate. International Business (Journal of University of International Business and Economics).
[8]. Ma Q L. (2015). The impact of interest rate fluctuation on the linkage of Shanghai, Shenzhen and Hong Kong stock markets. Financial Forum (12), 11
[9]. Tan X F. (2016). The negative impact of Fed's interest rate hike on China's economy and finance and its countermeasures. New Horizons (1), 6.
[10]. Wang X, Shi Q Q, Chen R Y, & Chen G Q. (2022). Research on stock prediction based on lstm-arima model. Frontiers in Social Science, 11(7), 14.
[11]. Lu, C. J. . (2010). Integrating independent component analysis-based denoising scheme with neural network for stock price prediction. Expert Systems with Applications.
Cite this article
Jiang,Z. (2023). Analysis and Prediction of the Trend of Chinese and American Stock Market Indexes Based on ARIMA Model. Advances in Economics, Management and Political Sciences,49,176-188.
Data availability
The datasets used and/or analyzed during the current study will be available from the authors upon reasonable request.
Disclaimer/Publisher's Note
The statements, opinions and data contained in all publications are solely those of the individual author(s) and contributor(s) and not of EWA Publishing and/or the editor(s). EWA Publishing and/or the editor(s) disclaim responsibility for any injury to people or property resulting from any ideas, methods, instructions or products referred to in the content.
About volume
Volume title: Proceedings of the 2nd International Conference on Financial Technology and Business Analysis
© 2024 by the author(s). Licensee EWA Publishing, Oxford, UK. This article is an open access article distributed under the terms and
conditions of the Creative Commons Attribution (CC BY) license. Authors who
publish this series agree to the following terms:
1. Authors retain copyright and grant the series right of first publication with the work simultaneously licensed under a Creative Commons
Attribution License that allows others to share the work with an acknowledgment of the work's authorship and initial publication in this
series.
2. Authors are able to enter into separate, additional contractual arrangements for the non-exclusive distribution of the series's published
version of the work (e.g., post it to an institutional repository or publish it in a book), with an acknowledgment of its initial
publication in this series.
3. Authors are permitted and encouraged to post their work online (e.g., in institutional repositories or on their website) prior to and
during the submission process, as it can lead to productive exchanges, as well as earlier and greater citation of published work (See
Open access policy for details).
References
[1]. He S Y. (2016). Research on the linkage between Shanghai and Shenzhen stock and bond markets in China. Journal of Shandong Technology and Business University, 30(3), 6.
[2]. Mo Y. & Cheng R. (2017). Correlation analysis of Chinese and American stock markets based on vector autoregressive model. China's Collective Economy (25), 3.
[3]. Nishimura, S. (2009). A study on the correlation of Chinese and American stock markets: New evidence based on ccf test. Economic Review (2), 7.
[4]. Liu J Q. & Ma Y N. (2009). Research on the correlation between stock return rate and inflation rate: Based on the investigation of China's economic cycle fluctuation process. Journal of Social Sciences, Jilin University, 49(1), 120-125.
[5]. Zhao L S. & Liu L J. (2021). "Wide Yield" and the American subprime Crisis: A Review. (2019-6), 103-109.
[6]. Jin C Y. & Zhang L. (2017). Impact of Federal Reserve Monetary Policy on Chinese economy. Chinese Industrial Economy (1), 18.
[7]. Ba S S, Wang X Y, & Liu R. Spillover effects of specific fomc announcements on the RMB/USD exchange rate. International Business (Journal of University of International Business and Economics).
[8]. Ma Q L. (2015). The impact of interest rate fluctuation on the linkage of Shanghai, Shenzhen and Hong Kong stock markets. Financial Forum (12), 11
[9]. Tan X F. (2016). The negative impact of Fed's interest rate hike on China's economy and finance and its countermeasures. New Horizons (1), 6.
[10]. Wang X, Shi Q Q, Chen R Y, & Chen G Q. (2022). Research on stock prediction based on lstm-arima model. Frontiers in Social Science, 11(7), 14.
[11]. Lu, C. J. . (2010). Integrating independent component analysis-based denoising scheme with neural network for stock price prediction. Expert Systems with Applications.