


1. Introduction
Mutual fund is known as an investment tool. It is accessible for the majority of the investors in the market. Its founders are eligible to raise more investments from the open market under regulations. For ordinary investors, they would consider investing in mutual funds partly a result of their reliance on professional and experienced financial people to make excessive returns for them. The fund managers can invest it in stocks, bonds and other securities, and the investor in the mutual fund owns a portion of the fund. As an investment method that contains so many dimensions and types of investment, mutual funds usually have higher liquidity than stock investment. Besides,
daily public quotations and the mechanism of buying and redeeming at any time are another major feature of mutual funds.
The development from 2006 to the present is the perfect stage of the development of mutual funds in China. During this stage, a series of law amendments and regulatory rules have been issued to put more investment and transaction restrictions on China's mutual funds. For example, on August 8, 2014, China Securities Regulatory Commission (CSRC) issued the "Management Measures for the Operation of Publicly Offered Securities Investment Funds” and proposed the "Double Ten Regulations". The "Regulations on Liquidity Risk Management of Public Funds", which came into effect on October 1, 2017, further restricts tradable stocks. The regulation requires all investment portfolios managed by the same fund manager to hold tradable shares issued by a listed company and shall not exceed 30% of the tradable shares of the listed company. On April 27, 2018, the central bank, the China Banking and Insurance Regulatory Commission, CSRC, and the State Administration of Foreign Exchange jointly issued the "Guiding Opinions on Regulating the Asset Management Business of Financial Institutions" (referred to as the "New Regulations on Asset Management"), which stipulates that all public offerings issued by the same financial institution. For asset management products, the market value of investing in a single security or a single securities investment fund shall not exceed 30% of the market value of the security or the market value of the securities investment fund.
Regulatory agencies in China are also constantly standardizing and improving the general investment requirements of mutual funds, including requirements for the leverage ratio of mutual fund assets, requirements for type restrictions on fund declarations, and information disclosure requirements. This also means that Chinese regulatory departments have further regulated the operation mode of mutual funds through laws, and it is also a way to protect and regulate the market.
The developments of Chinese mutual funds largely contribute to a more efficient and transparent market, which can be explained by the increasing number of institutional investors who keep providing professional and time-sensitive insights to the market. In 1989, Grinblatt and Titman [1] found that mutual funds tend to hold stocks with higher expected returns and lower risk, and that these stocks tend to outperform the market. However, they also find evidence of momentum investing and herding behavior among mutual fund managers, which can lead to suboptimal performance.
It is not an easy job to fully evaluate the performance of mutual funds. There are indeed plenty of metrics that could be very helpful to investors in selecting the appropriate mutual fund. For instance, track records, fees and expenses, etc. In practice, one of the important measures that those institutional investors would consider when examining the profitability of mutual funds is alpha, which is a concept introduced by Jensen [2] describing a fund’s risk-adjusted performance relative to a benchmark. His findings suggest that mutual fund managers, on average, did not exhibit stock-picking abilities that consistently outperformed the market after adjusting for risk. This research challenged the notion of active management's superiority over passive strategies, sparking considerable debate and influencing subsequent studies on mutual fund performance evaluation. Inspired by Jensen’s investigation, this article will have an in-depth discussion regarding the persistent performance of mutual funds measured by alpha.
In recent years, research related to the examination of persistent performance of Chinese mutual funds has been conducted by several teams consisting of Chinese scholars. Zheng and Sun [3] investigate the performance persistence of Chinese mutual funds using a Bayesian dynamic model over the period 2005-2011. Their study shows that the mutual funds' past performance has a positive and significant effect on their future performance, indicating persistence in performance. The authors find that the persistence is stronger for the funds with higher initial performance, smaller size, and lower expenses. Additionally, their finding provides evidence that the persistence effect weakens over time, suggesting that the mutual funds' ability to outperform the market decreases as time goes on.
Chen and H. [4] examine the persistence of mutual fund performance in China using a bootstrap analysis. The study employs the bootstrap method, a statistical technique that allows for the resampling of data, to assess the significance of the persistence of fund performance. The findings suggest that there is limited persistence in mutual fund performance in China. In other words, funds that perform well in one period do not necessarily continue to perform well in the future.
However, the earliest documentation of persistence in mutual funds can be dated back to 1997, in which Carhart [5] explained the persistence of mutual funds by examining the persistence of alpha in mutual funds and found that alpha was actually a persistent and significant measure of fund performance. It is worth mentioning that his findings were proved to hold under CAPM and his own four factor model with the dataset he was using. In later sections, I will include those models and validate his findings with Chinese mutual funds dataset.
To eliminate any confusion by using the term “persistent alpha” mentioned in the title, it refers to the consistent ability of a fund manager to generate positive alpha over an extended period of time. In other words, it suggests that the fund manager has a managerial skill or trading strategy that enables their portfolio returns to consistently outperform the market or a certain benchmark/index. Still, the significance of persistent alpha can vary for different types of investors in the mutual funds market. For example, for an active investor who frequently buys and sells funds, persistent alpha may be less important as their main focus is to pursue rapid and tremendous gains rather than long-term consistency. Things go very differently for a passive investor, who is more risk-averse and less “ambitious”; persistent alpha may be a crucial factor in their fund selection. In some cases, they are willing to sacrifice a portion of potential profitability to reduce the volatility. For instance, constructing a beta-neutral portfolio and diversifying their portfolio ensures them to theoretically eliminate the exposure to market risk.
In this article, we would cover two research questions we are interested in. First, to verify whether alpha can be used to evaluate the performance of mutual funds in the Chinese market. Then, to investigate how persistent alpha can be in predicting the performance of Chinese mutual funds. To help readers comprehend further research results, the article will first introduce the main methodologies applied in our experiments in Section 2. Then, the empirical results of each model will be discussed in Section 3. In the last section, we will summarize our findings and provide potential future research directions.
2. Data and Methodology
2.1. Data Source
Our main datasets are sourced from Wind Financial Terminal ®.
Our sample period is from January 2007 to July 2020. Reasons:(1) to investigate the impacts of recent major events in the Chinese financial market. (e.g. 2008, financial crisis) (2) From our observation, there are not enough data points of mutual funds prior to January 2007 (Appendix Figure 2.1). In order to make our research more representative and containing less bias, we decided to only consider the data points after January 2007.
2.2. Systematic Risk
Individual investments contain two types of risks: systematic risks and unsystematic risks. The unsystematic risk is related to specific stocks, also referred to as “specific risk”. It represents the volatility of the stock return that is not explained by the market moves. On the contrary, the market risk cannot be removed by the diversification of portfolios. Such as recessions, interest rate fluctuations, the outbreak of pandemic COVID-19 in 2020, etc..
2.3. CAPM, FF3F, FF3F+MOM
After the introduction of market risks, investors became interested in measuring systematic risks. The Capital Asset Pricing Model (CAPM) was developed by the financial economist William Sharpe [6] as a way to measure market risk. The principal idea of CAPM is that the expected return premium of a security is equal to the product of its expected market return premium and its beta.
CAPM helps researchers explain the return premium, but it is not always predictive and accurate. After a decade, Eugene Fama and Kenneth French [7] discovered that the performance of a large number of small-cap stocks or value stocks was lower than the CAPM result. As a result, they designed a statistical model that extended the original model by adding factors of size risk and value risk. These additional factors are also known as Small Minus Big (SMB) and High Minus Low (HML). Their model is named the Fama-French 3 Factor model (FF3F).
A few years later, Carhart [8] added the momentum factor to the FF3F model. Momentum (MOM) can be used to describe the speed of change in stock price and is defined as the difference between the weighted average of the lowest performing firms and the equally weighted average of the highest performing firms. In other words, it can be figuratively understood as Winner Minus Losers. Here, "Winner" represents the performance of the best firms, and "Losers" represents the performance of the least capable firms.
2.4. Hedging Strategies
Hedging strategies are used by investors to reduce their exposure to risk in the event that an asset in their portfolio is subject to a sudden price decline. When properly done, hedging strategies help investors reduce the likelihood of suffering dramatic losses and restrict the volatility of their investments. At the same time, their potential return rate remains positive. In the content below, we are going to discuss the beta neutral strategy, which is one of the most classical hedge fund strategies. Portfolios that are built under this strategy are of beta zero. That is, the weighted average of beta of each component in the portfolio sum up to zero. Theoretically, a beta-neutral portfolio generates profits without any exposure to the market risk.
For example, a fund manager can construct a beta neutral portfolio by entering a short position and a long position in stocks that are closely related (in the same industry) so that they can obtain absolute returns. When the market moves up, the losses due to the short position can be offset by the profit made in the long investments. Similarly, when the bear market comes, the long position’s losses can be offset by the profit from the short positions.
2.5. Evaluation Methods (Maximum Drawdown, Sortino Ratio, Sharpe Ratio)
We are going to apply three major performance metrics to evaluate the performance of the portfolios: Maximum drawdown, Sortino ratio, Sharpe ratio. These three metrics are representatives of the most practical and frequently appeared in major financial reports. They reflect what investors are caring about from different perspectives and they are easier to be interpreted by most investors.
Maximum drawdown (MDD) is a measure of an asset’s largest price drop from a peak to a trough. It is a typical indicator of downside risk over a specified period. We choose MDD because it is one of the most straightforward approaches that reflects the investors’ most heartbreaking moment in a specific period. A low MDD is preferred since it indicates that losses from the investments were small. However, if MDD is high, it might imply that the portfolio contains a high downside risk.
Sharpe ratio illustrates the relationship between the return of an investment and the corresponding risks. Typically, any Sharpe ratio greater than 1.0 is considered to be acceptable for the investors. If the investors find out the Sharpe ratio goes higher than 3.0, then the underlying asset is considered to be an excellent investment.
However, if we take a closer look at the formula calculating Sharpe ratio, we will find out the formula treats all volatilities as “risks”. Even though generally investors only care about the downside risks of their investments rather than the profitable fluctuations. Therefore, we choose Sortino ratio as a supplement of Sharpe ratio. Sortino ratio is a variation of Sharpe ratio that only factors the downside risk. All of these metrics help us better understand the performance of different investing strategies.
2.6. Quintile Portfolio
As we have introduced in the introduction, alpha is normally considered to be a significant metrics that measures how well the fund managers are doing within a specific time period. More importantly, alpha can be interpreted as the excessive return rate that is not explained by the factors regression of some capital pricing models such CAPM and FF3F. In our research result, we obtain the estimate of alpha by considering the alpha as the intercept of the regression results of different models.
For each tradable mutual fund from January 2008, we conduct asset pricing regressions on its return of the past year. The alpha we got from the historical return series were ranked in descending order. Then we picked the top 20% funds and named them as the “Tier 1” portfolio for January 2008. Similarly we can define the “Tier 2”, “Tier 3”, “Tier 4”, “Tier 5” portfolios. And we repeat the same process for every month after January 2008 until July 2020.
Then, for the new time series, we let the return of each portfolio to be the equally weighted average of the return of the funds within each portfolio. And we can simulate the net asset value curves by considering the initial investment for each portfolio to be 1 unit. If the curves are highly separated and arranged in order of alpha from top to bottom, we can verify that alpha performs a persistent role in selecting mutual funds.
2.7. Carhart Quartile Portfolio
We simulate four portfolios that correspond to exactly 4 factors in the Carhart 4-factor model. Our goal is to find out which portfolio has the highest Sharpe ratio and Sortino ratio and to examine whether these factors are statistically significant.
3. Main Empirical Results
In the next section, we are going to analyze regression results of CAPM, FF3F model, FF3F+MOM model. The evaluation metrics are (adjusted) R-squared values and p-values. In addition, we construct beta-neutral portfolios for each model. For the Carhart quartile portfolio, our purpose is to check the significance level of each covariate and also compare the performance of different portfolios.
3.1. CAPM
\( {R_{i, t}} - {R_{f}} = {α_{i}} + {β_{i}} * ({R_{m, t}} - {R_{f}}) + {ε_{i, t}} \) (1)
The formula above is the regression formula of CAPM. For detailed information about the notation, please refer to Appendix Table 4.1.
For the regression results, we considered the significance levels of 0.01, 0.05 and 0.1 based on the standards mostly accepted by the academia and industry. For the coefficients, we would focus on the estimates, p-value and adjusted R-squared values. P-value represents the statistical significance of the coefficient. It originates from the hypothesis test. Let’s denote our regression coefficient in a vector form: \( β \) = \( {({α_{i}} , {β_{i}})^{T}} \)
Then we can rewrite our equation (1) as
\( {R_{premium, i}} = Xβ + ξ \) (2)
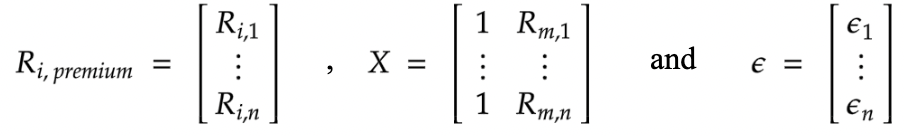
Note that \( {R_{i, j}} \) and \( {R_{m, j}} \) represent the realized premium return rate of portfolio i and market index at time \( j \) respectively. Then we give an example of our hypothesis test for \( {β_{i}} \) :
\( {H_{0}}: {β_{i}}=0 {H_{a}}: {β_{i}}≠0 \)
Given the distribution of \( \hat{β} \) is Gaussian( \( β \) , \( {σ^{2}}{({X^{T}}X)^{-1}} \) ), where \( {X^{T}} \) denotes the transpose of our data matrix and \( {β,σ^{2}} \) are true values of the population that we actually do not know. But we can substitute the population variance with sample variance \( \hat{σ} \) and end up having a T distribution
\( \frac{{\hat{β}_{i}}- {β_{i}}}{se({\hat{β}_{i}})} ~ {T_{n-p-1}} \)
where \( se({\hat{β}_{i}})=\hat{σ}\sqrt[]{{[({X^{T}}X{)^{-1}}]_{i+1, i+1}}} \) and \( p \) is the number of covariate in this case. ( \( p=2 \) ) Then the value of the test is \( t={\hat{β}_{i}}/se({\hat{β}_{i}}). \) And the p-value is readily obtained from the T distribution as \( 2P({T_{n-3}} \gt |t|) \) .
In other words, it tells us whether our regression coefficients are statistically meaningful. Adjusted R-squared represents the percentage of variation in the data space that has been explained by only the independent variable that actually affects the dependent variable. Compared with R-squared, adjusted R-squared is designed to penalize the modeler for adding variables that have little explanatory power to the dependent variable. Here we show the formula of R-squared and Adjusted R-squared.
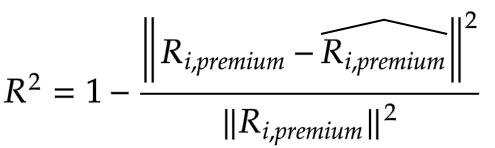
(3)
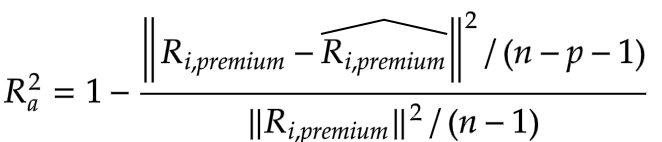
(4)
As for the hedging strategies, we simulate our beta-neutral portfolio by using two long-short strategies. The first strategy is to enter a long position in the Tier 1 portfolio and a short position in the Tier 5 portfolio. The second strategy is to enter a long position in the Tier 1 portfolio and a short position in the A share index.
3.1.1. Regression Results and Interpretation
Upon delving into the quintile portfolios, our analysis uncovered intriguing findings that shed light on their market dynamics. Notably, the coefficients associated with their market risk exhibited remarkable consistency, hovering around 0.82. Such stability in the coefficients suggests a reliable relationship between the portfolios and market movements. Furthermore, these coefficients were found to be statistically significant at a significance level of 0.01, instilling confidence in the robustness of the observed trends. This indicates that market risk plays a crucial role in shaping the performance of the quintile portfolios, and investors should carefully consider its implications.
A compelling pattern emerged when examining the alpha values across the quintile portfolios. We noticed a descending pattern from "Tier 1" to "Tier 5," where alpha values dwindled from 0.0068 to -0.0004. This observation underscores the persistent nature of alpha within the framework of the Capital Asset Pricing Model (CAPM). It suggests that certain mutual funds, with higher alpha values, consistently outperformed their counterparts with lower alpha values. Savvy investors, keen on securing superior returns, should closely monitor the alpha indicators and consider allocating their investments accordingly.
The adjusted R-squared values for the quintile portfolio provided remarkable insights into the stability and accuracy of CAPM's predictions. With values ranging from 0.70 to 0.86 across the five tiers, these high adjusted R-squared values indicate the model's ability to explain a substantial portion of the portfolio's performance. This offers a compelling endorsement of CAPM's predictive power and underscores its value as a tool for investment decision-making. Investors seeking reliable predictions and confident allocation strategies can find reassurance in the consistent performance of CAPM across different quintile portfolios.
Shifting our focus to the beta-neutral portfolios, intriguing findings emerged from the regression results. Notably, the regression estimates for betas in these hedged portfolios were remarkably close to zero, measuring at 0.011 and 0.10, respectively. This proximity to zero suggests that the portfolios exhibited reduced sensitivity to market risks. Such beta-neutral strategies can be appealing to risk-averse investors looking to minimize their exposure to market fluctuations.
However, it is crucial to note that these beta-neutral portfolios experienced a notable decline in their adjusted R-squared values following the hedging process. This decline can be logically attributed to the subtraction of two return series, effectively eliminating the shared market premium. Consequently, what remains in the new sequence are elements such as random error and alpha, according to our model assumptions. This adjustment rendered CAPM less effective in fitting the resulting time series, resulting in diminished explanatory power. Investors should exercise caution when applying CAPM to time series dominated by white noise, as it may yield less reliable predictions in such scenarios.
Intriguingly, despite the diminished explanatory power, the estimates of alpha for these beta-neutral portfolios were positive, measuring at 0.0057 and 0.0083, respectively. This positive alpha indicates that these portfolios had the potential for long-term profitability, even without any net exposure to market risks. Such findings suggest the presence of skillful portfolio management or unique investment strategies employed by the managers, enabling them to generate returns above and beyond what would be expected from pure market exposure.
Considering these results, investors should weigh the benefits of beta-neutral strategies, which offer reduced market risk, against the limitations of CAPM's explanatory power in the presence of white noise. Incorporating additional factors or exploring alternative models may be prudent when dealing with complex portfolio dynamics influenced by factors beyond traditional market risk.
3.2. FF3F Model
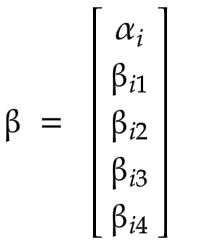
\( {R_{i, t}} - {R_{f}} = {α_{i}} + {β_{i1}} * ({R_{m, t}} - {R_{f}}) + {{β_{i2}}{SMB_{t}} +{β_{i3}}{HML_{t}} + ε_{i, t}} \) (5)
Equation (5) is the regression formula of FF3F model. Compared with CAPM, we added two factors of HML and SMB to construct the Fama-French three factor model. Note that our data matrix and \( β \) have changed to
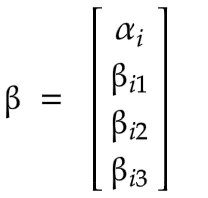
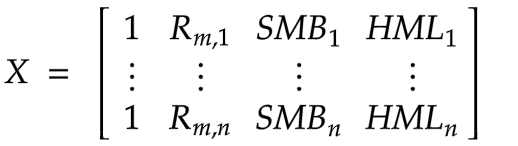
and
and \( p=4. \) But the calculation afterwards remains the same. For detailed information about regression results, please refer to Appendix Table 4.2. Still, the p-value, R-squared and adjusted R-squared values are our main concerns. Besides, we repeat the hedging strategies mentioned in 3.1.
3.2.1. Regression Results and Interpretation
In examining the regression results for the quintile portfolios, we unearthed intriguing insights into their market dynamics. Notably, the estimates of market risk for each portfolio were remarkably consistent, hovering around 0.82. This striking similarity suggests a strong and reliable relationship between the portfolios and market movements. Moreover, these estimates of market risk were found to be statistically significant at a significance level of 0.01, instilling confidence in the robustness of the observed trends. This implies that market risk plays a crucial role in shaping the performance of the quintile portfolios, making it a critical factor for investors to consider when making financial decisions.
An intriguing pattern emerged when examining the estimates of alpha across the quintile portfolios. We observed a descending pattern from "Tier 1" to "Tier 5," with alpha values decreasing from 0.0079 to -0.0004. This finding suggests that alpha serves as a persistent indicator within the Fama-French Three-Factor (FF3F) model. The declining trend implies that certain portfolios with higher alpha values consistently outperform those with lower alpha values. Savvy investors, well-versed in the nuances of the FF3F model, can leverage these insights to make informed investment decisions and potentially achieve superior returns.
The adjusted R-squared values for the quintile portfolios further bolster the case for the stability and accuracy of the FF3F model's predictions. Across the five tiers, these values remained consistently high, measuring at 0.77, 0.80, 0.81, 0.81, and 0.79, respectively. Such robust adjusted R-squared values across different portfolios provide compelling evidence of the model's ability to explain a significant portion of the portfolios' performance. This serves as a testament to the FF3F model's predictive power and affirms its value as a reliable tool for investment decision-making. Investors seeking dependable predictions and accurate portfolio analysis can find reassurance in the consistent performance of the FF3F model across various quintile portfolios.
Shifting our attention to the beta-neutral portfolios, we encountered intriguing findings in the regression results. Following the elimination of the market premium in each portfolio, the estimates of market risk for the two hedged portfolios were exceedingly close to zero, measuring at 0.0064 and 0.0093, respectively. This close proximity to zero suggests a substantial reduction in sensitivity to market risks within these portfolios. While this can be appealing to risk-averse investors seeking to mitigate their exposure to market fluctuations, caution should be exercised when interpreting these results.
Similar to the quintile portfolios, the beta-neutral portfolios experienced a decline in their adjusted R-squared values after employing the hedging strategy. This decline can be attributed to the elimination of the shared market premium, resulting in diminished explanatory power. The adjusted R-squared values serve as an essential gauge of a model's ability to explain the variation in a portfolio's returns. Therefore, the decrease in these values suggests that the FF3F model may not be as effective in explaining the performance of these beta-neutral portfolios. Investors should exercise caution when relying solely on the FF3F model in such scenarios and consider incorporating additional factors or exploring alternative models to enhance their understanding of the portfolio dynamics.
Notably, the estimates of alpha for the hedged portfolios were 0.050 and -0.033, respectively. These estimates suggest the potential for profitability in the long term, even without significant exposure to market risks. However, caution is warranted in interpreting these results, as the efficacy and sustainability of the hedging strategy are not conclusively supported. Investors should remain vigilant and thoroughly evaluate the underlying assumptions and risks associated with the hedged portfolios before committing their resources.
In conclusion, while the quintile portfolios exhibited consistent patterns and high predictive accuracy under the FF3F model, the beta-neutral portfolios presented some challenges in terms of explanatory power. Investors should carefully evaluate the suitability of the FF3F model in different portfolio contexts, considering its limitations and potential trade-offs when crafting their investment strategies. Augmenting the model with additional factors or exploring alternative frameworks may help address these challenges and provide a more comprehensive understanding of complex portfolio dynamics.
3.3. FF3F+MOM Model
\( {R_{i, t}} - {R_{f}} = {α_{i}} + {β_{i1}} * ({R_{m, t}} - {R_{f}}) + {{β_{i2}}{SMB_{t}} +{β_{i3}}{HML_{t}} + {β_{i4}}{MOM_{t }}+ ε_{i, t}} \) (6)
Equation (6) is the regression formula of FF3F + MOM model. In addition to the FF3F model, we added another factor, momentum to the FF3F model. For detailed information about notations, please refer to Appendix Table 4.3. The data matrix and \( β \) have changed to
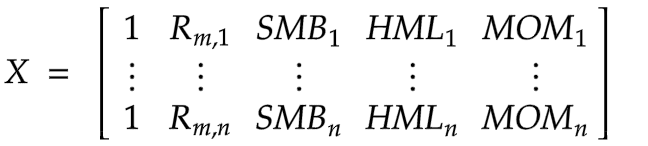
and
and the rest of the calculations stay the same.
3.3.1. Regression Results & Interpretation
Delving into the regression results, we uncover intriguing financial insights pertaining to the quintile and hedged portfolios under analysis. Beginning with the quintile portfolio, we observe a striking similarity in the coefficient of market risk, which consistently hovers around 0.82. This finding, with statistical significance at the 0.01 level, underscores the enduring influence of market risk on the portfolio's performance. As seasoned investors recognize, understanding and effectively managing market risk is crucial for optimizing investment strategies and safeguarding portfolio returns.
Furthermore, our analysis reveals a descending pattern in the estimates of alpha across the quintile portfolios, from Tier 1 to Tier 5. This pattern suggests the persistence of alpha as an indicator within the FF3F + MOM (Fama-French Three-Factor plus Momentum) model. The declining alpha values from the top to the bottom tiers imply that portfolios with higher alpha consistently outperform those with lower alpha. Such knowledge empowers investors to identify and potentially capitalize on the persistent alpha sources present within the FF3F + MOM framework.
However, despite the descending pattern of alpha, we did not observe a significant growth in the adjusted R-squared values. This observation suggests that the momentum factor, incorporated within the FF3F + MOM model, may not fully account for the variation in return rates across the quintile portfolios. This discrepancy underscores the importance of carefully considering the factors included in the model and exploring alternative explanations for the observed variation in returns. Seasoned financial practitioners recognize that comprehensive and accurate models are essential for making sound investment decisions and mitigating risks effectively.
Turning our attention to the hedged portfolios, our analysis indicates that the beta, representing market risk, has been successfully removed through the hedging strategy. This reduction in beta provides an opportunity for risk-averse investors to construct portfolios with diminished exposure to market fluctuations. However, it is noteworthy that the adjusted R-squared values for the hedged portfolios approach zero. This outcome implies that the model's ability to explain the variation in returns within these portfolios is significantly diminished, suggesting that other factors beyond the beta component may play a more prominent role in driving their performance. Astute investors recognize the need for comprehensive models that account for various factors to gain a deeper understanding of the dynamics at play within such hedged portfolios.
Examining the estimates of alpha for the hedged portfolios, we note values of -0.035 and 0.0073, respectively. While we expected the hedged portfolios to generate pure profits from positive alpha, the presence of a negative alpha raises concerns and prompts further investigation. This anomaly could stem from various factors, including the influence of outliers within the data. Outliers, which deviate significantly from the fitted lines, have the potential to distort regression results by equally weighing abnormal data points alongside normal data points. Despite conducting data cleansing procedures, outliers may have emerged due to the subtraction of Tier 1 returns and Tier 5 returns, warranting careful scrutiny of the data and potential adjustments to ensure the robustness of the analysis.
In conclusion, the regression results provide valuable insights into the quintile and hedged portfolios, shedding light on market risk, alpha persistence, and explanatory power. While the FF3F + MOM model captures some aspects of the quintile portfolios' performance, the limited growth in adjusted R-squared values suggests the need for additional factors to explain the observed return variation fully. Similarly, the hedged portfolios exhibit reduced market risk but require a comprehensive analysis beyond the beta component to account for their performance. Addressing potential anomalies, such as negative alpha, and mitigating the influence of outliers are crucial steps towards ensuring the accuracy and reliability of the analysis.
3.4. Carhart Quartile Portfolio
We conducted a comprehensive analysis of the factors influencing the performance of mutual funds over a five-year time period, focusing on financial insights to deepen our understanding. We calculated the t-stats for MOM (Momentum), SMB (Size), HML (Value), and MarkA (Market) factors to determine their significance in generating returns.
The t-stats analysis provides valuable financial insights by assessing whether the returns generated by these factors are statistically different from zero. In other words, it helps us understand whether these factors have a meaningful impact on the performance of mutual funds.
In our study, we divided the data into three time periods to capture potential variations in factor performance over different market conditions. By obtaining "partial" t-stats, we gained insights into how each factor performed within specific time scopes. Upon analyzing the results presented in Appendix Table 3, we observed that the MOM, SMB, HML, and MarkA factors were not statistically significant in influencing the average performance of mutual funds over the five-year period. This suggests that these factors may not be reliable predictors of returns in the context of our study.
However, an intriguing finding emerged when we considered the full sample. Building our model based on the entire dataset, we witnessed a dramatic increase in the explanatory power of the MarkA factor. The t-statistic for MarkA reached 2.09, surpassing our predetermined threshold for significance. This indicates that the MarkA factor exhibited a strong association with mutual fund performance when considering the complete time period.
These financial insights suggest that, while MOM, SMB, and HML factors may not be reliable indicators of mutual fund performance in our analysis, the MarkA factor appears to play a significant role. This finding highlights the importance of considering different factors and their specific performance patterns in financial research, as the impact may vary based on the time period or market conditions. By incorporating additional financial insights, we gain a more nuanced understanding of the factors influencing mutual fund performance and their potential implications for investors and portfolio managers. It underscores the need for ongoing analysis and the importance of considering various factors to make informed investment decisions.
4. Conclusion and Extension
Under three models we have tested with our dataset, the NAV curves of the quintile portfolio generated by the rank of alpha are well separated from each other (Appendix Figure 2.1 & Figure 2.2 & Figure 2.3). There are two investigations about this finding: First, funds selection based on alpha is very effective since we can observe that each group performs differently and there is no overlap in their NAV curves. Second, we can observe that the curves are arranged from Tier 1 and Tier 5 from top to bottom, from which we can deduce that alpha is indeed a persistent performance measure of the profitability of mutual funds. In other words, the high-alpha funds will keep outperforming the low-alpha portfolios in the long run.
From the MDD plots (Appendix Figure 1.2 & Figure 1.3 & Figure 1.4) we can see that the MDD of Tier 1 portfolio is significantly lower than the MDD of Tier 5 portfolio. That also means investing in Tier 1 portfolio will suffer less losses and has lower probability of downside risks than other portfolios. Also, it is quite obvious that Tier 5 portfolio is more volatile than Tier 1 portfolio by comparing the NAV of Tier 5 and Tier 1. The former has more spikes and more frequent variations than the latter. And that partly gives us a clue that the alpha is connected to the downside risks of the portfolio. The higher the alpha, the better the portfolio will perform when encountering a declining market. That probably explains why alpha is also related to the performance of the fund managers. If the managers pick the less volatile portfolio with a potential growing trend, their funds are supposed to outperform the market while not largely affected by the market falls.
As for our hedging strategies, we notice a decrease in alpha as a price for eliminating the market risks compared to naked long positions. That is what those hedgers are longing for, to minimize the impact from the market and limit the risks to fields in which they are able to handle. Although they are aware of the offsetting of profit margin, they seem more risk-averse and hate to suffer a huge loss.
In conclusion, our regression analysis and NAV curves of quintile portfolios achieve a consistent observation: alpha is a persistent performance indicator of Chinese mutual funds. Besides, we examined that constructing a beta-neutral portfolio enables investors to hedge the market risks while obtaining a pure alpha return. Due to limited resources and insufficient experience of the author in financial markets, this paper only provided a restricted result. Nevertheless, if more resources are invested in this research, fund flows and investor behavior will be another interesting topic. Research on fund flows and investor behavior has examined the relationship between investor sentiment, fund flows, and fund performance. Some studies suggest that large inflows or outflows can affect hedge fund performance and potentially impact alpha persistence. [9] In addition, the investment behavior and performance of mutual funds However, the findings and limitations of these studies may not be directly applicable to the Chinese mutual fund market and the specific context of Chinese mutual funds and the limitations of investor behavior research should be considered.
References
[1]. Grinblatt, M., & Titman, S.. Mutual fund performance: An analysis of quarterly portfolio holdings. The Journal of Business, 1989, 62(3), 393-416.
[2]. Jensen, Michael C. "The performance of mutual funds in the period 1945-1964." Journal of Finance, 1968, 23(2), 389-416.
[3]. Zheng, L., & Sun, W.. The performance persistence of China's mutual funds: Evidence from a Bayesian dynamic model. Pacific-Basin Finance Journal, 2015, 33, 1-22.
[4]. Chen, H., & Wu, Q.. The persistence of mutual fund performance in China: Evidence from a bootstrap analysis. Emerging Markets Finance and Trade, 2019, 55(1), 113-124.
[5]. Carhart, Mark M.. “On Persistence in Mutual Fund Performance” The Journal of Finance 1997, 52(1), 57-82.
[6]. Sharpe, William F. "Capital asset prices: A theory of market equilibrium under conditions of risk." The Journal of Finance 1964, 19(3), 425-442.
[7]. Fama, E. F., & French, K. R.. The cross-section of expected stock returns. The Journal of Finance, 1992, 47(2), 427-465.
[8]. Huang, J., & Zhang, Y.. Active mutual fund performance in China. The Journal of Wealth Management, 2018, 21(2), 37-46.
[9]. Liang, Bing, and Wei, Wei. "Fund Flows and Performance Persistence in the Hedge Fund Industry." Journal of Financial and Quantitative Analysis, 2005, 40(4), 749-772.
Cite this article
Tang,Y. (2023). Persistent Performance of Alpha in Evaluating and Predicting the Returns of Chinese Stock Mutual Funds. Advances in Economics, Management and Political Sciences,49,266-290.
Data availability
The datasets used and/or analyzed during the current study will be available from the authors upon reasonable request.
Disclaimer/Publisher's Note
The statements, opinions and data contained in all publications are solely those of the individual author(s) and contributor(s) and not of EWA Publishing and/or the editor(s). EWA Publishing and/or the editor(s) disclaim responsibility for any injury to people or property resulting from any ideas, methods, instructions or products referred to in the content.
About volume
Volume title: Proceedings of the 2nd International Conference on Financial Technology and Business Analysis
© 2024 by the author(s). Licensee EWA Publishing, Oxford, UK. This article is an open access article distributed under the terms and
conditions of the Creative Commons Attribution (CC BY) license. Authors who
publish this series agree to the following terms:
1. Authors retain copyright and grant the series right of first publication with the work simultaneously licensed under a Creative Commons
Attribution License that allows others to share the work with an acknowledgment of the work's authorship and initial publication in this
series.
2. Authors are able to enter into separate, additional contractual arrangements for the non-exclusive distribution of the series's published
version of the work (e.g., post it to an institutional repository or publish it in a book), with an acknowledgment of its initial
publication in this series.
3. Authors are permitted and encouraged to post their work online (e.g., in institutional repositories or on their website) prior to and
during the submission process, as it can lead to productive exchanges, as well as earlier and greater citation of published work (See
Open access policy for details).
References
[1]. Grinblatt, M., & Titman, S.. Mutual fund performance: An analysis of quarterly portfolio holdings. The Journal of Business, 1989, 62(3), 393-416.
[2]. Jensen, Michael C. "The performance of mutual funds in the period 1945-1964." Journal of Finance, 1968, 23(2), 389-416.
[3]. Zheng, L., & Sun, W.. The performance persistence of China's mutual funds: Evidence from a Bayesian dynamic model. Pacific-Basin Finance Journal, 2015, 33, 1-22.
[4]. Chen, H., & Wu, Q.. The persistence of mutual fund performance in China: Evidence from a bootstrap analysis. Emerging Markets Finance and Trade, 2019, 55(1), 113-124.
[5]. Carhart, Mark M.. “On Persistence in Mutual Fund Performance” The Journal of Finance 1997, 52(1), 57-82.
[6]. Sharpe, William F. "Capital asset prices: A theory of market equilibrium under conditions of risk." The Journal of Finance 1964, 19(3), 425-442.
[7]. Fama, E. F., & French, K. R.. The cross-section of expected stock returns. The Journal of Finance, 1992, 47(2), 427-465.
[8]. Huang, J., & Zhang, Y.. Active mutual fund performance in China. The Journal of Wealth Management, 2018, 21(2), 37-46.
[9]. Liang, Bing, and Wei, Wei. "Fund Flows and Performance Persistence in the Hedge Fund Industry." Journal of Financial and Quantitative Analysis, 2005, 40(4), 749-772.