


1. Introduction
From 1990s, more and more people found that buying stocks that have performed well in the past and sell stocks that have performed poorly in the past could be very profitable over 3 - to 12 - month holding periods [1]. From then on, momentum strategy had become one of the most popular strategies in algorithm trading rapidly [2], and it has been widely applied on many areas including stocks, ETFs [3].
However, a trading strategy cannot always work [4]. And despite the wide adoption and initial successes of momentum strategy, academic consensus on its consistent effectiveness remains inconclusive. In 2007, a report reveals that momentum profits come from compensation for time-varying unsystematic risks, which are common to the winner and loser stocks but affect the former more than the latter [5]. In this perspective, these risks are common to both winning and losing stocks but have a more significant impact on the former. This framework offers an interesting lens to understand the workings of momentum strategies, suggesting that success comes not just from choosing the right stocks but also from withstanding the broader risks of the market. The other theory suggests that investors utilizing momentum techniques leverage behavioral inconsistencies present in their counterparts. These could encompass phenomena such as collective investor behavior, the pendulum-like over- and under-reaction of investors, the disposition effect, and the presence of confirmation bias [6].
In addition, research indicates that the effectiveness of momentum strategies is also significantly influenced by market conditions. For instance, during periods marked by increased market volatility, there has been a noticeable decline in the returns generated by momentum strategies [7]. This underperformance contrasts sharply with the often-impressive returns of momentum strategies in bullish markets, further underlining the importance of market conditions in determining the strategy's success. Given the varying perspectives on momentum strategy and its inconsistent historical performance, it is necessary to evaluate the strategy in the contemporary market. The financial landscape has evolved significantly over the past five years, marked by phenomena such as the increased use of machine learning in trading, the rise of retail investors, and the widespread popularity of social-media-driven investing [8].
This essay, therefore, sets out to critically analyze the effectiveness of the momentum strategy in today's market by examining real-world stock data from the S&P 500 index over the past five years. In doing so, it aims to illuminate whether momentum strategy continues to hold promise for profitability in the modern investment climate. By shedding light on the performance of momentum strategy under recent market conditions, this paper will contribute to a deeper understanding of this popular strategy's role and relevance in contemporary investing.
The study implemented a momentum strategy that exploits the autocorrelation in stock returns, with an emphasis on using a linear regression model. The basic strategy involved forming portfolios over 257 stocks from S&P500 by taking long positions in stocks that have shown strong recent performance, and short positions in those that have performed poorly. In methodology, linear regression is applied to the returns of each stock against its respective moving average to derive parameters. This was done individually for each stock. The weights for each stock in the portfolio were then determined according the result of regression This meant that the weighting of the stocks in our portfolio was not uniform but rather based on their respective regression results. Long-Short strategy is used by ranking stocks based on the calculated weights, with higher weights corresponding to long positions and lower weights to short positions. We varied the length of the look-back period, comparing performances with different moving averages as the predictor in our regression model.
This strategy was back-tested on historical data from 2018 to 2023, with a particular focus on the recent period from 2020 to 2023. The strategy performed well in back-tests in the past [9]. However, its performance was mediocre in the recent stock data from 2020 to 2023. Moreover, when considering transaction costs, the strategy even exhibited significant losses [10].
2. Method
2.1. Data Source
Data used for the analysis is a daily return series of 257 stocks randomly chosen from S&P500 covering a period from 2018 to 2020. The returns were calculated based on daily closing prices.
2.2. Linear Regression
In this strategy, the focus was on capturing both the persistence of strong returns and the predictability of return reversal. We assumed that the moving averages AN of the past daily returns can be used to predict the future return. And a linear regression model was applied between the return and the moving averages of the daily returns for each stock. The moving average was calculated over various periods (1, 2, 5, 10, 20, 40, 60, 80, 100 days), providing a range of momentum "looks" from short-term to longer-term. The linear regression model helped to determine how sensitive the stock's returns were to changes in its own moving average. The parameters of the model are estimated based on the data between 2018 to 2020.
2.3. Specific Trading Strategy
To diversify away idiosyncratic risk, all of the 257 stocks are considered to be involved in the portfolio with different weight base on the result of linear regression. By spreading investments across many stocks, the strategy aims to reduce the impact of any one stock's performance on the overall portfolio. Using mean-variance allocation, the weights for each stock in the portfolio were then calculated as, where and are the coefficients estimated by the regression, andis the standard deviation of the residuals. This approach helped identify stocks that were likely to continue their strong performance.
Using the weights computed from the momentum analysis, the portfolio was constructed such that high-momentum stocks (those predicted to continue their strong performance) were bought, and low-momentum stocks (those predicted to experience a return reversal) were sold. By normalizing the weights so that their absolute values sum up to one, a fully invested long-short portfolio was achieved. This long-short strategy was designed to profit not just from the continued success of high-momentum stocks, but also from the predicted decline of low-momentum stocks.
Different values of transection cost rates are also taken into consideration. This unique combination of momentum-based and long-short strategies was designed to leverage the momentum premium while simultaneously mitigating market risk. This approach enhanced not only the theoretical robustness of the portfolio but also its resilience to broader market fluctuations. The portfolio's performance was subsequently assessed through an array of measures including the Sharpe Ratio, maximum drawdown, skewness, kurtosis, and cumulative returns.
3. Results and Discussion
3.1. A Simple One-Factor Model
Under the assumption that past performance of stocks will influence today’s performance. The methodology employed in this study hinges on the use of linear regression between two variables. Here, the variables under consideration are the moving average of each stock, serving as the independent or predictor variable, and the corresponding stock returns, functioning as the dependent or response variable.
Suppose we have a time series of returns. The exact formula for the linear regression model is: . Here, ε offers an estimate of the 'noise,' or the degree of prediction error. This serves as a valuable component in assessing the potential risks associated with the strategy. is the moving average of the return of the past N days from time t, where N is the lookback period. The parameters of the model can be estimated using linear regression with data from 2018 to 2020. The procedure leading to the derivation of crucial parameters: the slope and the intercept. The slope offers insights into the average change in a stock return associated with a unit change in the moving average, while the intercept provides the expected stock return value when the moving average equals zero. Once that is done, the model can be used to make predictions about the returns from 2020 to 2023.
The weight of each stock in the portfolio is then determined based on the outcomes of these individual regressions. This results in a portfolio where the weighting of stocks is not uniformly assigned but is instead influenced by their specific regression results. Specifically, the portfolios are constructed using mean-variance optimization, which aims to maximize expected wealth and penalized for variance within the portfolio. As a result, the weight of each stock in the portfolio is: , where is the constant risk for simplicity.
3.2. Moving Average and Momentum Indicator
Two different methods are applied to calculate the moving average of the return in the past N days. The first method is Simple Moving Average (SMA). It calculates the average return over the past N days with all data points are given equal weight. The second method is Exponential Moving Average (EMA). It calculates the average return over the past N days that more importance is given to the latest data. EMA gives more weight to recent data, it is more responsive to new information, whereas SMA provides a smoother and less volatile trend line.
The moving average employed within this strategy serves as a key momentum indicator for each stock. When the moving average exhibits an upward trend, it suggests positive momentum, whereas a downward trend indicates negative momentum. Furthermore, the portfolio is systematically rebalanced at regular intervals, adjusting the weights of each stock contingent upon their respective moving averages. This continuous recalibration enables the strategy to persistently harness and capitalize on the prevailing momentum effect.
3.3. Backtesting Result
Assuming that transaction costs are negligible, and using the Sharpe ratio as a measure of portfolio performance, Figure 1 illustrates a notable trend. With a consistent lookback period N, portfolios utilizing EMA generally outperform those using a simple MA. This could be attributed to the sensitivity of the EMA to more recent price changes, potentially allowing for faster responses to market shifts compared to the MA approach. However, the data shows on Table 1 does not suggest a clear correlation between portfolio performance and the length of the lookback period. Notably, the portfolio with a lookback period of N=1 demonstrates a standout performance compared to others.
The portfolio with a lookback period of N=1 notably outperforms its counterparts, which may suggest the benefits of a more dynamic strategy that swiftly adapts to the latest market trends. However, it is crucial to take into consideration that this finding dramatically shifts once transaction costs come into play. As depicted in Figure 1, the portfolio remains profitable for the training data (spanning from 2018 to 2020) when incorporating transaction costs of 0.1%. However, back-testing results from 2020 to 2023 transition into the red. As transaction costs escalate, the portfolio's performance deviates further from its original profitability, descending into substantial losses as shown in Figure 2. This decline is largely ascribed to the exceedingly high frequency of transactions prompted by the short lookback period.
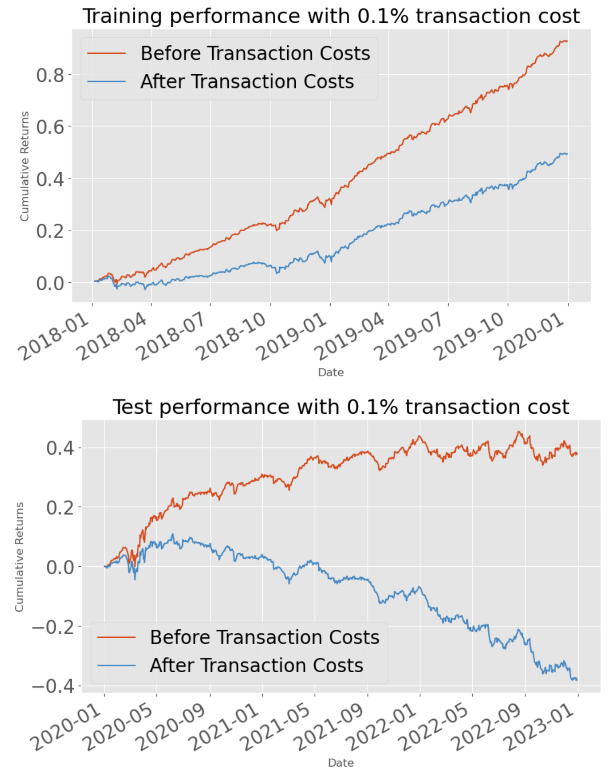
Figure 1: Training and testing performance with transection costs.
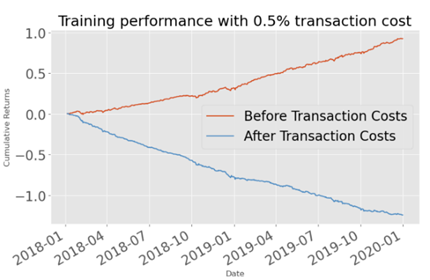
Figure 2: Performance with N=1 and 0.5% transection cost.
Figure 3 and Figure 4 contrast the performance of the various portfolio strategies against an equally weighted portfolio, which serves as a benchmark. The graph demonstrates that, even in the absence of transaction fees, a mere five strategies ("Momentum_MA_1", "Momentum_MA_60", "Momentum_EMA_5", "Momentum_EMA_10", "Momentum_EMA_20") manage to outperform this benchmark. This benchmark strategy is straightforward: it involves purchasing all available stocks in equal proportions and simply holding onto them. This result underscores the difficulty and complexity of consistently achieving superior returns in the stock market.
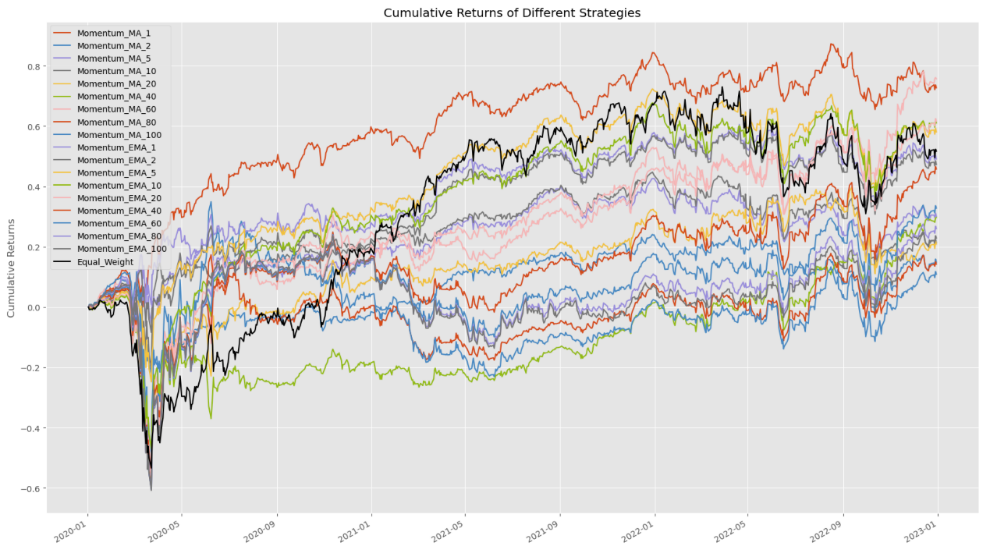
Figure 3: A general view of the performance of all strategies.
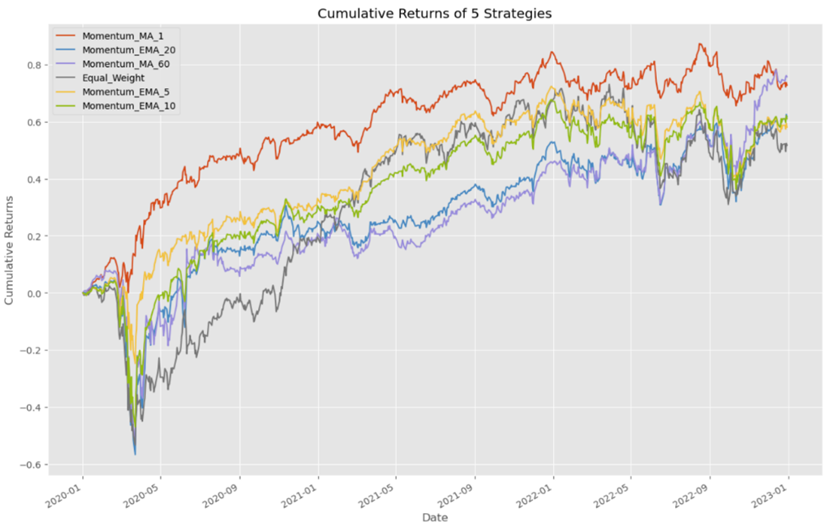
Figure 4: 5 strategies that outperform this benchmark.
The observations above highlight the crucial role transaction costs play in portfolio performance, particularly when the lookback period N is small. Upon incorporating a 0.1% transaction fee, as indicated in Table 1 and 2, the Sharpe ratio for the test data in some portfolios turns negative. This demonstrates the substantial impact even minor fees can have on the net returns of highly active trading strategies. For the remaining four strategies that outperformed the aforementioned benchmark, the situation is similar: even with a minimal transaction fee of 0.1%, the portfolio's performance deteriorates and may even turn into losses.
However, an intriguing observation emerges when the test dataset shown in Figure 3 is bifurcated into two distinct segments: the initial segment spans from January 2020 to January 2021, and the subsequent segment runs from January 2021 to January 2023. The former segment reveals that the majority of strategies consistently outperformed the benchmark, while a precipitous decline is noted in the latter part.
The causal factors for this phenomenon remain undetermined within the scope of this essay, but there are two plausible explanations. Primarily, the parameters of the linear model, which were derived from data spanning from 2018 to 2020, could potentially have greater predictive efficacy for the first part of the test data. This is due to its temporal proximity to the training data, suggesting a probable similarity in market trends. Secondly, the unique characteristics of this strategy could render it more beneficial during periods of heightened market volatility. In the span of a single year, the first part of the data exhibits a sharp downturn followed by a rally. In contrast, the second part displays a more tempered fluctuation, suggesting that the strategy may be more attuned to capturing the opportunities presented by market extremes, rather than consistently mild movements.
Table 1: Performance of different strategy with free transection costs.
Strategy | Sharpe_ratio | Max_drawdown | Kurtosis |
EMA_1 | 0.78 | 1.41 | 11.10 |
EMA_2 | 0.70 | 1.68 | 16.67 |
EMA_5 | 0.73 | 5.65 | 18.94 |
EMA_10 | 0.62 | 12.52 | 24.86 |
EMA_20 | 0.56 | 17.39 | 25.89 |
EMA_40 | 0.44 | 10.89 | 26.24 |
EMA_60 | 0.35 | 9.83 | 26.97 |
EMA_80 | 0.30 | 9.36 | 27.67 |
EMA_100 | 0.28 | 9.10 | 28.37 |
MA_1 | 1.16 | 1.00 | 12.55 |
MA_2 | 0.27 | 3.41 | 26.87 |
MA_5 | 0.48 | 1.15 | 17.52 |
MA_10 | 0.34 | 9.91 | 19.99 |
MA_20 | 0.29 | 11.24 | 25.89 |
MA_40 | 0.34 | 15.94 | 25.78 |
MA_60 | 0.62 | 7.71 | 25.54 |
MA_80 | 0.23 | 9.60 | 25.13 |
MA_100 | 0.20 | 5.10 | 23.09 |
Table 2: Some strategies with negative sharp ratio.
Strategy | Sharpe_ratio | Max_drawdown | Kurtosis |
MA_10 | -0.32 | 6.61 | 15.82 |
EMA_2 | -0.39 | 32.89 | 11.27 |
MA_5 | -0.52 | 3.56 | 12.45 |
MA_1 | -1.12 | 4.49 | 7.33 |
4. Conclusion
From 2020 to 2021, a majority of the strategies implemented demonstrated an encouraging performance, outpacing the benchmark for a significant portion of this period. However, the trend reversed from 2021 to 2023, with the majority of strategies experiencing losses. Notably, even those strategies that surpassed the benchmark over the entire period dipped into negative territory when minor transaction costs were factored in. These findings suggest that the simple momentum strategies explored in this essay may not yield consistently favorable results when directly applied to the S&P 500 in recent years. However, this should not be taken as a repudiation of momentum strategies as a whole. As the analysis above reveals, even these rudimentary strategies have the capacity to outperform the market from 2020 to 2021 under certain, albeit undetermined, conditions. Therefore, further research in this area is warranted and could potentially be fruitful. The development of a more nuanced and precise model, rooted in momentum, that aligns more closely with the intricacies of real market behavior, may indeed demonstrate robust performance. A strategy embracing complexity and precision, while still harnessing the underlying momentum, may perform well in the real market.
References
[1]. Jegadeesh, N. and Titman, S. (1993). Returns to buying winners and selling losers: Implications for stock market efficiency. Journal of Finance, 48, 65-91.
[2]. Waggoner, J. (2016). Momentum investing gaining speed among financial advisers. Investment News.
[3]. Ning, T. (2022). Research on Combinatorial optimization of Investment Strategies Based on Hierarchical clustering. Statistics and Decision Making, 6, 5.
[4]. Li, Z.W., Zhang, Y.Q. and Tang, J.P. (2022). Research on Investment Strategies Based on ESG Ratings. Investors, 30.
[5]. Li, X.F. et al. (2008). Momentum profits and time-varying unsystematic risk. Journal of Banking & Finance, 32(4), 541–558.
[6]. Luo, P.F., Duan, Y.Z. and Zhang, Y. (2022). Research on Dynamic Investment Strategies of Entrepreneurs with Inconsistent Time Preferences. China Management science, 30 (1), 10.
[7]. Barroso, P. and Pedro, S.C. (2015). Momentum has its moments. Journal of Financial Economics. 116 (1), 111–120.
[8]. Wu, X., et al. (2022). Research on Optimization of Momentum Portfolio Investment Strategies Based on Fractal Statistical Measures. Statistics and Information Forum, 37 (7), 75-85.
[9]. Ding, L.L. (2022). A Study on Investment Strategies for Online Stocks Considering Investors' Overconfidence Preference. Operations Research and Management, 31 (4), 204-210.
[10]. Hamilton, J. (1976). Competition, Scale Economies, and Transaction Cost in the Stock Market. Journal of Financial and Quantitative Analysis, 11(5), 779-802.
Cite this article
Jiang,Y. (2023). Application of Momentum Strategy to S&P 500: A Five-Year Retrospective Analysis. Advances in Economics, Management and Political Sciences,50,36-42.
Data availability
The datasets used and/or analyzed during the current study will be available from the authors upon reasonable request.
Disclaimer/Publisher's Note
The statements, opinions and data contained in all publications are solely those of the individual author(s) and contributor(s) and not of EWA Publishing and/or the editor(s). EWA Publishing and/or the editor(s) disclaim responsibility for any injury to people or property resulting from any ideas, methods, instructions or products referred to in the content.
About volume
Volume title: Proceedings of the 2nd International Conference on Financial Technology and Business Analysis
© 2024 by the author(s). Licensee EWA Publishing, Oxford, UK. This article is an open access article distributed under the terms and
conditions of the Creative Commons Attribution (CC BY) license. Authors who
publish this series agree to the following terms:
1. Authors retain copyright and grant the series right of first publication with the work simultaneously licensed under a Creative Commons
Attribution License that allows others to share the work with an acknowledgment of the work's authorship and initial publication in this
series.
2. Authors are able to enter into separate, additional contractual arrangements for the non-exclusive distribution of the series's published
version of the work (e.g., post it to an institutional repository or publish it in a book), with an acknowledgment of its initial
publication in this series.
3. Authors are permitted and encouraged to post their work online (e.g., in institutional repositories or on their website) prior to and
during the submission process, as it can lead to productive exchanges, as well as earlier and greater citation of published work (See
Open access policy for details).
References
[1]. Jegadeesh, N. and Titman, S. (1993). Returns to buying winners and selling losers: Implications for stock market efficiency. Journal of Finance, 48, 65-91.
[2]. Waggoner, J. (2016). Momentum investing gaining speed among financial advisers. Investment News.
[3]. Ning, T. (2022). Research on Combinatorial optimization of Investment Strategies Based on Hierarchical clustering. Statistics and Decision Making, 6, 5.
[4]. Li, Z.W., Zhang, Y.Q. and Tang, J.P. (2022). Research on Investment Strategies Based on ESG Ratings. Investors, 30.
[5]. Li, X.F. et al. (2008). Momentum profits and time-varying unsystematic risk. Journal of Banking & Finance, 32(4), 541–558.
[6]. Luo, P.F., Duan, Y.Z. and Zhang, Y. (2022). Research on Dynamic Investment Strategies of Entrepreneurs with Inconsistent Time Preferences. China Management science, 30 (1), 10.
[7]. Barroso, P. and Pedro, S.C. (2015). Momentum has its moments. Journal of Financial Economics. 116 (1), 111–120.
[8]. Wu, X., et al. (2022). Research on Optimization of Momentum Portfolio Investment Strategies Based on Fractal Statistical Measures. Statistics and Information Forum, 37 (7), 75-85.
[9]. Ding, L.L. (2022). A Study on Investment Strategies for Online Stocks Considering Investors' Overconfidence Preference. Operations Research and Management, 31 (4), 204-210.
[10]. Hamilton, J. (1976). Competition, Scale Economies, and Transaction Cost in the Stock Market. Journal of Financial and Quantitative Analysis, 11(5), 779-802.