


1. Introduction
The COVID-19 epidemic caused significant disruptions in all facets of human existence, including the world's economies, and has gone down in history as a pivotal time. The global economy faced unprecedented difficulties as a result of the health crisis and efforts to contain the spread of the disease, raising widespread worries about the risk of economic recessions. In order to forecast possible economic downturns based on information from the pandemic, this paper uses machine learning algorithms to analyze the complex relationship between the COVID-19 epidemic and economic recessions.
When COVID-19 first appeared in late 2019, it signaled the start of a global pandemic that quickly spread across continents and severely damaged the economy. In order to stop the virus's spread, rigorous precautions were required, such as mass lockdowns, travel restrictions, and social distance norms. Supply chains, production, trade, and consumer demand were all immediately impacted by these acts, which led to severe economic crises, including economic recession. According to Rodeck, economic recession refers to a prolonged, substantial drop-in economic activities that “lasts for months or even years.” Normally, economic recessions are characterized by decrease in GDP, decrease of consumptions, and higher unemployment rates [1]. By estimation, COVID-19 would lead to a 14 trillion U.S. dollars loss by the end of this year, with more than 1.1 million people lost their lives [2]. In a recession, losses in one industry can bring about huge losses in other industries. In detail, tourism alone can have a huge impact on GDP, total imports, and unemployment. Thus, a recession in a specific industry can also lead to an overall recession in the country's economy. [3]
By the graph below, we are able to discover that U.S. GDP decreased a lot in 2020, and the shaded area shows the phase of economic recession.
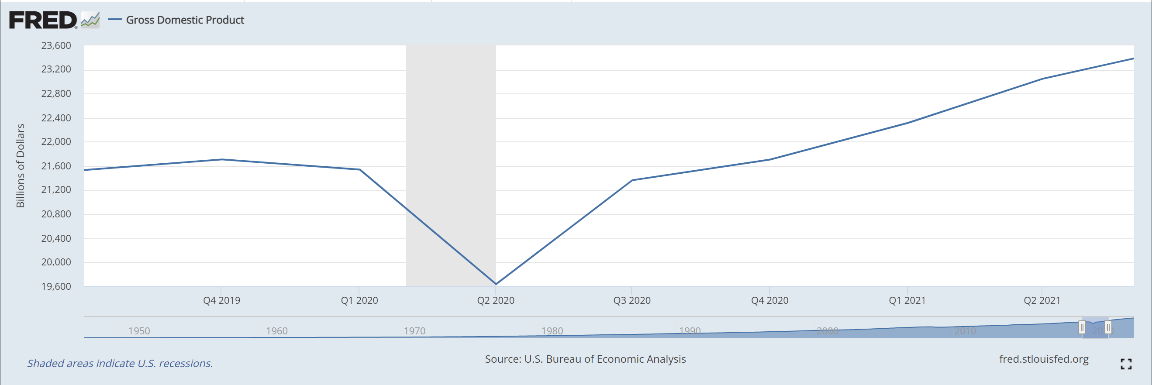
Figure 1: U.S. GDP between Jul. 2019 and Jun. 2021.
In light of this, economists and decision-makers have attempted to understand how the pandemic will affect economic growth and predict the risk of economic recessions. While useful, conventional forecasting methods might not adequately account for the specifics of this exceptional case. The goal of this study is to use models to better understand how the pandemic affected the economy and foresee the possibility of future recessions in the post-COVID era.
By analyzing a wide array of economic indicators, including GDP growth, unemployment rates, population growth rates, and financial market volatility, we will employ machine learning algorithms to uncover patterns, correlations, and anomalies in economic data during the pandemic period, which will enhancing our ability to forecast potential economic downturns with greater accuracy and timeliness.
Eventually, by utilizing the strength of econometrics models, this work aims to make a contribution to the developing field of economic forecasting during and after the COVID-19 epidemic. We seek to broaden our understanding of the pandemic's effects on economies around the world and offer insightful information on the possibility of economic recessions by fusing empirical research and cutting-edge data analytics. The application of cutting-edge machine learning technologies promises to pave the path for more informed policy decisions and policies to boost economic resilience and recovery as we traverse the uncertain economic landscape produced by the COVID-19 pandemic.
2. Study Based on Google Covid-19 Community Mobility Reports of US in 2020
The COVID-19 pandemic outbreak and its global expansion have had significant effects on a variety of facets of human life, including health, interpersonal relationships, and economic stability. In addition to posing problems for public health systems, the epidemic has shown weaknesses in economies all around the world, prompting worries about possible recessions. It becomes essential to investigate the relationship between economic mobility data and COVID-19 data in order to get deeper understanding of the economic effects of the COVID-19 pandemic and to predict prospective economic recessions. Data on economic migration can give important information about how the pandemic has affected economic activities and livelihoods. The propagation of the virus and its effects on public health, on the other hand, can be used as indicators of the pandemic's impact on economic developments, according to COVID-19 data.
In order to evaluate how changes in one variable relate to changes in another, correlation analysis is a crucial statistical method that can identify possible links between two sets of data. Analyzing the link between COVID-19 data and economic mobility data in the context of our research on economic recession projections can provide some insightful findings.
2.1. Backgrounds of the Pandemic in US, 2020
The COVID-19 pandemic emerged in the United States in January 2020, and the virus quickly spread across the country. The US economy was significantly and widely affected by the COVID-19 pandemic. Authorities put severe controls in place to stop the virus's spread, including stay-at-home orders, company closures, and travel restrictions. Due to the substantial economic disruptions brought on by these actions, many people lost their jobs, consumer spending fell, and businesses closed.
The unemployment rate increased to previously unheard-of heights, peaking at 14.7% in April 2020, the highest level since the Great Depression [4]. The hardest damaged industries included those in the travel, hospitality, and retail industries, which saw drastic drops in income and employment. Millions of Americans lost their jobs because of the economic crisis brought on by the pandemic, and many are now struggling to make ends meet.
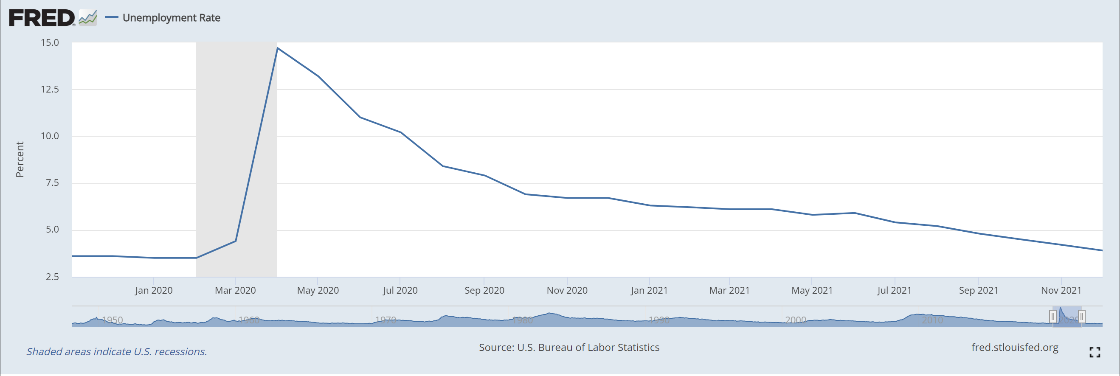
Figure 2: Unemployment Rate in the U.S. from Nov. 2019 to Dec. 2021.
The US government made substantial efforts to help individuals, businesses, and the economy as a whole in reaction to the economic crisis brought on by the pandemic. A significant stimulus package known as the Coronavirus Aid, Relief, and Economic Security (CARES) Act was passed in March 2020. It contained provisions for direct financial assistance to individuals and families, expanded unemployment benefits, loans and grants for small businesses, support for healthcare providers, and funding for state and local governments.
The Federal Reserve also employed numerous monetary policy tools to balance financial markets and supply banks and businesses with liquidity. In order to stimulate the flow of credit in the economy, interest rates were cut to almost zero levels and quantitative easing measures were used.
For the COVID-19 data, I use the data provided by Johns Hopkins University Center for Systems Science and Engineering, which is one of the most extensively utilized and reliable sources for monitoring the global COVID-19 pandemic epidemic [7]. The JHU CSSE keeps an online dashboard with up-to-date information on the number of confirmed cases, fatalities, and recoveries of COVID-19 globally. The information is gathered from a variety of official sources, including press reports, international organizations, and government health departments. To ensure accuracy and dependability, JHU CSSE has a team of researchers and data analysts who curate and validate the material, which increases the credibility of its data.
2.2. Community Mobility Data
In the research, I use the COVID-19 Community Mobility Reports published by Google in 2022 [6]. During the COVID-19 epidemic, Google's COVID-19 Community Mobility Reports offer aggregated and anonymized information on people's travels and activities in various places. These reports were developed in response to the worldwide pandemic to provide information on how people's behavior and travel patterns have altered in various areas.
These papers' major goal is to assist academics, policymakers, and public health professionals in comprehending how effectively social exclusion and other preventive measures are being implemented in various locales. Experts can evaluate the efficacy of steps taken to restrict the spread of the virus and pinpoint possible problem regions by evaluating trends in movement data.
The COVID-19 Community Mobility Reports encompass a range of venues and activities, such as shopping and entertainment centers, grocers and drugstores, parks, transit hubs, places of employment, and residential areas. Users can examine changes in mobility over time and contrast various locations or nations thanks to the data's presentation in a series of graphs and charts.
In this research, we try to analyze the data in the United States. Therefore, we find the data of COVID-19 from Johns Hopkins University CSSE, and we combine the COVID-19 data with the economic mobility data.
2.3. Correlation between Economic mobility and Covid-19 data
The results show that the correlation between daily new cases of COVID-19 and the data of retail & recreation, grocery & pharmacy, transit stations or workplaces is weakly negative, while the correlation with parks is moderately negative. The only weakly positive correlation exists between daily new cases and the residential data. Related studies have also confirmed the results we obtained. The percentage of remote working in professional services sector was more than 80%, while only 3% of hospitality and food services was possible by remote working [5].
It’s easy to understand the results. When the epidemic comes, people will go to places that are essential to their lives less often, and that explains those four weakly negative correlations. Parks are places for leisure and entertainment, which aren’t essential to people's lives. Therefore, the number of trips to the park decreases even more dramatically as the number of cases increases. However, people would be more likely to stay at home, which makes the relationship between COVID cases and the data of residential areas weakly positive. Thus, people will cease going out and spending money, which will worsen the economy.
3. Predictive Model
The GDP is a crucial economic metric that calculates the worth of all products and services produced inside a nation’s borders during a given time period. Therefore, developing a predictive model of the US Gross Domestic Product (GDP) is crucial. Then, policymakers can develop effective methods to encourage economic stability, lower unemployment, manage inflation, and support sustainable economic growth by projecting future GDP growth or contraction. Accurate GDP estimates are essential for firms and investors to make informed strategic decisions, while it could significantly influence public perception and confidence in the economy as well.
3.1. Data
In order to forecast the GDP, we need to find the data from the FRED economics data. The graph of the trend for GDP is in the figure below:
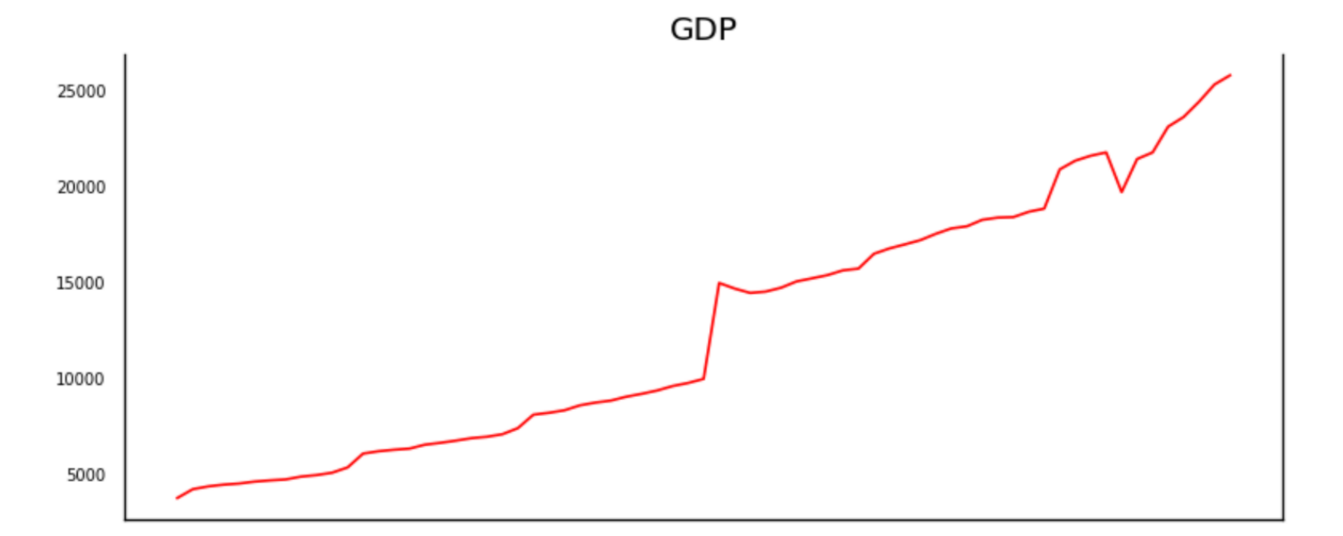
Figure 3: The trend of GDP from 1983 to 2023.
Then we split the data into the training set and the testing set. We include four pairs of data in the testing set and all other pairs of data are in the training set. Next, we have to use the augmented Dickey-Fuller test since the data in the training set needs to be stationary in the regressions, and we difference all the data once and repeat the test in the process. After converting the data stationary, we are supposed to use the VAR model.
3.2. Model
Based on data from the COVID-19 pandemic, we propose in this research to use the Vector Autoregression (VAR) model as one of the primary approaches to anticipate economic recessions. The VAR model is a potent time series analysis technique that is frequently employed in econometrics to look at the changing relationships between numerous variables over time.
Understanding the relationships and interconnections between important economic indicators and the effects of the COVID-19 epidemic on the US economy is the main goal of this research. To develop a thorough VAR model that represents the intricate interplay between these components, we will make use of a variety of economic statistics, such as GDP growth, unemployment rate, consumer spending, corporate investments, and other pertinent variables. To create a complete and trustworthy forecasting model, we may also combine the advantages of the VAR model and machine learning techniques.
The VAR model is advantageous because it allows for the incorporation of a large number of endogenous variables, enabling us to investigate how changes in one variable could have an immediate and simultaneous impact on other variables. By using the VAR model to historical data, we can analyze how economic indicators respond to shocks such as the COVID-19 pandemic and anticipate potential recessions.
In the research, we have already made all the data stationary. Then we want to find the lag order with the least AIC (Akaike Information Criterion) as the right order for the VAR model. We find out that the AIC descends to its lowest when lag order equals to 5, which determines the order of our model. After training the VAR model of order 5, we check the Durbin-Watson statistic of all the variables. Since all values are around 2, we could conclude that there is no significant serial correlation.
3.3. Model Predictions
The results of the forecasting are in the graph and the table below:
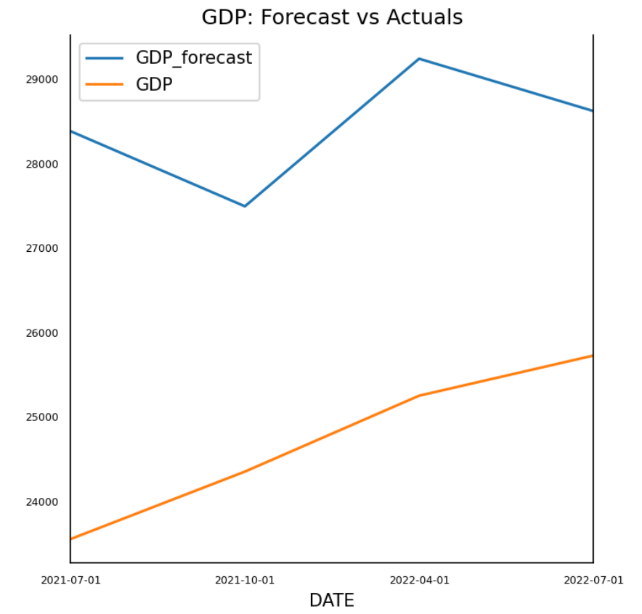
Figure 4: The comparisons for all four variables between the real data and the forecasting data.
Table 1: The evaluation metrics of GDP.
mape | 0.15127 |
me | 3716.6347 |
mae | 3716.6437 |
mpe | 0.15127 |
rmse | 3793.78215 |
corr | 0.48893 |
minmax | 0.1306 |
We can discover that mape is larger than 0.1 but smaller than 0.25, which means that the forecast accuracy is acceptable. However, we find out that mae is far from 0, showing that the predicted values and the real values differ a lot. The value of rmse further illustrates the large differences between data points. Therefore, the results of both the graph and the table show that the prediction of the GDP is not similar to the real data.
4. Limitations of the Analysis
Despite the fact that the proposed analysis using the Vector Autoregression model and machine learning techniques offers insightful information about predicting economic recessions based on data from the COVID-19 pandemic, it is crucial to recognize and address any potential limitations to guarantee the accuracy and reliability of the findings. For example, the data of COVID-19 cases might not be accurate due to various reasons. The accuracy of tests wasn’t 100%, and there could be asymptotic cases that weren’t discovered. There could also exist social and political factors that affect the report of cases. At the same time, there could be external factors influencing the credibility of the model, such as natural disasters. Therefore, we need a model which could include all the related factors.
5. Conclusion
In this paper, we analyze the economic toll of COVID-19. We firstly find out the correlations between the new cases of COVID-19 and the economic mobility data, and we find out that the epidemic would reduce the number of activities people do outside and increase the amount of time they spend at home, which would make the economy worse. Furthermore, we try to forecast GDP based on the data in the previous 40 years using the VAR model. The results show that the predictions of GDP are deviated. The reasons behind could be the inaccuracy of data or omitted variable bias, which could help improve the precision of future research.
References
[1]. Rodeck, D. (2022) What Is A Recession? Forbes. Retrieved from https://www.forbes.com/advisor/investing/what-is-a-recession/
[2]. Hlavka, J. and Rose, A. (2023) COVID-19’s Total Cost to the U.S. Economy Will Reach $14 Trillion by End of 2023. The Conversation. Retrieved from https://healthpolicy.usc.edu/article/covid-19s-total-cost-to-the-economy-in-us-will-reach-14-trillion-by-end-of-2023-new-research/
[3]. Rodousakis, N. and Soklis, G. (2022) The Impact of COVID-19 on the US Economy: The Multiplier Effects of Tourism. Economies, 10(1),2.
[4]. FRED Economics Data. St. Louis Federal Reserve. Retrieved from https://fred.stlouisfed.org/
[5]. Chen J., Vullikanti, A., Santos, J. et al. (2021) Epidemiological and Economic Impact of COVID-19 in the US. Sci Rep 11, 20451.
[6]. COVID-19 Community Mobility Reports. (2022) Google. Retrieved from https://www.google.com/covid19/mobility/
[7]. COVID-19 Case Data. CSSE at Johns Hopkins University. https://github.com/CSSEGISandData/COVID-19/tree/master/csse_covid_19_data/csse_covi4d_19_daily_reports
Cite this article
Gao,Y. (2023). Economic Recession Forecasts Using Machine Learning Models Based on the Evidence from the COVID-19 Pandemic. Advances in Economics, Management and Political Sciences,54,115-121.
Data availability
The datasets used and/or analyzed during the current study will be available from the authors upon reasonable request.
Disclaimer/Publisher's Note
The statements, opinions and data contained in all publications are solely those of the individual author(s) and contributor(s) and not of EWA Publishing and/or the editor(s). EWA Publishing and/or the editor(s) disclaim responsibility for any injury to people or property resulting from any ideas, methods, instructions or products referred to in the content.
About volume
Volume title: Proceedings of the 2nd International Conference on Financial Technology and Business Analysis
© 2024 by the author(s). Licensee EWA Publishing, Oxford, UK. This article is an open access article distributed under the terms and
conditions of the Creative Commons Attribution (CC BY) license. Authors who
publish this series agree to the following terms:
1. Authors retain copyright and grant the series right of first publication with the work simultaneously licensed under a Creative Commons
Attribution License that allows others to share the work with an acknowledgment of the work's authorship and initial publication in this
series.
2. Authors are able to enter into separate, additional contractual arrangements for the non-exclusive distribution of the series's published
version of the work (e.g., post it to an institutional repository or publish it in a book), with an acknowledgment of its initial
publication in this series.
3. Authors are permitted and encouraged to post their work online (e.g., in institutional repositories or on their website) prior to and
during the submission process, as it can lead to productive exchanges, as well as earlier and greater citation of published work (See
Open access policy for details).
References
[1]. Rodeck, D. (2022) What Is A Recession? Forbes. Retrieved from https://www.forbes.com/advisor/investing/what-is-a-recession/
[2]. Hlavka, J. and Rose, A. (2023) COVID-19’s Total Cost to the U.S. Economy Will Reach $14 Trillion by End of 2023. The Conversation. Retrieved from https://healthpolicy.usc.edu/article/covid-19s-total-cost-to-the-economy-in-us-will-reach-14-trillion-by-end-of-2023-new-research/
[3]. Rodousakis, N. and Soklis, G. (2022) The Impact of COVID-19 on the US Economy: The Multiplier Effects of Tourism. Economies, 10(1),2.
[4]. FRED Economics Data. St. Louis Federal Reserve. Retrieved from https://fred.stlouisfed.org/
[5]. Chen J., Vullikanti, A., Santos, J. et al. (2021) Epidemiological and Economic Impact of COVID-19 in the US. Sci Rep 11, 20451.
[6]. COVID-19 Community Mobility Reports. (2022) Google. Retrieved from https://www.google.com/covid19/mobility/
[7]. COVID-19 Case Data. CSSE at Johns Hopkins University. https://github.com/CSSEGISandData/COVID-19/tree/master/csse_covid_19_data/csse_covi4d_19_daily_reports