


1. Introduction
It is widely known that China has made huge economic progress over the past decades, and its population played an important role in it. However, the birth rate in China has also declined significantly in the past few decades, especially in recent years. Low fertility intention and delaying childbearing due to steadily rising living expenses were the main reasons for the fertility decline, even though the COVID-19 pandemic was one of the causes. The problems caused by the declining fertility rate have already attracted the attention of sociologists and statisticians more than a decade ago. Our country has implemented family planning policies, which have achieved great success in reducing the fertility rate and keeping the population at a sustainable level. However, the long-term application of these policies has also resulted in certain additional issues, such as the tilt of the population structure towards the elderly and the challenge of providing for them. Therefore, raising the birth rate has become an urgent matter for the government and society nowadays. The birth rate is a crucial demographic indicator that influences population dynamics and has significant implications for both social and economic planning.
Based on the background analysis above, we could discover that China is currently facing serious aging and fertility problems. According to the latest Statistics, by the end of 2022, the fertility rate in China will be less than 2%. Serious fertility problems affect more than China’s long-term economic growth. For the whole of society, they affect all aspects of people’s livelihood. Firstly, understanding the birth rate has profound implications for social policies, infrastructure planning, and economic development. Secondly, modelling and predicting the birth rate could help policymakers understand how severe the situation will be in the future and prepare for it. Thirdly, China's birth rate has been significantly influenced by government policies, such as the One-Child, Two-Child and Three-Child Policies. Therefore, analyzing the impact of these policies could guide future legislation and population control methods.
Therefore, we obtained the dataset from Health Nutrition and Population Statistics on Databank, which contained the historical data on China’s birth rate from 1960 to 2021. We have discovered that the Great Leap Forward Campaign played a significant role in the key fluctuation in the birth rate data around 1962. The Great Leap Forward aimed to achieve industrialization and collectivization rapidly. However, the campaign caused severe three-year natural disasters in the first three years starting from 1960, and the birth rate in our country has dropped significantly. The birth rate began to recover after three years of natural disasters. Finally, we chose the more stable birth rate data in China after 1963.
To create a short-term projection for the future, we propose to apply the ARIMA and Exponential smoothing models to historical data on the birth rate in China from 1964 to 2021. The data will be split into training and testing sets for model fitting and accuracy evaluation. While the testing set gauges how well the model predicts the data and the training set matches the data. Firstly, we would like to make some transformations to these original data to make the times series of the transformed data look stationary, which helps us conduct further research on these transformed data. The purpose of this experiment is to forecast the birth rate for the most recent five years by analyzing historical data from the past fifty-five years. As a result, the training set would be the fertility rate data from 1964 to 2016, and the testing set would be the fertility rate data from 2017 to 2021. Secondly, we would apply the ARIMA model and ETS model, respectively, to the transformed birth rate data within the training set, and we would predict the birth rate within the testing set.
Additionally, we would create time series plots for two models that were each applied to data on fertility rates throughout the entire period. We would compare the RMSE values of the two models to decide which model is more appropriate to make a short-term forecast for the future. In addition, the model would also be used to predict China's birth rate in the following 5 years since 2021.
The first part of the rest of this paper was the Literature review. We reviewed lots of literature about China’s birth rate and gained a basic understanding of the current situation in China. We also reviewed some literature about the appropriate model for forecasting the birth rate data to help us choose better prediction models. The second part was the Methodology. We introduced the origin of our dataset and how our data were processed to make our time series stationary. We also compared two different models and chose the better model to calculate the fertility rate in China over the next few years. The third part was the Results. We concluded our results about the fertility rate prediction in China in the following 5 years. The fourth part was the Discussion. We integrated our research procedures and summarized our research findings, we analyzed the similarities and dissimilarities of the forecast results by two different models. We also summed up the limitations of our project, which should be considered further. The Conclusion was the final part of our research paper. In addition, References were also included and listed on the final page.
2. Literature Review
The paper indicated that the problems brought about by the declining birth rate in China started to concern some sociologists and statisticians over a decade ago. They suggested that China’s family planning policy designed to reduce its birth rate so that the country’s population was kept at a sustainable level greatly succeeded. However, they countered that long-term implementation of these policies led to issues including a change in the population distribution towards the old and a rise in the cost of caring for that elderly population [1].
The research also indicated that the problem of aging has become more and more serious, although the two-child policy was released in 2015. The birth rate in China has kept a downward trend in the ten years from 2010 to 2020. He argued that factors such as household income and divorce rate had a significant influence on the fertility rate. Factors such as economic downturns and instability of the employment situation would lead to serious aging problems, which would inhibit the expectation of sustainability of development in China, which made China lag behind the developed countries further [2].
Others indicated that the birth rate in China showed a significant decrease from that in 2016, considered the lowest fertility rate since the 1960s. The decrease in fertility rate would cause changes in the demographic structure since the proportion of aging people would increase. They argued that the demographic dividend had mainly supported the continuous growth and prosperity of the economy in China. A slowdown in the economy would occur as the proportion of seniors increased. The economic downturn would cause shortages in labour and skills, leading to development stagnation and loss of vitality in society. They suggested that one of the important reasons for the fertility rate decline was that people generally changed their minds about marriage. In recent years, more and more adults, especially in urbanized regions, are more inclined towards fewer marriages and children [3].
Besides, other researchers indicated that the ARIMA models had been widely used in modelling and forecasting population variables since 1970, showing high efficiency in many different knowledge fields in demography. They suggested that many studies used the ARIMA models to calculate future fertility rates, which contributes to predicting future populations [4]. The paper reported that they examined the birth rate data in the US by using the ARIMA model since ARIMA methods could reveal the intricate structures of momentary interdependence in time series. They suggested that the ARIMA models succeeded in analyzing the patterns of seasonal interdependence in the birth rate series, which provides a basis for developing an alternative method of seasonal modification of dynamic demographic statistics [5].
According to the article, modelling and forecasting the changes in the birth rate over time are crucial since they offer crucial information for decisions on birth control, family planning, and welfare policies. They argued that finding effective models for demographic statistics, like the birth rate of a developing country, can be challenging due to the complexity of factors involved. The ARIMA models make use of the autocorrelations of the data, while exponential smoothing or the ETS models make use of the weighted averages of past observations. They recommended using the ARIMA and exponential smoothing models for fertility rate prediction since these two models are the most frequently employed in time series forecasting [6].
Some researchers indicate that the major area of interest of demographers is modelling birth rate curves to understand the fertility pattern. To anticipate the future fertility rate, people typically use prediction models, including the ARIMA and exponential smoothing models. The ARIMA models are the most commonly used forecast models because of their simplicity. They argue that the ARIMA models are usually utilized for time series prediction, which aims to identify the stochastic process and forecast future values. The ETS models minimize historical birth rates by assigning an exponentially decreasing birth rate compared to the historical data. The multiplicative trend analysis gives exponential trend analysis, while the additive trend analysis provides linear trend analysis. They suggested that the ARIMA and ETS models had low marginal error rates in the long-term fertility prediction. However, the ARIMA models have been proven to be more accurate in fertility prediction since it has a lower accuracy measure error [7].
3. Methodology
3.1. Data Description
Health Nutrition and Population Statistics on Databank provided the dataset for analysis.
The dataset is expressed annually. The variable is the birth rate (per 1,000 people) in China within the period of over 61 years (from 1960 to 2021)( Figure 1). All variables are discrete numerical data. When choosing data, we found a critical fluctuation in the birth rate data around 1962. According to our research, we could explain this situation caused by the Great Leap Forward (from 1958 to 1962) and the Three Years of Great Chinese Famine (from 1959 to 1961).
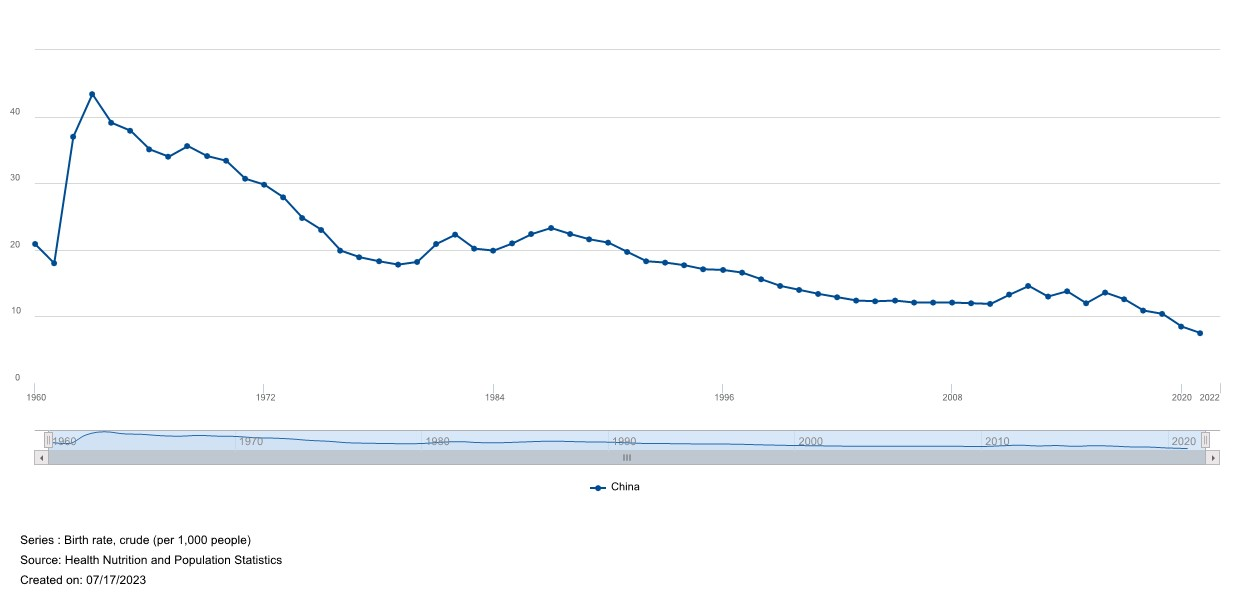
Figure 1: Time Series Plot for Birth Rate in China (1960-2021).
Note: data from: https://databank.worldbank.org/source/health-nutrition-and-population-statistics? l=en#.
The Great Leap Forward was a campaign to rapidly transform China from a primarily agrarian society into a socialist industrial society through rapid industrialization and collectivization. However, the campaign led to a wide range of severe social and economic upheavals. One of these upheavals was the so-called Three Years of Great Chinese Famine, a period of severe economic distress and famine.
The birth rate in China significantly fluctuated during and after these events. Due to extensive. starvation and malnutrition brought on by the Great Leap Forward and the ensuing famine, the birth rate dramatically declined while the mortality rate sharply rose.
In 1960, at the height of the famine, the birth rate reportedly dropped to about 14 per thousand. from around 20 per thousand in the pre-Great Leap Forward period. In 1962, as the policies of the Great Leap Forward were reversed, the famine began to ease, and the birth rate started to recover. However, the recovery was slow and uneven due to the lingering effects of the famine and the socio-economic disruptions caused by the Great Leap Forward. Finally, we chose the more stable birth rate data in China from 1964 to 2021.
3.2. Data Processing
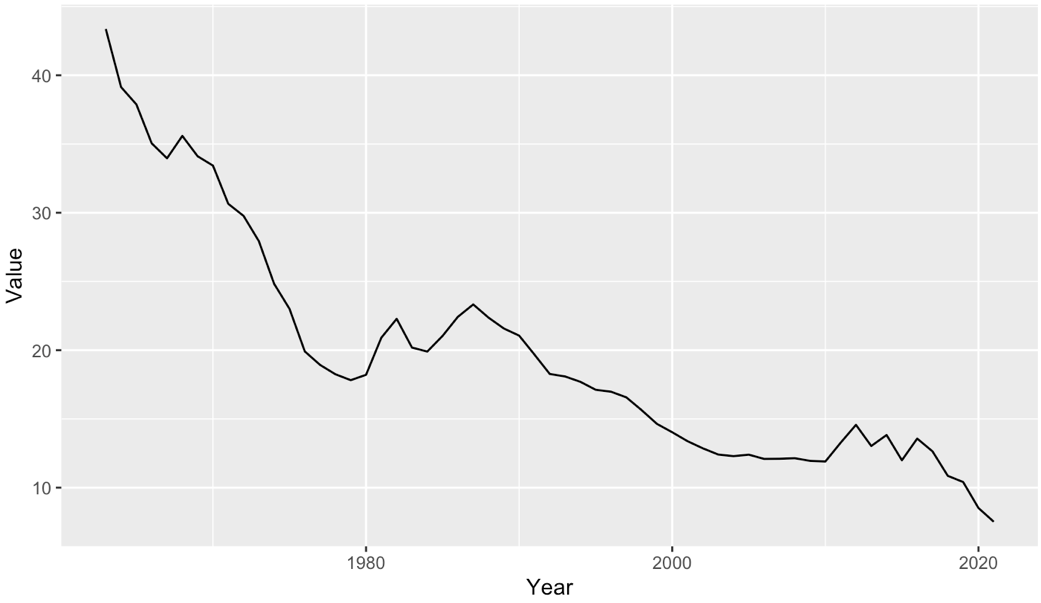
Figure 2: Time Series Plot for Birth Rate in China (1964-2021).
From Figure 2, there is a decreasing trend for the time series of the birth rate in China. We could conclude that this series is non-stationary. A stationary time series maintains its characteristics like mean and variance over time. In other words, it doesn't exhibit trends or seasonality. Many statistical models, such as ARIMA, assume that the underlying data are stationary because these models are designed to predict the constant mean, variance, and autocorrelation structure in the data.
On the other hand, non-stationary time series often contain trends or seasonal patterns. The mean, variance, or correlation structure may change over time, which makes the data harder to model. If these properties are changing, the patterns that the model learns may not apply to future periods. To illustrate, stationarity is a critical property for time series data that many statistical modelling techniques require [8].
To obtain the stationary time series, we decided to make some transformations for these data:
Firstly, transform data of average birth rate to the growth rate for each year compared with. the previous year.
Then, compute the growth factor to standardize the mean of the series by reducing the variation, where the growth factor is equal to the growth rate plus one.
Then, take the logarithm of the growth factor to make the time series of birth rate data stationary.
Finally, differentiate the birth rate data to standardize the data further if needed.
Table 1: Birth Rate Values and Calculation Data related to Birth Rate Values for each year in China since 1960.
Year | Value | Year Difference | Value Difference | Growth Rate | Growth Factor |
1960 | 20.86 | NA | NA | NA | NA |
1961 | 18.02 | 1 | -2.84 | -0.1361457335 | 0.8638543 |
1962 | 37.01 | 1 | 18.99 | 1.0538290788 | 2.0538291 |
1963 | 43.37 | 1 | 6.36 | 0.1718454472 | 1.1718454 |
1964 | 39.14 | 1 | -4.23 | -0.0975328568 | 0.9024671 |
1965 | 37.88 | 1 | -1.26 | -0.0321921308 | 0.9678079 |
1966 | 35.05 | 1 | -2.83 | -0.0747096093 | 0.9252904 |
1967 | 33.96 | 1 | -1.09 | -0.0310984308 | 0.9689016 |
1968 | 35.59 | 1 | 1.63 | 0.0479976443 | 1.0479976 |
1969 | 34.11 | 1 | -1.48 | -0.0415847148 | 0.9584153 |
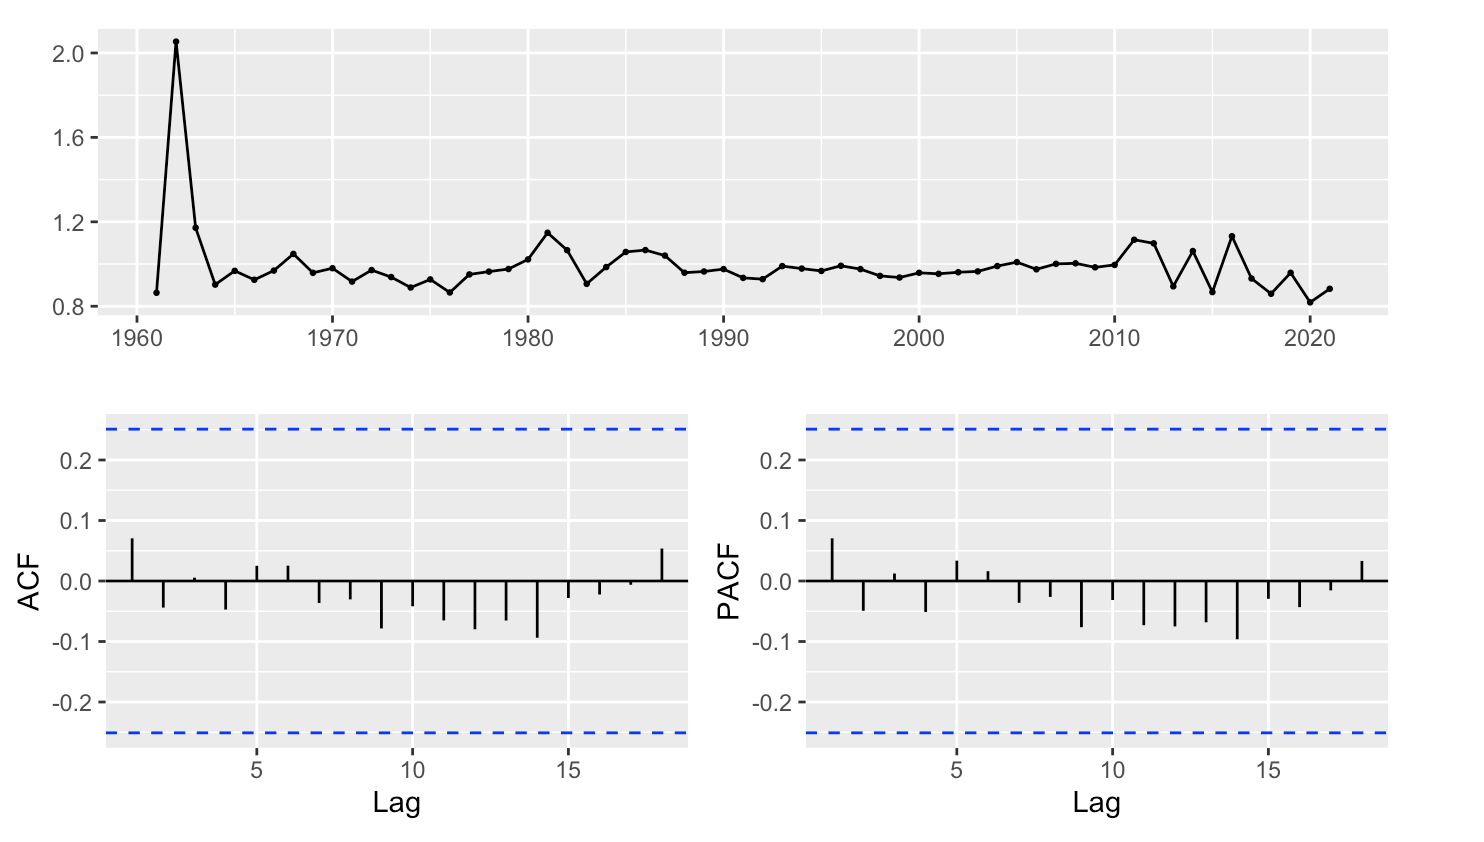
Figure 3: Time Series Plot for Growth Factor of Birth Rate.
Results after computing the growth rate and the growth factor
Table 1. above shows the birth rate values and calculation data related to birth rate values for each year in China since 1960. To better visualize and understand the data, Figure 3 shows how the growth factor of the birth rate in China has changed over time. Using the Augmented Dickey-Fuller Test, the p-value we calculated was 0.3453, higher than the 5% significance level. Therefore, we failed to reject the null hypothesis and concluded that the time series was not stationary(Figure 4).
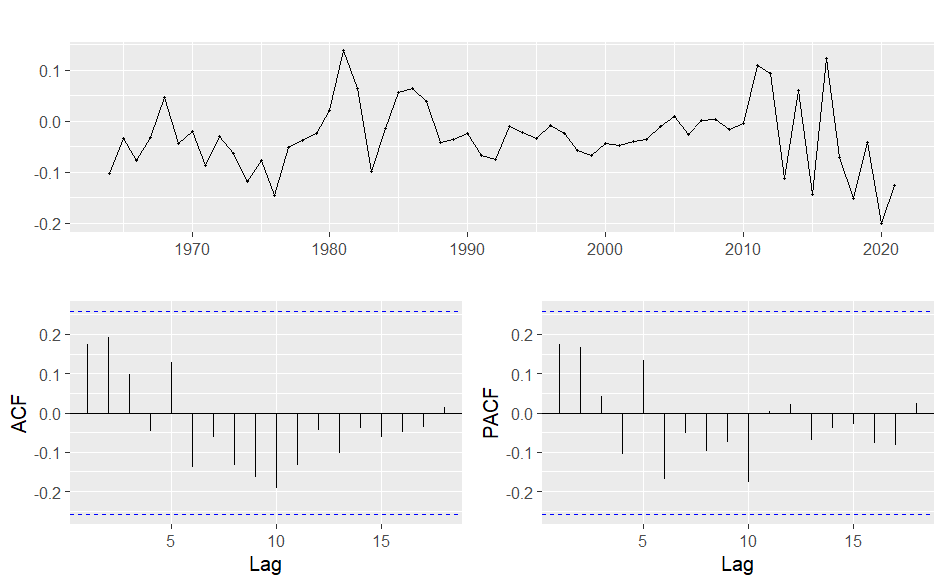
Figure 4. Time Series Plot for Log-Growth Factor of Birth Rate.
Results after logarithm transformation
To better stabilize the variance of a time series, we are aiming to perform a logarithm. transformation on the growth factor. It is particularly helpful that taking the logarithm of the data could help linearize the time series when it displays exponential growth or decay. The p-value we calculated using the Augmented Dickey-Fuller Test was 0.359, greater than the 5% significance level [9]. Consequently, we could not reject the null hypothesis and concluded that the time series was not stationary. Logarithm transformation has not been successful in further normalizing growth factor data, which prevented the time series from becoming stationary(Figure 5).
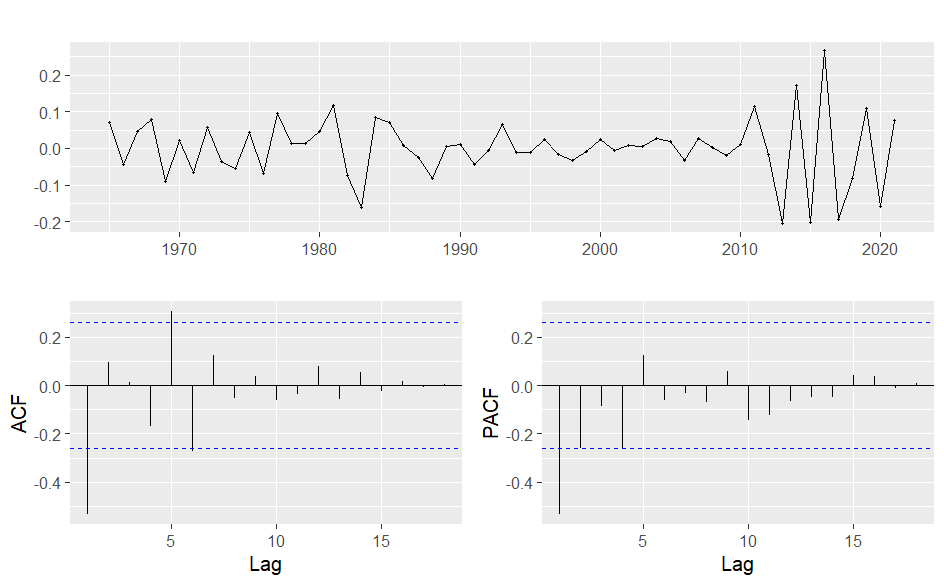
Figure 5: Time Series Plot for Differenced Log-Growth Factor of Birth Rate.
Results after differencing
By deducting the prior observation from the present observation, we attempted to differentiate the data to make the time series statistically stable. The p-value we calculated using the Augmented Dickey-Fuller Test was 0.01, lower than the 5% significance level. As a result, the null hypothesis might be rejected, and we could conclude that the time series was stationary. Since the transformed data time series was stationary based on the Augmented Dickey-Fuller Test, the log-transformed growth factor of birth rate data after one differencing is the optimum data to carry out our research further [10].
3.3. Data Partitioning
The transformed data was partitioned into two sets - the training set, which was used to fit the. data, and the testing set, which was used to test the accuracy of the models’ forecasts. The data from 1964 to 2016 was chosen as the training set, and the data from 2017 to 2021 was chosen as the testing set.
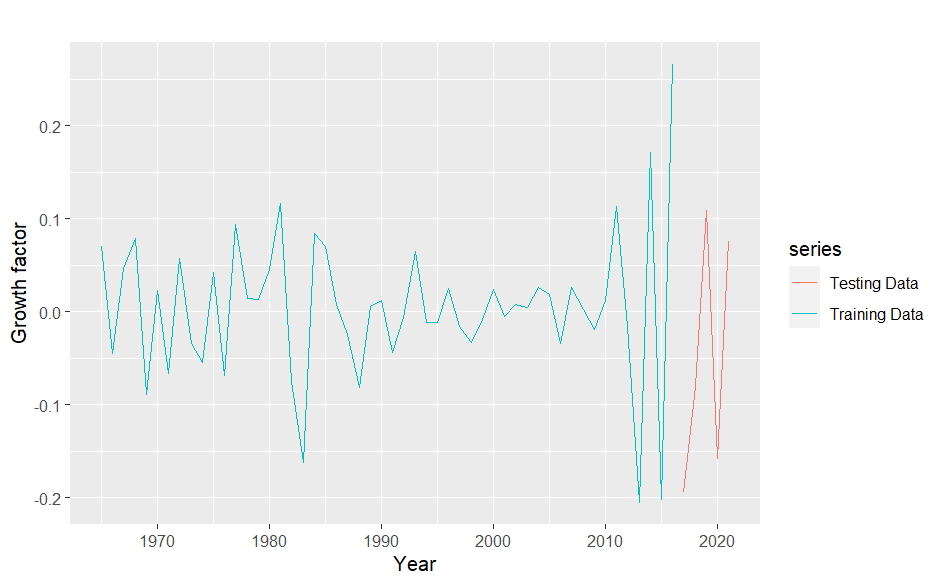
Figure 6: Times series plots of Training and Testing set for Differenced Log-Growth Factor of Birth Rate.
3.4. ARIMA Model
3.4.1. Model Description
In this instance, ARIMA modelling and forecasting were performed using the auto-arima() function in R. According to the paper, the auto.arima() function in R reportedly employs a different version of the Hyndman-Khandakar algorithm[8]. Researchers argue that the auto.arima() function creates an ARIMA model by combining unit root testing, AICc minimization and MLE[11]. The ARIMA(0,0,1) model with zero means was the one produced by the auto.arima() function, where 0, 0, and 1 stand for the order of the autoregressive model, the degree of differencing, and the order of the moving-average model, respectively. In other words, the R function automatically determined a first-order moving average model.
3.4.2. Accuracy Test
Based on the training set, the ARIMA model was used to forecast the years in the testing set. Figure 7 shows the forecasts from the ARIMA (0,0,1) model. The accuracy was tested using the accuracy() function in R. The results are summarized in Table 2.
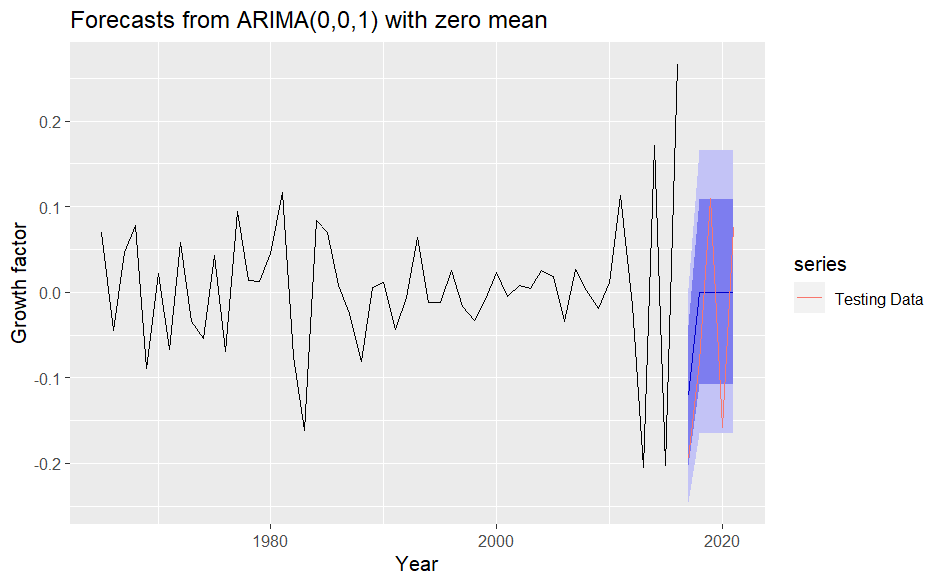
Figure 7: Forecasts from ARIMA(0,0,1) Model.
Table 2: Summary for the ARIMA(0,0,1) Model Accuracy Test.
ME | RMSE | MAE | MPE | MAPE | MASE | |
Training Set | 0.00959091 | 0.06300125 | 0.04647275 | 97.99229 | 166.40961 | 0.5295333 |
Testing set | 0.02557882 | 0.10455979 | 0.09956321 | 87.60218 | 87.60218 | 1.1344721 |
3.5. ETS Model
3.5.1. Model Description
The ets() function in R was used to automatically choose the appropriate taxonomy and constants of the model. The taxonomy characterizes each model in three dimensions: error, trend, and seasonality. The paper suggested that those three dimensions could be classified as ‘additive,’ ‘multiplicative,’ or ‘none’ [12]. Under this circumstance, the ETS(A, N, N) model standing for simple exponential smoothing with additive errors, was automatically selected. The smoothing parameter α equals 10-4, which is approximately 0. The study suggests that the level of the series remains constant over time if α = 0 [11].
3.5.2. Accuracy Test
Based on the training set, the ETS model was used to predict the years in the testing set. Figure 8 displays the predictions from the ETS(A, N, N) model. The accuracy was also evaluated using the accuracy() function in R. The result is summarized in Table 3.
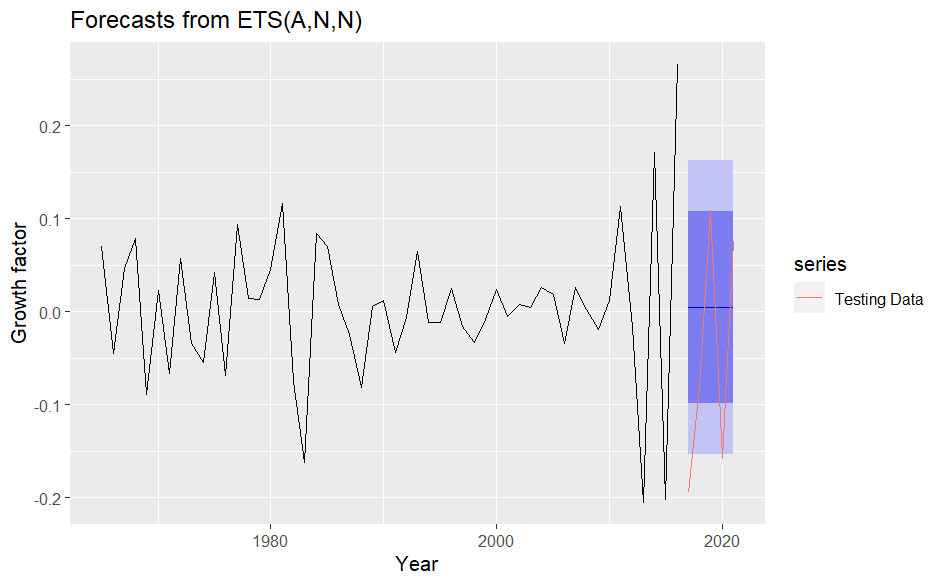
Figure 8: Forecasts from ETS(A, N, N) Model.
Table 3: Summary of the ETS(A, N, N) Model Accuracy Test.
ME | RMSE | MAE | MPE | MAPE | MASE | |
Training Set | -2.318538*10-6 | 0.07921507 | 0.05447984 | 93.82874 | 97.06349 | 0.6207701 |
Testing set | -5.408744*10-2 | 0.13370538 | 0.12458407 | 100.12727 | 100.12727 | 1.4195721 |
3.6. Five-year Forecasts Using ARIMA(0,0,1) Model
The accuracy tests for both models above clearly show the RMSE values for both training and testing sets. The ARIMA model clearly shows that the RMSE value in the training set is 0.063, while it is approximately 0.105 in the testing set. In the ETS model, we can see that the RMSE value in the training set is around 0.08, while it is nearly 0.134 in the testing set.
The error measure used to determine which model to use to make the forecast was the root mean square error(RMSE), calculated by the formula:
\( {e_{t}}={y_{t}}-\hat{{y_{t}}} \) (1)
\( RMSE=\sqrt[]{ \frac{1}{n}\sum _{t=1}^{n}{{e_{t}}^{2}}} \) (2)
The ARIMA(0,0,1) model has a lower RMSE value, according to the accuracy test results for both models. Therefore, ARIMA(0,0,1) is a more accurate model for predicting the birth rates in China over the next five years. The training set is the same as when evaluating the models. The forecasts for 5 years are shown in Table 4 and Figure 9.
Table 4: A five-year forecast of the birth rate in China using the ARIMA(0,0,1) Model.
Point Forecast | Lower 80% CI | Upper 80% CI | Lower 95% CI | Upper 95% CI | |
2022 | 0.0000000 | -0.1079529 | 0.1079529 | -0.1650997 | 0.1650997 |
2023 | 0.0000000 | -0.1079529 | 0.1079529 | -0.1650997 | 0.1650997 |
2024 | 0.0000000 | -0.1079529 | 0.1079529 | -0.1650997 | 0.1650997 |
2025 | 0.0000000 | -0.1079529 | 0.1079529 | -0.1650997 | 0.1650997 |
2026 | 0.0000000 | -0.1079529 | 0.1079529 | -0.1650997 | 0.1650997 |
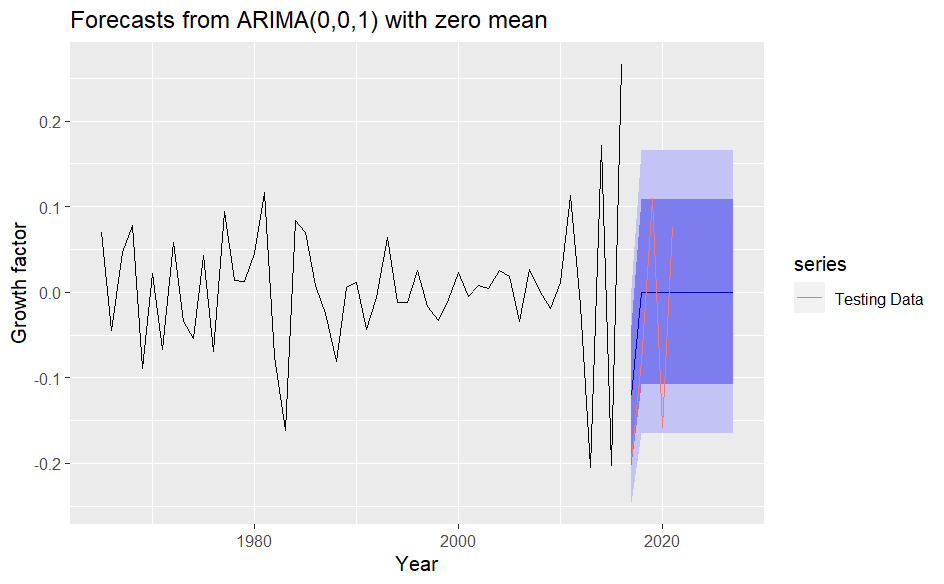
Figure 9: 5-Year Forecast using ARIMA(0,0,1) Model.
4. Results
According to our forecast using the ARIMA (0,0,1) model, Figure 6 above shows that the values are 0 in the `point forecast` column from 2022-2026. These data demonstrate that the difference between the growth factor from year to year would be 0 for 2022 - 2026. Therefore, the growth factor would equal the value in 2021 for years 2022 - 2026, which is 0.8826291. Since the growth rate is equal to the growth factor minus one, the growth rate in China from 2022-2026 equals 0.883 - 1 = -0.117. This means that the birth rate in China will continuously decrease at a rate of 0.117 each year for the years 2022 - 2026. Therefore, China will face a difficult situation of continuous fertility rate decline in the next five years, even in the future [13].
5. Discussions
Since the original birth rate data was not stationary, we made some transformations on the original data to make the time series stationary. Then, we compared the ARIMA model and the ETS model to decide which model is more suitable for predicting the fertility rates of China. Finally, we decided to use the ARIMA model to forecast the fertility rates of China in the following five years since 2021. From the forecasts using the ARIMA model and the ETS model, we can see that the time series plots of these two models have similar trends. After we applied these two models to the training set, we found that the time series plots on the training set have approximately the same trends. The testing set using the ETS model predicted a constant growth rate of birth rate from 2017 to 2021. However, the prediction using the ARIMA model showed that the growth rate of birth rate had an increasing trend firstly, then became a constant value in the last 5 years. Both models predicted a constant growth rate of birth rate in China from 2022 to 2026. We could deduce from the accuracy tests of these two models that the ARIMA model had a lower RMSE value than the ETS model. We also found that compared to the ETS model, the MAE and MASE values for the ARIMA model were lower.
Additionally, the ARIMA model outperformed the ETS model regarding AIC and BIC values. Nevertheless, unlike the ARIMA model, the ETS model had a smaller ME value. The residuals from the ETS model had a substantially smaller p-value than the ARIMA model.
However, our project has some limitations, which make the project not perfect enough and need to be improved in the future. We only compared the RMSE values in the training and testing sets between the ARIMA and the ETS model. Although RMSE value is the most important factor in determining a better model between two models, we should also consider other values, such as AIC and BIC values. Moreover, the residuals from the ARIMA model were not consistent with the white noise since their p-value was significantly greater than that estimated from the ETS model. Furthermore, although the ARIMA model is better than the ETS model, it may not be the best model for forecasting future birth rates. We only chose the ARIMA and the ETS models in our project since we used them most of the time in our course and knew much about them. However, we did not compare these two models with other models due to limitations to the knowledge and usage of other models.
6. Conclusions
Through the data processing, we finally conclude that the log-transformed growth factor of original birth rate data after one differencing is the best data to use since its p-value is significantly smaller than the significance level at 5%, which makes our time series stationary. We have applied the ARIMA and the ETS model, respectively, in our training set of the birth rate data. According to the accuracy test results, the ARIMA(0,0,1) model is a more appropriate model for forecasting the birth rates in China in the future. According to our forecast by ARIMA(0,0,1) model, the difference between the growth factor from year to year would be 0 in the following 5 years from 2022. We conclude that the birth rate in China will decrease at a constant rate of 0.117 each year in these five years. Therefore, the fertility rate in China is now facing an unprecedented crisis. Our future research direction may probably focus on what kinds of social or economic factors would affect the birth rate. We would probably search for several articles or journals on relevant academic websites about the related factors affecting the fertility rate. Then, we would conduct an in-depth study on how these factors could affect changes in the fertility rate. We would extract datasets from the relevant websites and analyze the relationship between these related factors and the birth rate, which could be calculated using time series models in R studio. We would use the best time series model to forecast the changes in the birth rate when there are any changes in these related factors. Finally, we would also conduct research on what measures we would take to improve the situation of the low fertility rate in China in the future. We would consult academic literature on how government policies, such as maternity benefits or welfare measures, could help ameliorate the low fertility rate crisis. These academic materials could better help us learn about the causes of the low fertility rates and propose better solutions to reverse the current circumstance of the low fertility rate in our country.
References
[1]. Cao, S., and Wang, X. “Dealing with China’s Future Population Decline: A Proposal for Replacing Low Birth Rates with Sustainable Rates.” Journal of Biosocial Science, vol. 41, no. 5, 2009, pp. 693-696.
[2]. He, Y. “Research on influencing factors of birth rate in China.” Second International Conference on Statistics, Applied Mathematics, and Computing Science (CSAMCS 2022), 125971D, 2023.
[3]. Lucero‐Prisno, D.E. et al. “The challenges of the low birth rate in China.” Public Health Challenges, vol. 1, no. 2, 2022.
[4]. Auda, H., and Attia, H. “Comparative Arima models for age-specific fertility rates.” Advances and Applications in Statistics, vol. 51, no. 5, 2017, pp. 367-388.
[5]. Land, K.C., and Cantor, D. “Arima models of seasonal variation in U.S. birth and death rates.” Demography, vol. 20, no. 4, 1983, pp. 541.
[6]. Hyndman, R. J., and Athanasopoulos, G. Forecasting: principles and practice. 2nd ed., OTexts, 2018.
[7]. Anuj Kumar and Bhupendra Meena. “Comparative analysis of the time series ARIMA model over the AR, MA, and Holt's models for future prediction of total fertility rate in India.” The Pharma Innovation Journal, vol. 12, no. 7, 2023, pp. 912-920.
[8]. Hyndman, R. J., and Khandakar, Y. “Automatic Time Series Forecasting: The forecast Package for R.” Journal of Statistical Software, vol. 27, no. 3, 2008, pp. 1–22.
[9]. Wei, Y. et al. “Predicting population age structures of China, India, and Vietnam by 2030 based on compositional data.” PLoS One, vol. 14, no. 4:e0212772, 2019.
[10]. Karunanidhi, D., and Sasikala, S. “Robustness of Predictive Performance of Arima Models Using Birth Rate of Tamilnadu.” Journal of Statistics Applications & Probability, vol. 12, no. 3, 2023, pp. 1189-1201.
[11]. Jain, G., and Mallick, B. “A study of time series models ARIMA and ETS.” 2017. . Available at SSRN 2898968.
[12]. Hasan, N. I. A. et al. “Projection of Infant Mortality Rate in Malaysia using R.” Jurnal Sains Kesihatan Malaysia, vol. 20, no. 2, 2022, pp. 23-36.
[13]. Yang, S., Jiang, Q. and Jesús S.J. “China’s fertility change: an analysis with multiple measures.” Population health metrics, vol.20, no. 1, 2022.
Cite this article
Wang,Y. (2023). Analysis of China’s Birth Rate Prediction Based on Time Series. Advances in Economics, Management and Political Sciences,55,205-217.
Data availability
The datasets used and/or analyzed during the current study will be available from the authors upon reasonable request.
Disclaimer/Publisher's Note
The statements, opinions and data contained in all publications are solely those of the individual author(s) and contributor(s) and not of EWA Publishing and/or the editor(s). EWA Publishing and/or the editor(s) disclaim responsibility for any injury to people or property resulting from any ideas, methods, instructions or products referred to in the content.
About volume
Volume title: Proceedings of the 2nd International Conference on Financial Technology and Business Analysis
© 2024 by the author(s). Licensee EWA Publishing, Oxford, UK. This article is an open access article distributed under the terms and
conditions of the Creative Commons Attribution (CC BY) license. Authors who
publish this series agree to the following terms:
1. Authors retain copyright and grant the series right of first publication with the work simultaneously licensed under a Creative Commons
Attribution License that allows others to share the work with an acknowledgment of the work's authorship and initial publication in this
series.
2. Authors are able to enter into separate, additional contractual arrangements for the non-exclusive distribution of the series's published
version of the work (e.g., post it to an institutional repository or publish it in a book), with an acknowledgment of its initial
publication in this series.
3. Authors are permitted and encouraged to post their work online (e.g., in institutional repositories or on their website) prior to and
during the submission process, as it can lead to productive exchanges, as well as earlier and greater citation of published work (See
Open access policy for details).
References
[1]. Cao, S., and Wang, X. “Dealing with China’s Future Population Decline: A Proposal for Replacing Low Birth Rates with Sustainable Rates.” Journal of Biosocial Science, vol. 41, no. 5, 2009, pp. 693-696.
[2]. He, Y. “Research on influencing factors of birth rate in China.” Second International Conference on Statistics, Applied Mathematics, and Computing Science (CSAMCS 2022), 125971D, 2023.
[3]. Lucero‐Prisno, D.E. et al. “The challenges of the low birth rate in China.” Public Health Challenges, vol. 1, no. 2, 2022.
[4]. Auda, H., and Attia, H. “Comparative Arima models for age-specific fertility rates.” Advances and Applications in Statistics, vol. 51, no. 5, 2017, pp. 367-388.
[5]. Land, K.C., and Cantor, D. “Arima models of seasonal variation in U.S. birth and death rates.” Demography, vol. 20, no. 4, 1983, pp. 541.
[6]. Hyndman, R. J., and Athanasopoulos, G. Forecasting: principles and practice. 2nd ed., OTexts, 2018.
[7]. Anuj Kumar and Bhupendra Meena. “Comparative analysis of the time series ARIMA model over the AR, MA, and Holt's models for future prediction of total fertility rate in India.” The Pharma Innovation Journal, vol. 12, no. 7, 2023, pp. 912-920.
[8]. Hyndman, R. J., and Khandakar, Y. “Automatic Time Series Forecasting: The forecast Package for R.” Journal of Statistical Software, vol. 27, no. 3, 2008, pp. 1–22.
[9]. Wei, Y. et al. “Predicting population age structures of China, India, and Vietnam by 2030 based on compositional data.” PLoS One, vol. 14, no. 4:e0212772, 2019.
[10]. Karunanidhi, D., and Sasikala, S. “Robustness of Predictive Performance of Arima Models Using Birth Rate of Tamilnadu.” Journal of Statistics Applications & Probability, vol. 12, no. 3, 2023, pp. 1189-1201.
[11]. Jain, G., and Mallick, B. “A study of time series models ARIMA and ETS.” 2017. . Available at SSRN 2898968.
[12]. Hasan, N. I. A. et al. “Projection of Infant Mortality Rate in Malaysia using R.” Jurnal Sains Kesihatan Malaysia, vol. 20, no. 2, 2022, pp. 23-36.
[13]. Yang, S., Jiang, Q. and Jesús S.J. “China’s fertility change: an analysis with multiple measures.” Population health metrics, vol.20, no. 1, 2022.