


1. Introduction
In the global economic landscape, China’s unparalleled presence and influence have transformative implications. From its evolution from a mainly agrarian society to becoming an industrial juggernaut, China’s journey reshapes the contours of international commerce. Today, as the world’s second-largest economy, China’s economic decisions, whether trade policies or massive undertakings like the Belt and Road Initiative, send waves across the world. Internally, China has witnessed profound changes. Urbanization, technology adoption, and a burgeoning service sector have overhauled its labor market. Cities like Beijing and Shanghai are now economic epicenters, and with these changes come fluctuations in employment rates and labor dynamics. Understanding the relationship between GDP growth and unemployment is a cornerstone of macroeconomics. Yet, China’s unique integration of socialism with capitalist shades makes this relationship particularly complex. Beyond numerical data, it’s essential to grasp how China’s cultural, policy, and regional factors modulate the GDP-unemployment dynamic.
Despite numerous studies on the GDP-unemployment relationship globally, research specifically tailored to China’s unique environment is surprisingly scarce. Okun’s law, often referenced in global economic studies, posits a clear inverse relationship between GDP growth and unemployment rates: as GDP increases, unemployment should theoretically decrease, and vice versa. Yet, in the context of China, the application and nuances of Okun’s law may differ due to its distinct socio-economic dynamics. It’s not just another economy; it’s a distinctive entity with its blend of cultural, political, and socio-economic intricacies. The rapid urbanization, diverse industrial landscape, and combination of socialism with market elements mean China defies conventional categorization. Current studies often fail to capture China’s evolving dynamics, viewing the GDP-unemployment relationship, and by extension, Okun’s law, in a static manner. This research’s motivation lies in decoding these intricate, often overlooked causality mechanisms within China, understanding how regional variations, policy decisions, and digital economic shifts impact this essential relationship and the validity of Okun’s theory within this specific context. To navigate this intricate relationship, we employ the Vector Autoregression (VAR) methodology. Its design, focusing on past values to predict future outcomes, makes it ideal to unravel the interdependencies between China’s GDP and unemployment.
2. Literature Review
2.1. Theoretical Foundations and Global Perspectives of Okun’s Law
The relationship between unemployment and economic output has been of considerable interest to scholars in the field of economics. One foundational premise of this relationship is Okun’s Law, which posits a stable negative relationship between unemployment and real output. Proposed by the American economist Arthur Okun, this law suggests that for every 1% increase in the unemployment rate, real output is approximately 3.2% lower than its potential [1].
2.2. Empirical Validations in Developed Countries
Recent research studies have provided diverse findings concerning the validity of this law. Studies focusing on developed countries largely validate Okun’s proposition. For instance, research on 16 OECD countries using panel data found that the Okun coefficient, though it varied according to method, was broadly consistent with Okun’s predictions [2]. Another study focusing on ten industrialized nations found Okun’s Law to hold but with the Okun coefficient dropping to 2% [3]. Moreover, an analysis at the U.S. state level concluded a negative relationship between unemployment and output, both regionally and nationally [4]. Sector-specific studies in developed countries further confirmed the law’s validity [5].
2.3. Challenges in Developing Countries
In contrast, empirical research on developing countries presents a more complicated picture. A study using data from four African countries found no statistically significant relationship between unemployment and economic growth [6]. Similarly, investigations in Macedonia failed to provide robust evidence supporting Okun’s Law [7]. The disconnect between unemployment and economic growth was also observed in Nigeria and some Asian developing countries [8].
2.4. China’s Unique Labor Dynamics and Okun’s Law
Turning to China, a rapidly urbanizing and developing nation, empirical research has yielded mixed results. While Zou and Hu’s research on China’s first and second industries supported Okun’s Law, the tertiary industry did not conform to the law’s predictions [9]. Cai’s research revealed no significant correlation between economic growth rate changes and unemployment rate shifts [10]. Other scholars further challenged the validity of Okun’s Law in China, suggesting that the cyclical nature of rural labor force migration played a critical role in understanding the urban unemployment-economic fluctuation relationship [11].
2.5. The Chinese Phenomenon of Rural Labor Reservoir
A unique dynamic in China is the dual-directional migration pattern observed among rural laborers. As China’s urbanization accelerates, surplus rural laborers increasingly migrate to urban centers. However, due to institutional constraints like the hukou system, these migrants don’t have permanent residency rights in the cities and cannot access equal social welfare benefits. Consequently, when external economic shocks trigger urban unemployment, many of these migrant workers return to rural areas, resulting in massive reverse migration waves. Essentially, the countryside acts as a labor reservoir, absorbing backflow labor during urban unemployment surges. Thus, unemployment isn’t truly reduced; it merely shifts back to rural regions [12].
2.6. Reassessing Okun’s Law in Evolving Economies
Hence, while Okun’s Law garners notable validation in developed nations, its pertinence in developing countries, particularly in China, warrants scrutiny. The complexities of labor migration, especially in dual-economic structured countries like China, challenge the direct application of Okun’s Law [13]. Given the pivotal relationship between GDP and unemployment, it is imperative to delve deeper into this association, especially as economies evolve. This significance underpins the rationale for this research, seeking to illuminate the nuanced interplay between unemployment and economic output across varied national landscapes.
3. Methodology
The employed methods were underpinned by a deliberate and judicious blend of empirical techniques: the Granger causality test and the Vector Autoregression (VAR) model, both of which were operationalized using the R statistical software. This combination, albeit appearing straightforward, was chosen for its empirical rigor and its established precedence in econometric research. The Granger causality test, in particular, is invaluable in discerning whether one time series can predict another, a foundational step in ascertaining causality. In this paper, the Granger causality test suggests whether the past GDP data could predict the future trend of the unemployment rate. The VAR model, on the other hand, provides a more comprehensive lens, allowing for an examination of the interdependencies and dynamic interactions between the GDP and unemployment rate, and thus reflecting on Okun’s coefficients.
The dataset, meticulously curated and spanning three decades from 1992 to 2022, was sourced from the esteemed National Statistical Bureau of China. Such a choice ensured that the data was not only of impeccable authenticity but also reflective of the broader economic trends and nuances specific to China. Given the longevity and depth of this dataset, it offers a temporal richness, capturing the evolutionary nuances of the Chinese economy over a transformative period. While the quantitative paradigm adopted in this study offers the precision and replicability inherent to numerical analyses, it necessitated a robust data processing regimen. The Granger test, with its emphasis on causality, required the alignment of data timelines, a step that ensured temporal consistency and chronological coherence. The VAR model demanded a deeper granularity, necessitating data normalization and validation processes. Herein, one of the preliminary challenges faced was ensuring that the vast expanse of data was both compatible with the chosen models and devoid of any anomalies or inconsistencies.
It is crucial, however, to juxtapose the methodological strengths with its inherent limitations. The simplicity of the two chosen models, while advantageous in terms of clarity and ease of interpretation, does not afford the intricate depth some multifaceted econometric models might offer. This simplicity could be perceived as a limitation, especially when one considers the complex economic landscape of China, marked by its dual economic structures, regional disparities, and sectoral shifts. While the methodology deployed in this research might be perceived as straightforward in its design, its foundational strength lies in its empirical rigor and clarity. As with any empirical endeavor, this methodology was guided by prior academic research, thus embedding this procedure within a continuum of scholarly dialogue and ensuring the approach’s academic reliability.
4. Results
4.1. Overall Trend
From 1992 to 2022, China experienced remarkable economic transformations, as evidenced by its significant GDP growth. In 1992, the GDP stood at a modest $426.92 billion, which by 2022 had catapulted to a staggering $17.96 trillion, marking an over 40-fold increase. This unparalleled economic ascent is indicative of China’s meteoric rise on the global stage. Contrastingly, the unemployment rate trend presents a rather different picture. Beginning at 2.628% in 1992, unemployment experienced fluctuations, peaking at 5.538% in 2021 before slightly retracting to 5.041% in 2022. Notably, the economic boom did not necessarily translate to consistent drops in unemployment. In certain instances, such as between 2003 and 2004, despite significant GDP growth, the unemployment rate rose, challenging traditional economic paradigms (Figure 1).
Hence, this divergent result brings us to Okun’s law, which postulates an inverse relationship between unemployment and GDP growth. Specifically, for many economies, an increase in GDP often corresponds to a decrease in the unemployment rate. However, in China’s context, this relationship doesn’t consistently align with Okun’s expectations [13]. For example, during periods of substantial GDP growth, such as 2012 to 2015, unemployment remained relatively stable instead of decreasing. Such deviations from Okuns’s law underscore the unique characteristics of China’s economic landscape. Influences like rapid urbanization, labor migration, regional economic disparities, and shifts from agriculture to service and industrial sectors might have affected the unemployment rate independently of GDP growth [14].
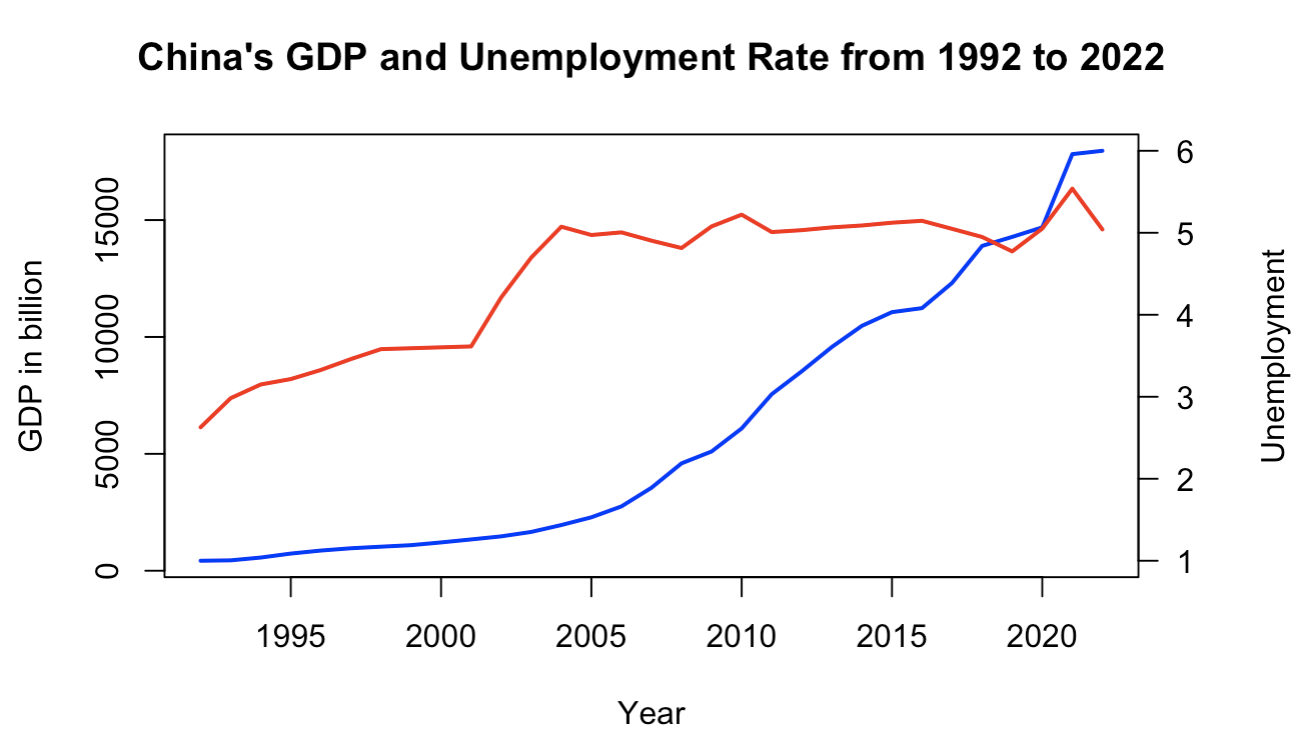
Figure 1: Trends of GDP in billion and unemployment in the past 30 years.
4.2. Granger Causality Test
Secondly, it is imperative to discern the interdependence between significant macroeconomic variables in the course of analysis. The Granger causality test offers a methodological avenue to understand such relationships, especially in the realm of forecasting one variable based on the past values of another. The Granger causality test is employed to ascertain whether China’s GDP from the years 1992 to 2022 could predict future values of the unemployment rate. Delving into the results, an F-statistic value of 4.8567 with an associated p-value of 0.01694 is resulted. The primary objective of the Granger causality test in this context is to determine if the historical values of GDP furnish any foresight regarding forthcoming movements in the unemployment rate. The p-value, being notably less than the conventional significance threshold of 0.05, prompts to rejection of the null hypothesis. This null hypothesis posits that GDP does not Granger cause the unemployment rate. Consequently, the empirical evidence, rooted in this data and the designated lag lengths, posits that past GDP figures from 1992 to 2022 indeed exert predictive influence over the unemployment rate during this epoch (Table 1).
Table 1: Results of Granger causality test.
Model | Residual Degrees of Freedom (Res.Df) | Difference in Degrees of Freedom (Df) | F-Statistic (F) | P-Value (Pr(>F)) |
Unemployment predicted only by its own past values | 26 | -2 | 4.8568 | 0.01694 |
In terms of economic interpretation, this outcome proffers that historical GDP values in the preceding two years render valuable insights into the forecasting of unemployment rates for the subsequent years between 1992 to 2022 [15]. The p-value underscores the statistical significance of this result at the 5% level, reinforcing its academic pertinence. From a broader perspective, this analysis has palpable implications for policy formulation and economic prognostication. If GDP trajectories serve as precursors to future unemployment trends, it paves the way for preemptive macroeconomic interventions. An expanding economy, signaled by burgeoning GDP figures, typically resonates with corporate expansion, culminating in a proliferation of employment avenues and a concomitant decrement in unemployment rates [9]. In stark contrast, an economic downturn, manifested in GDP contractions, may precipitate corporate retrenchment, escalating unemployment levels [16]. The empirical validation of this interrelationship, as gleaned from the Granger causality test, underscores the centrality of GDP as a prognosticative tool for labor market dynamics in China during the specified period [17].
4.3. VAR Model
Lastly, from the constructed VAR model, several insights and results were shown. The primary finding pertains to the impact of lagged GDP growth rate changes on the present GDP growth dynamics. Notably, data from the VAR model highlights the influence of GDP growth rate changes from two periods prior on the present growth rate. Specifically, a one-unit increase in the GDP growth rate from two periods ago is associated with a decrease of approximately 0.733 in the current GDP growth rate, holding all else constant. This relationship is statistically significant at the 5% level, suggesting that it’s not just a random finding. This demonstrates the oscillatory nature of GDP growth, suggesting possible cyclical patterns inherent within the economy [10]. On the other hand, past variations in the unemployment rate demonstrate a lack of significant association with current GDP growth rate changes. Such an observation emphasizes that while GDP might inform itself across time, unemployment variations do not seem to feed into GDP growth rate predictions within our examined timeframe [15].
Shifting the analysis towards unemployment, no significant relationships were found between its past values and GDP growth rate. This implies that the unemployment rate’s dynamics are perhaps influenced by factors not directly tied to the GDP’s oscillatory patterns [10]. However, a deep dive into the unemployment data from the VAR model reveals a pronounced linear trend, which goes unaccounted for by other variables in the model. The significance of the constant term, at approximately 0.1001, and the trend term, at roughly -0.003942, both statistically significant at the 5% level, attest to this fact (Table 2, Table 3).
Table 2: VAR Model Results for GDP Growth Rate (gdp_diff2).
Variable | Estimate | Std. Error | t value | P-Value |
gdp_diff2.l1 | -0.3076 | 0.2835 | -1.085 | 0.2951 |
gdp_diff2.l2 | -0.7333 | 0.2934 | -2.499 | 0.0246 |
Trend | 0.0015 | 0.0026 | 0.591 | 0.5633 |
Notes: The model fit for GDP has Residual Std. Error: 0.06787, R-Squared: 0.4709, Adjusted R-Squared: 0.1535, F-statistic: 1.484, and P-value: 0.24.
Table 3: VAR Model Results for Unemployment (data_diff).
Variable | Estimate | Std. Error | t value | P-Value |
gdp_diff2.l1 | -0.3076 | 0.2835 | -1.085 | 0.2951 |
const | -0.1413 | 0.1998 | -0.707 | 0.4903 |
Trend | 0.1001 | 0.0406 | 2.465 | 0.0263 |
Notes: The model fit for Unemployment has Residual Std. Error: 0.04783, R-Squared: 0.4811, Adjusted R-Squared: 0.1698, F-statistic: 1.545, and P-value: 0.2191.
4.4. Correlation and Okun’s Law
Furthermore, while past values of both GDP and unemployment might not show a strong predictive power for future unemployment rates, the model does provide some insights into the dynamics between the two variables. The correlation matrix of residuals shows a moderate positive correlation of 0.4748. This indicates that when GDP experiences exogenous shocks or unexpected changes, unemployment rates tend to move in the same direction. Such a finding implies that there are external influences or policy shifts simultaneously affecting both GDP and unemployment [11]. The magnitude of the residuals’ correlations provides a nuanced perspective. A correlation of 0.4748, while moderate, suggests that almost 22.5% of the variation in one variable’s unexpected changes can be explained by unanticipated changes in the other. While not overwhelming, it is a substantial amount that policymakers and economic forecasters should consider. Moreover, the residuals’ covariance matrix underlines this relationship with more explicit figures. Specifically, the covariance between GDP growth rate changes and unemployment rate changes stands at approximately 0.001541. While the figure itself might appear diminutive, it is crucial to contextualize it against the backdrop of macroeconomic indicators (Table 4, Table 5). Such a covariance figure accentuates that when GDP growth rate changes deviate from their expected values, it can anticipate a proportionate deviation in unemployment rate changes, and vice versa [15].
Table 4: Covariance Matrix of Residuals.
GDP (gdp_diff2) | Unemployment(data_diff) | |
GDP (gdp_diff2) | 0.004606 | 0.001541 |
Unemployment (data_diff) | 0.001541 | 0.002288 |
Table 5: Correlation Matrix of Residuals.
GDP (gdp_diff2) | Unemployment(data_diff) | |
GDP (gdp_diff2) | 1.0000 | 0.4748 |
Unemployment (data_diff) | 0.4748 | 1.0000 |
Based on the results, the relationship between GDP growth rate changes and subsequent unemployment rate alterations does echo the inverse relationship posited by Okun’s Law. However, in the context of China, the observed coefficients deviate from this classical 2% benchmark [1]. This deviation might be attributed to China’s unique economic dynamics that do not strictly adhere to Okun’s law. Several factors could account for this divergence. China’s rapid structural transformations, technological innovations, and evolving policy landscapes might be influencing the GDP-unemployment relationship differently. Additionally, the sheer scale and complexity of China’s economy, with its regional disparities and sectoral shifts, could also play a role [11].
5. Conclusion
Over the three-decade span from 1992 to 2022, China’s remarkable GDP growth, which surged over 40-fold, did not consistently correlate with a proportional decline in unemployment. This study, employing the Granger causality test and the VAR model, revealed that while historical GDP values significantly predicted future unemployment rates, the relationship did not strictly align with the classical coefficients of Okun’s Law. The unique dynamics of China’s economy, marked by transitions from agriculture to service and industrial sectors, regional economic disparities, and other intricate factors, play a pivotal role in shaping this GDP-unemployment relationship. Policymakers, businesses, and industries should recognize these nuances. At the governmental level, addressing regional economic imbalances and promoting workforce upskilling can foster a balanced growth and employment landscape. For businesses, anticipating cyclical economic patterns and embracing technological advancements can ensure resilience and sustainability. Collaborative efforts between industries and educational institutions can further bridge skill gaps and promote innovation. In essence, while Okun’s Law offers a foundational understanding of the GDP-unemployment interplay in many developed contexts, its application to China demands a nuanced interpretation, emphasizing the importance of tailoring economic theories to specific socio-economic landscapes.
References
[1]. Arthur M. Okun, “Potential GNP, Its measurement and Significance, in Proceedings of the Business and Economics Statistics Section.” American Statistical Association, 1962, pp. 98-103.
[2]. Lee, Jim. “The Robustness of Okun’s Law: Evidence from OECD Countries.” Journal of Macroeconomics, vol. 22, no. 2, 2000, pp. 331-356.
[3]. Freeman, Donald G. “Panel Tests of Okun’s Law for Ten Industrial Countries.” Economic Inquiry, vol. 39, no. 4, 2001, pp. 511-523.
[4]. Guisinger, Amy. “A State-level Analysis of Okun’s Law.” Regional Science and Urban Economics, vol. 68, 2018, pp. 239-248.
[5]. Goto, Eiji and Constantin Burgi. “Sectoral Okun’s Law and Cross-country Cyclical Differences.” Economic Modelling, vol. 94, 2020, pp. 91-103.
[6]. Moosa, Imad A. “Economic Growth and Unemployment in Arab Countries: Is Okun’s Law Valid?” Journal of Development and Economic Policies, vol. 10, no. 2, 2008, pp. 5-24.
[7]. Sadikua, Murat. “Econometric Estimation of the Relationship between Unemployment Rate and Economic Growth of FYR of Macedonia.” 2014, pp.69-81
[8]. Bankole, Abiodun S., and Basiru O. Fatai. “Empirical Test of Okun’s Law in Nigeria.” International Journal of Economic Practices and Theories, vol. 3, no. 3, 2013, pp. 2247-7225.
[9]. Zou Wei and Hu Xuan, “Research on the Deviation of Chinese Economy from Okun’s Law and Unemployment.” World Economic, 2003, pp.40-47
[10]. Cai, Fang. “Why Okun’s Law fails in China - Re-discussing the relationship between economic growth and employment.” Macroeconomic Research, Volume 1, 2007.
[11]. Fang Fuqian and Sun Yongjun, “Applicability Test of Okun’s Law in my country.” Economic Dynamics, Volume 12, 2012.
[12]. Wang Liyong and Xu Xiaoli, “Research on the Periodic Fluctuation Characteristics of Okun Coefficient in China.” Macroeconomic Research, Volume 1, 2018.
[13]. Irfan Lal, Sulaiman D. Muhammad, Anwer M. Jalil, and Adnan Hussain. “Test of Okun’s Law in Some Asian Countries Co-integration Approach.” European Journal of Scientific Research, vol. 40, no. 1, 2010, pp. 73-80.
[14]. Hu, Jingbei. “Intersectoral Migration of Agricultural Labor Force and Business Cycles in Developing Countries.” Stanford Center for International Development Working Paper, no. 402, 2009.
[15]. Li Wu-wei, H. Qiong, W. Yu-hong and L. Dang-she, “Research on a Regression Model for the Relationship between GDP and Unemployment: Evidence from China.” International Conference on Management Science and Engineering, Harbin, China, 2007, pp. 1390-1396.
[16]. Shuaizhang Feng, Yingyao Hu, Robert Moffitt, “Long run trends in unemployment and labor force participation in urban China.” Journal of Comparative Economics, Volume 45, Issue 2, 2017, pp. 304-324.
[17]. Kołbyko, Patryk. “Application of the Vector-Autoregression VAR Model in the Analysis of Unemployment Hysteresis in the Context of Okun’s Law.” Research Papers in Economics and Finance 6.2 (2023), pp.68–85.
Cite this article
Li,Y. (2023). Unraveling the Relationship Between GDP and Unemployment in China with Okun’s Law. Advances in Economics, Management and Political Sciences,55,218-225.
Data availability
The datasets used and/or analyzed during the current study will be available from the authors upon reasonable request.
Disclaimer/Publisher's Note
The statements, opinions and data contained in all publications are solely those of the individual author(s) and contributor(s) and not of EWA Publishing and/or the editor(s). EWA Publishing and/or the editor(s) disclaim responsibility for any injury to people or property resulting from any ideas, methods, instructions or products referred to in the content.
About volume
Volume title: Proceedings of the 2nd International Conference on Financial Technology and Business Analysis
© 2024 by the author(s). Licensee EWA Publishing, Oxford, UK. This article is an open access article distributed under the terms and
conditions of the Creative Commons Attribution (CC BY) license. Authors who
publish this series agree to the following terms:
1. Authors retain copyright and grant the series right of first publication with the work simultaneously licensed under a Creative Commons
Attribution License that allows others to share the work with an acknowledgment of the work's authorship and initial publication in this
series.
2. Authors are able to enter into separate, additional contractual arrangements for the non-exclusive distribution of the series's published
version of the work (e.g., post it to an institutional repository or publish it in a book), with an acknowledgment of its initial
publication in this series.
3. Authors are permitted and encouraged to post their work online (e.g., in institutional repositories or on their website) prior to and
during the submission process, as it can lead to productive exchanges, as well as earlier and greater citation of published work (See
Open access policy for details).
References
[1]. Arthur M. Okun, “Potential GNP, Its measurement and Significance, in Proceedings of the Business and Economics Statistics Section.” American Statistical Association, 1962, pp. 98-103.
[2]. Lee, Jim. “The Robustness of Okun’s Law: Evidence from OECD Countries.” Journal of Macroeconomics, vol. 22, no. 2, 2000, pp. 331-356.
[3]. Freeman, Donald G. “Panel Tests of Okun’s Law for Ten Industrial Countries.” Economic Inquiry, vol. 39, no. 4, 2001, pp. 511-523.
[4]. Guisinger, Amy. “A State-level Analysis of Okun’s Law.” Regional Science and Urban Economics, vol. 68, 2018, pp. 239-248.
[5]. Goto, Eiji and Constantin Burgi. “Sectoral Okun’s Law and Cross-country Cyclical Differences.” Economic Modelling, vol. 94, 2020, pp. 91-103.
[6]. Moosa, Imad A. “Economic Growth and Unemployment in Arab Countries: Is Okun’s Law Valid?” Journal of Development and Economic Policies, vol. 10, no. 2, 2008, pp. 5-24.
[7]. Sadikua, Murat. “Econometric Estimation of the Relationship between Unemployment Rate and Economic Growth of FYR of Macedonia.” 2014, pp.69-81
[8]. Bankole, Abiodun S., and Basiru O. Fatai. “Empirical Test of Okun’s Law in Nigeria.” International Journal of Economic Practices and Theories, vol. 3, no. 3, 2013, pp. 2247-7225.
[9]. Zou Wei and Hu Xuan, “Research on the Deviation of Chinese Economy from Okun’s Law and Unemployment.” World Economic, 2003, pp.40-47
[10]. Cai, Fang. “Why Okun’s Law fails in China - Re-discussing the relationship between economic growth and employment.” Macroeconomic Research, Volume 1, 2007.
[11]. Fang Fuqian and Sun Yongjun, “Applicability Test of Okun’s Law in my country.” Economic Dynamics, Volume 12, 2012.
[12]. Wang Liyong and Xu Xiaoli, “Research on the Periodic Fluctuation Characteristics of Okun Coefficient in China.” Macroeconomic Research, Volume 1, 2018.
[13]. Irfan Lal, Sulaiman D. Muhammad, Anwer M. Jalil, and Adnan Hussain. “Test of Okun’s Law in Some Asian Countries Co-integration Approach.” European Journal of Scientific Research, vol. 40, no. 1, 2010, pp. 73-80.
[14]. Hu, Jingbei. “Intersectoral Migration of Agricultural Labor Force and Business Cycles in Developing Countries.” Stanford Center for International Development Working Paper, no. 402, 2009.
[15]. Li Wu-wei, H. Qiong, W. Yu-hong and L. Dang-she, “Research on a Regression Model for the Relationship between GDP and Unemployment: Evidence from China.” International Conference on Management Science and Engineering, Harbin, China, 2007, pp. 1390-1396.
[16]. Shuaizhang Feng, Yingyao Hu, Robert Moffitt, “Long run trends in unemployment and labor force participation in urban China.” Journal of Comparative Economics, Volume 45, Issue 2, 2017, pp. 304-324.
[17]. Kołbyko, Patryk. “Application of the Vector-Autoregression VAR Model in the Analysis of Unemployment Hysteresis in the Context of Okun’s Law.” Research Papers in Economics and Finance 6.2 (2023), pp.68–85.