


1. Introduction
Systemic financial risks can be defined as: financial risks that may have a significant impact on the normal development of financial services, and then have a huge negative impact on the real economy. Xiaopu, Z finds that SFR has different meanings. It represents the whole financial system risk. Also, it affects most of industries deeply in some cases [1].
Chinese stock market is a policy-dependent stock market. According to the Rong-Cai, H. U.’s research on policy events in China’s stock market and the Shanghai Composite Index from January 2005 to June 2009, it is found that there were many policy events in Chinese stock market in 2007 and 2008, indicating that the intensity of policy intervention in the market was relatively strong [2].
Using the K-means clustering method, Shu-Lin, W. found that investors were roughly divided into the following three groups: activist investors, passive investors, and professional investors. Short-term products or slightly higher-risk products are recommended for activist investors, while long-term low-risk products are recommended for professional investors and passive investors. Unlike professional investors, both activist and passive investors hope to make investment decisions through short-term information [3].
On June 19, 2015, the SSEC fell sharply in a single day. The stock market has shifted from a bull market to a bear market, resulting in a financial panic. This paper aims to study the impact of SFR on SSEC, and put forward policy recommendations and investor recommendations. Using ARIMA model to forecast the SSEC, the paper compares forecast data with actual data after June 19, 2015, and finally draws a conclusion.
2. Literature Review
Existing studies have several researches on the impact of SFR on the stock market, and the research conclusions are also different.
Al-Qudah A assessed the impact of systemic risk on stock return of industrial companies listed on the Amman Stock Exchange. Through regression analysis, this paper found no statistically significant relationship between systemic risk and annual stock returns. [4].
Nugroho M, Arif D, Halik A found that with greater systematic risk, stock price would closely follow the market index. Investors were likely to predict company stock prices accurately with the close relationship between stock price and market index, which results in a more transparent market. Thus, the expected return of investors would be much higher [5].
Maghsoud et al. studied Tehran Stock Exchange. The results showed that different factors influence stock returns in different situations. Specifically, oil prices and inflation had a greater impact on stock returns than interest rates and exchange rates. It is recommended to use models to separate institutional transitions at various levels of risk when predicting stock returns [6].
Zolotoy L studied the relationship of systemic risk and the Fama-French Model and found that market factor, SMB factor and HML factor showed different status in regard to new information. Market factor seemed to expand negative shocks to the market portfolio. The paper also found there was no evidence of the relationship of SMB factor to information shocks. Finally, the paper found that the HML factor tended to weaken negative shocks to the portfolio [7].
Yang Z H examined Chinese stock market in 2020, and analyzed the risk transmission among various departments of financial market during the epidemic. The results indicated the event caused a negative influence on various departments after the Spring Festival. Also, the influence of the event on financial market was relatively short-lived [8].
Yang, L. measured system liquidity of 50 constituent stocks of Shanghai Stock Exchange from 2003 to 2004, and constructed a Fama-French three-factor model. The research showed that excess returns contain a premium for system liquidity risk, and system liquidity risk would affect stock prices and returns [9].
Shengyao, L. discussed the systemic risk in Chinese stock market, and studied particular crash risk and expected return. The results indicated that there was a positive impact of crash systemic risk on expected return. This paper verified that investors’ gaming stock preferences and auspicious number preferences also had a significant impact on the expected return [10].
Existing literatures have roughly studied relationship between SFR and stock returns in various industries, and found that the relationship differed in different market and situation, while there is a lack of research on indices. In addition, the SFR during the 2015 stock market crash in China also need to be studied.
3. Model and Variables
3.1. Data Source
This paper selects SSEC closing price data from January 2010 to August 2015 as the research object, and uses daily, weekly, and monthly data for analysis. The data source is from WIND database.
3.2. Model Specification
This paper chooses a relatively mature stock price forecasting model, that is, the ARIMA model which is simple and convenient, easy to estimate and has strong short-term forecasting ability. The ARIMA model is a time-series short-term forecasting method with high accuracy. Therefore, this paper decides to establish an ARIMA model to make predictions. Finally, this paper compares the predicted results with actual data to identify and explain the difference.
ARIMA model is a time series forecasting method proposed by Box and Jenkins in the early 1970s [11]. ARIMA model differentiates the time series data to make the data stationary. The expression of this model is showed as follows:
\( {w_{t}}=c+{ϕ_{1}}{w_{t-1}}+{ϕ_{2}}{w_{t-2}}+⋯+{ϕ_{p}}{w_{t-p}}+{ε_{t}}+{θ_{1}}{ε_{t-1}}+{θ_{2}}{ε_{t-2}}+⋯+{θ_{q}}{ε_{t-q}} \) (1)
In the formula,the parameter \( c \) is a constant. \( \lbrace {w_{t}}\rbrace \) is the variable after the difference, that is, \( {w_{t}}={z_{t}}-{z_{t-1}} \) , \( {z_{t}} \) is the corresponding logarithm of Shanghai index data. \( \lbrace {ε_{t}}\rbrace \) is a white noise sequence. \( {ϕ_{1}},{ϕ_{2}}⋯{ϕ_{p}} \) are autoregressive coefficients. \( {θ_{1}},{θ_{2}}⋯{θ_{q}} \) are moving average coefficients.
4. Empirical Results and Analysis
4.1. Stationarity Test
In this paper, Augmented Dickey-Fuller test is used to test statistics to determine whether the time series data is stable. The results of the stationarity test are shown in Table 1. The daily data are stable after the first-order difference and can be ordered. Weekly and monthly data are stable after the first-order and second-order differences, while the first-order difference cannot be ordered, and the second-order difference can be ordered. Therefore, this paper uses the second-order difference to model weekly and monthly data.
Table 1: Weak stationarity test.
t | p | |
Daily | ||
Raw | 1.310 | 1.0000 |
1st order difference | -26.384 | 0.0000 |
Weekly | ||
Raw | 0.401 | 0.9966 |
1st order difference | -10.314 | 0.0000 |
2nd order difference | -19.248 | 0.0000 |
Monthly | ||
Raw | 1.014 | 1.0000 |
1st order difference | -5.926 | 0.0000 |
2nd order difference | -10.686 | 0.0000 |
4.2. Model Identification
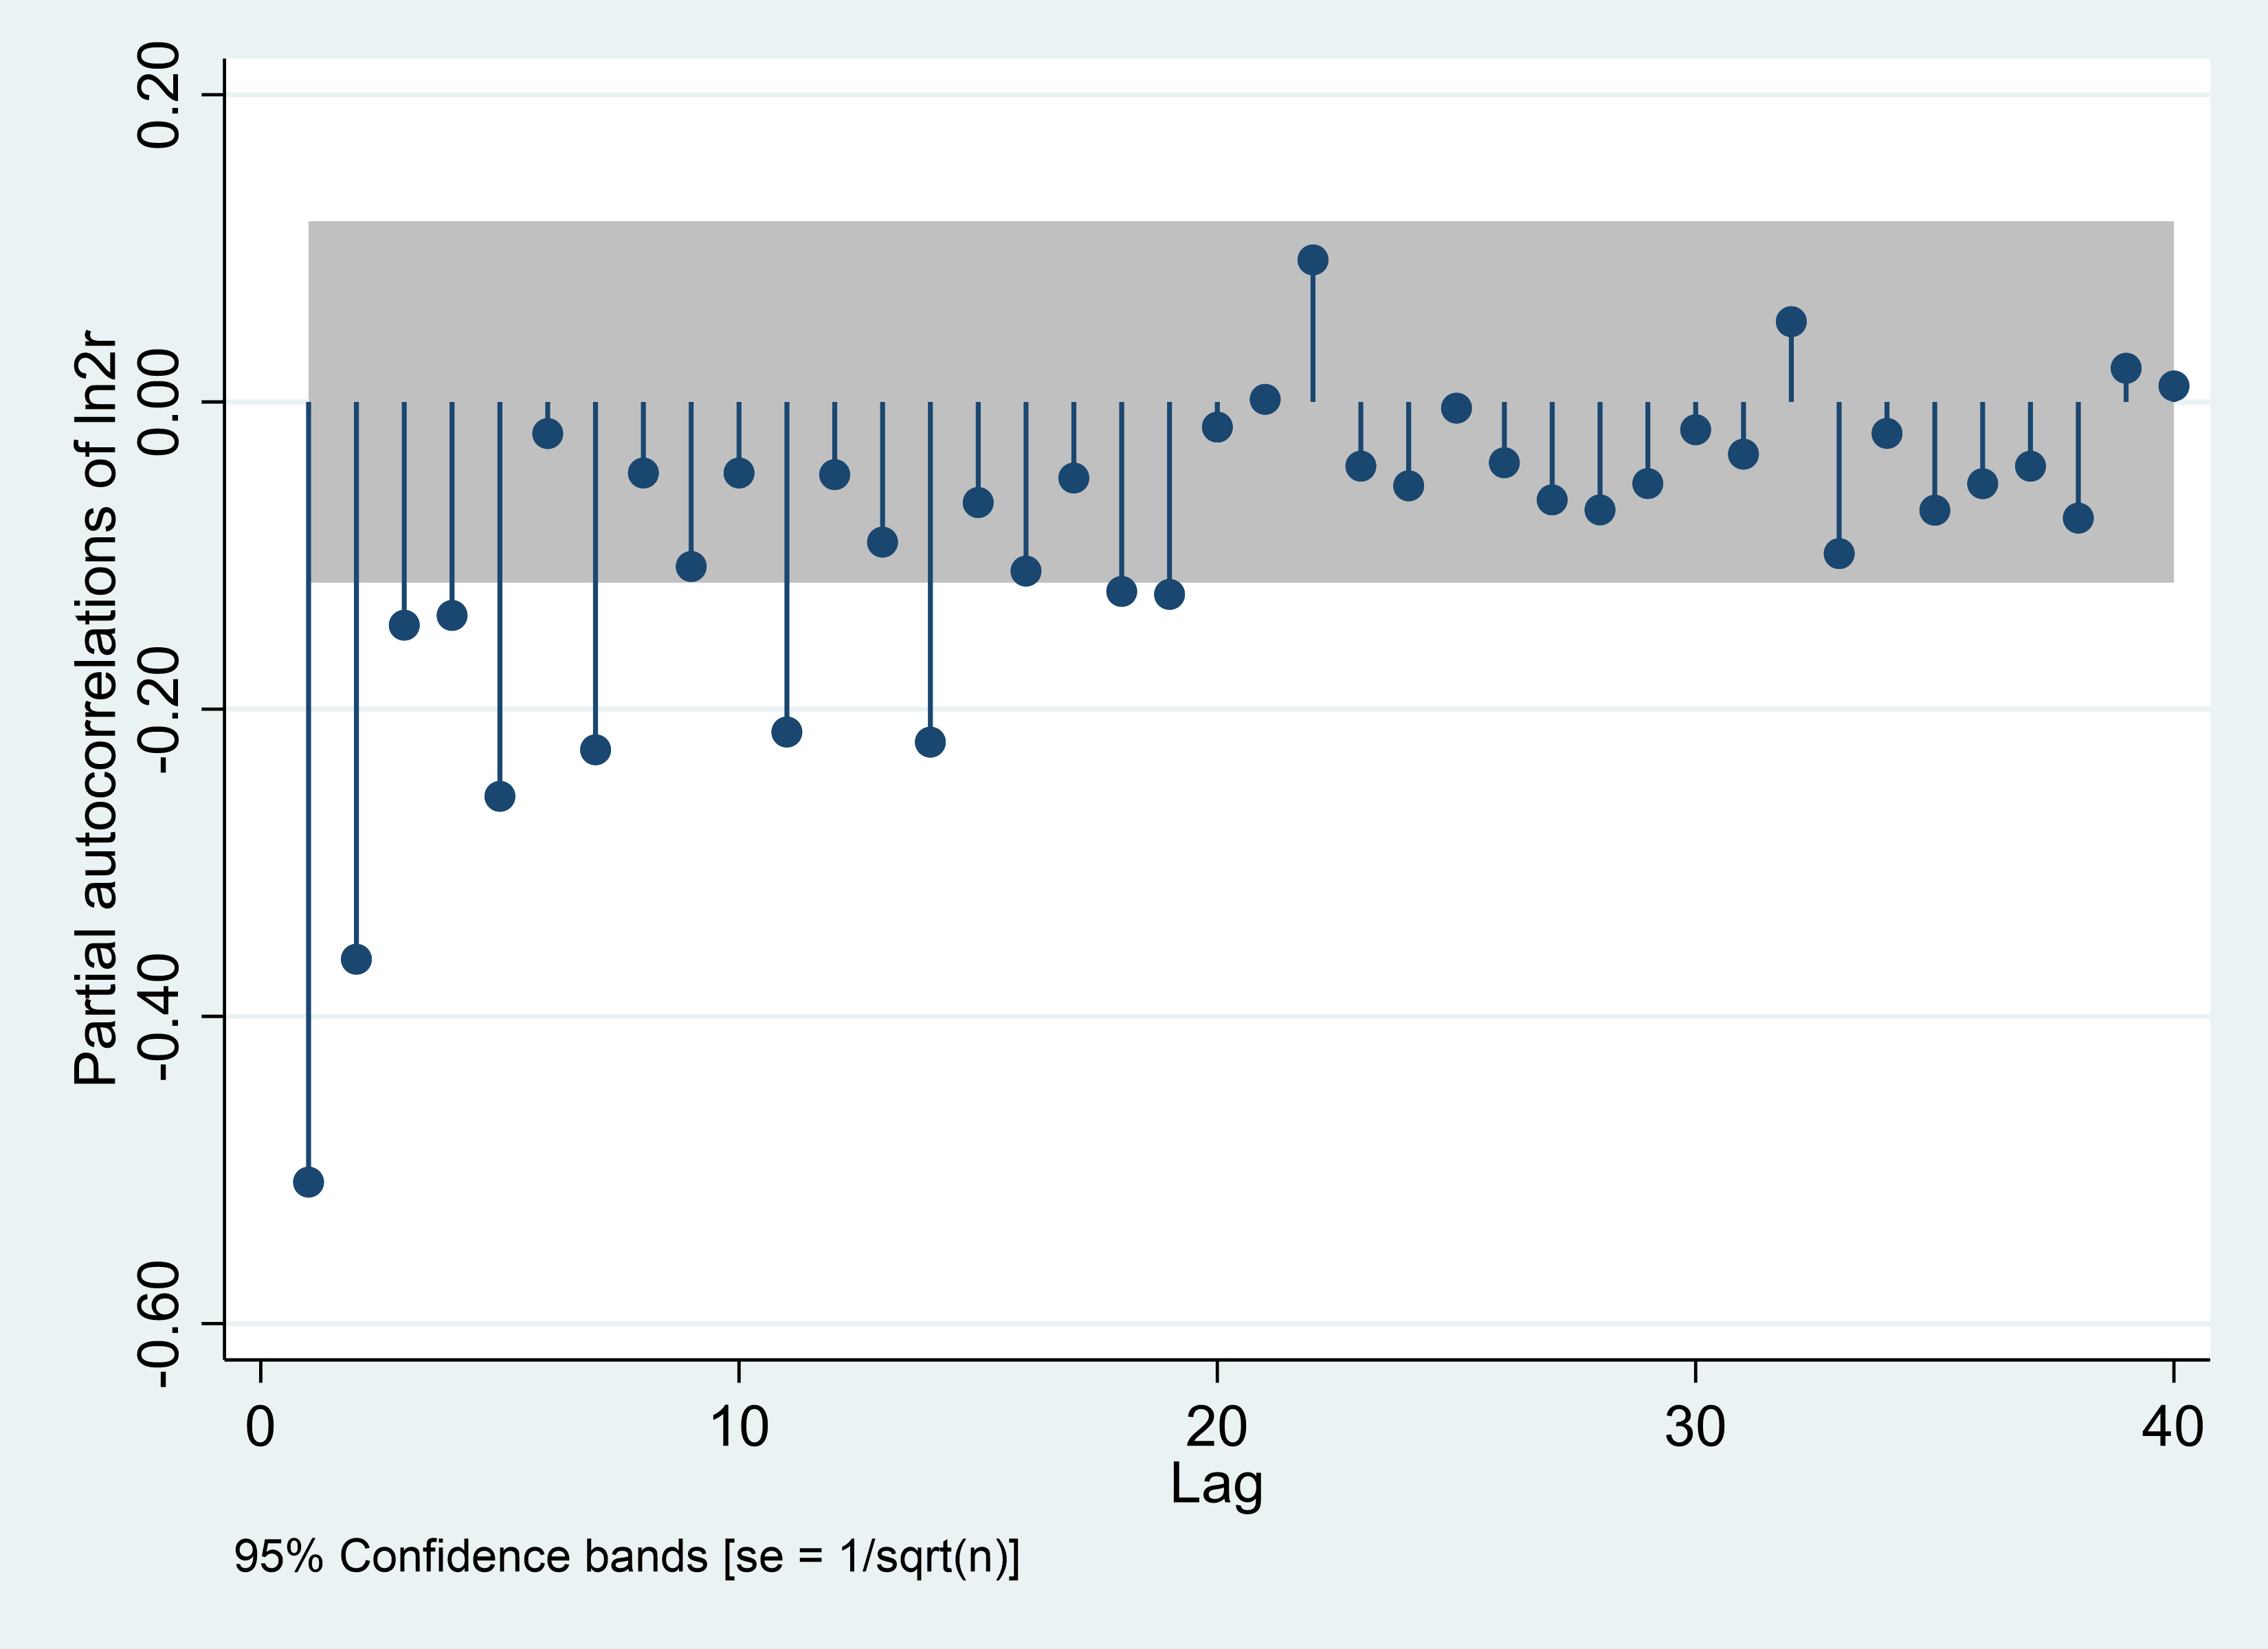
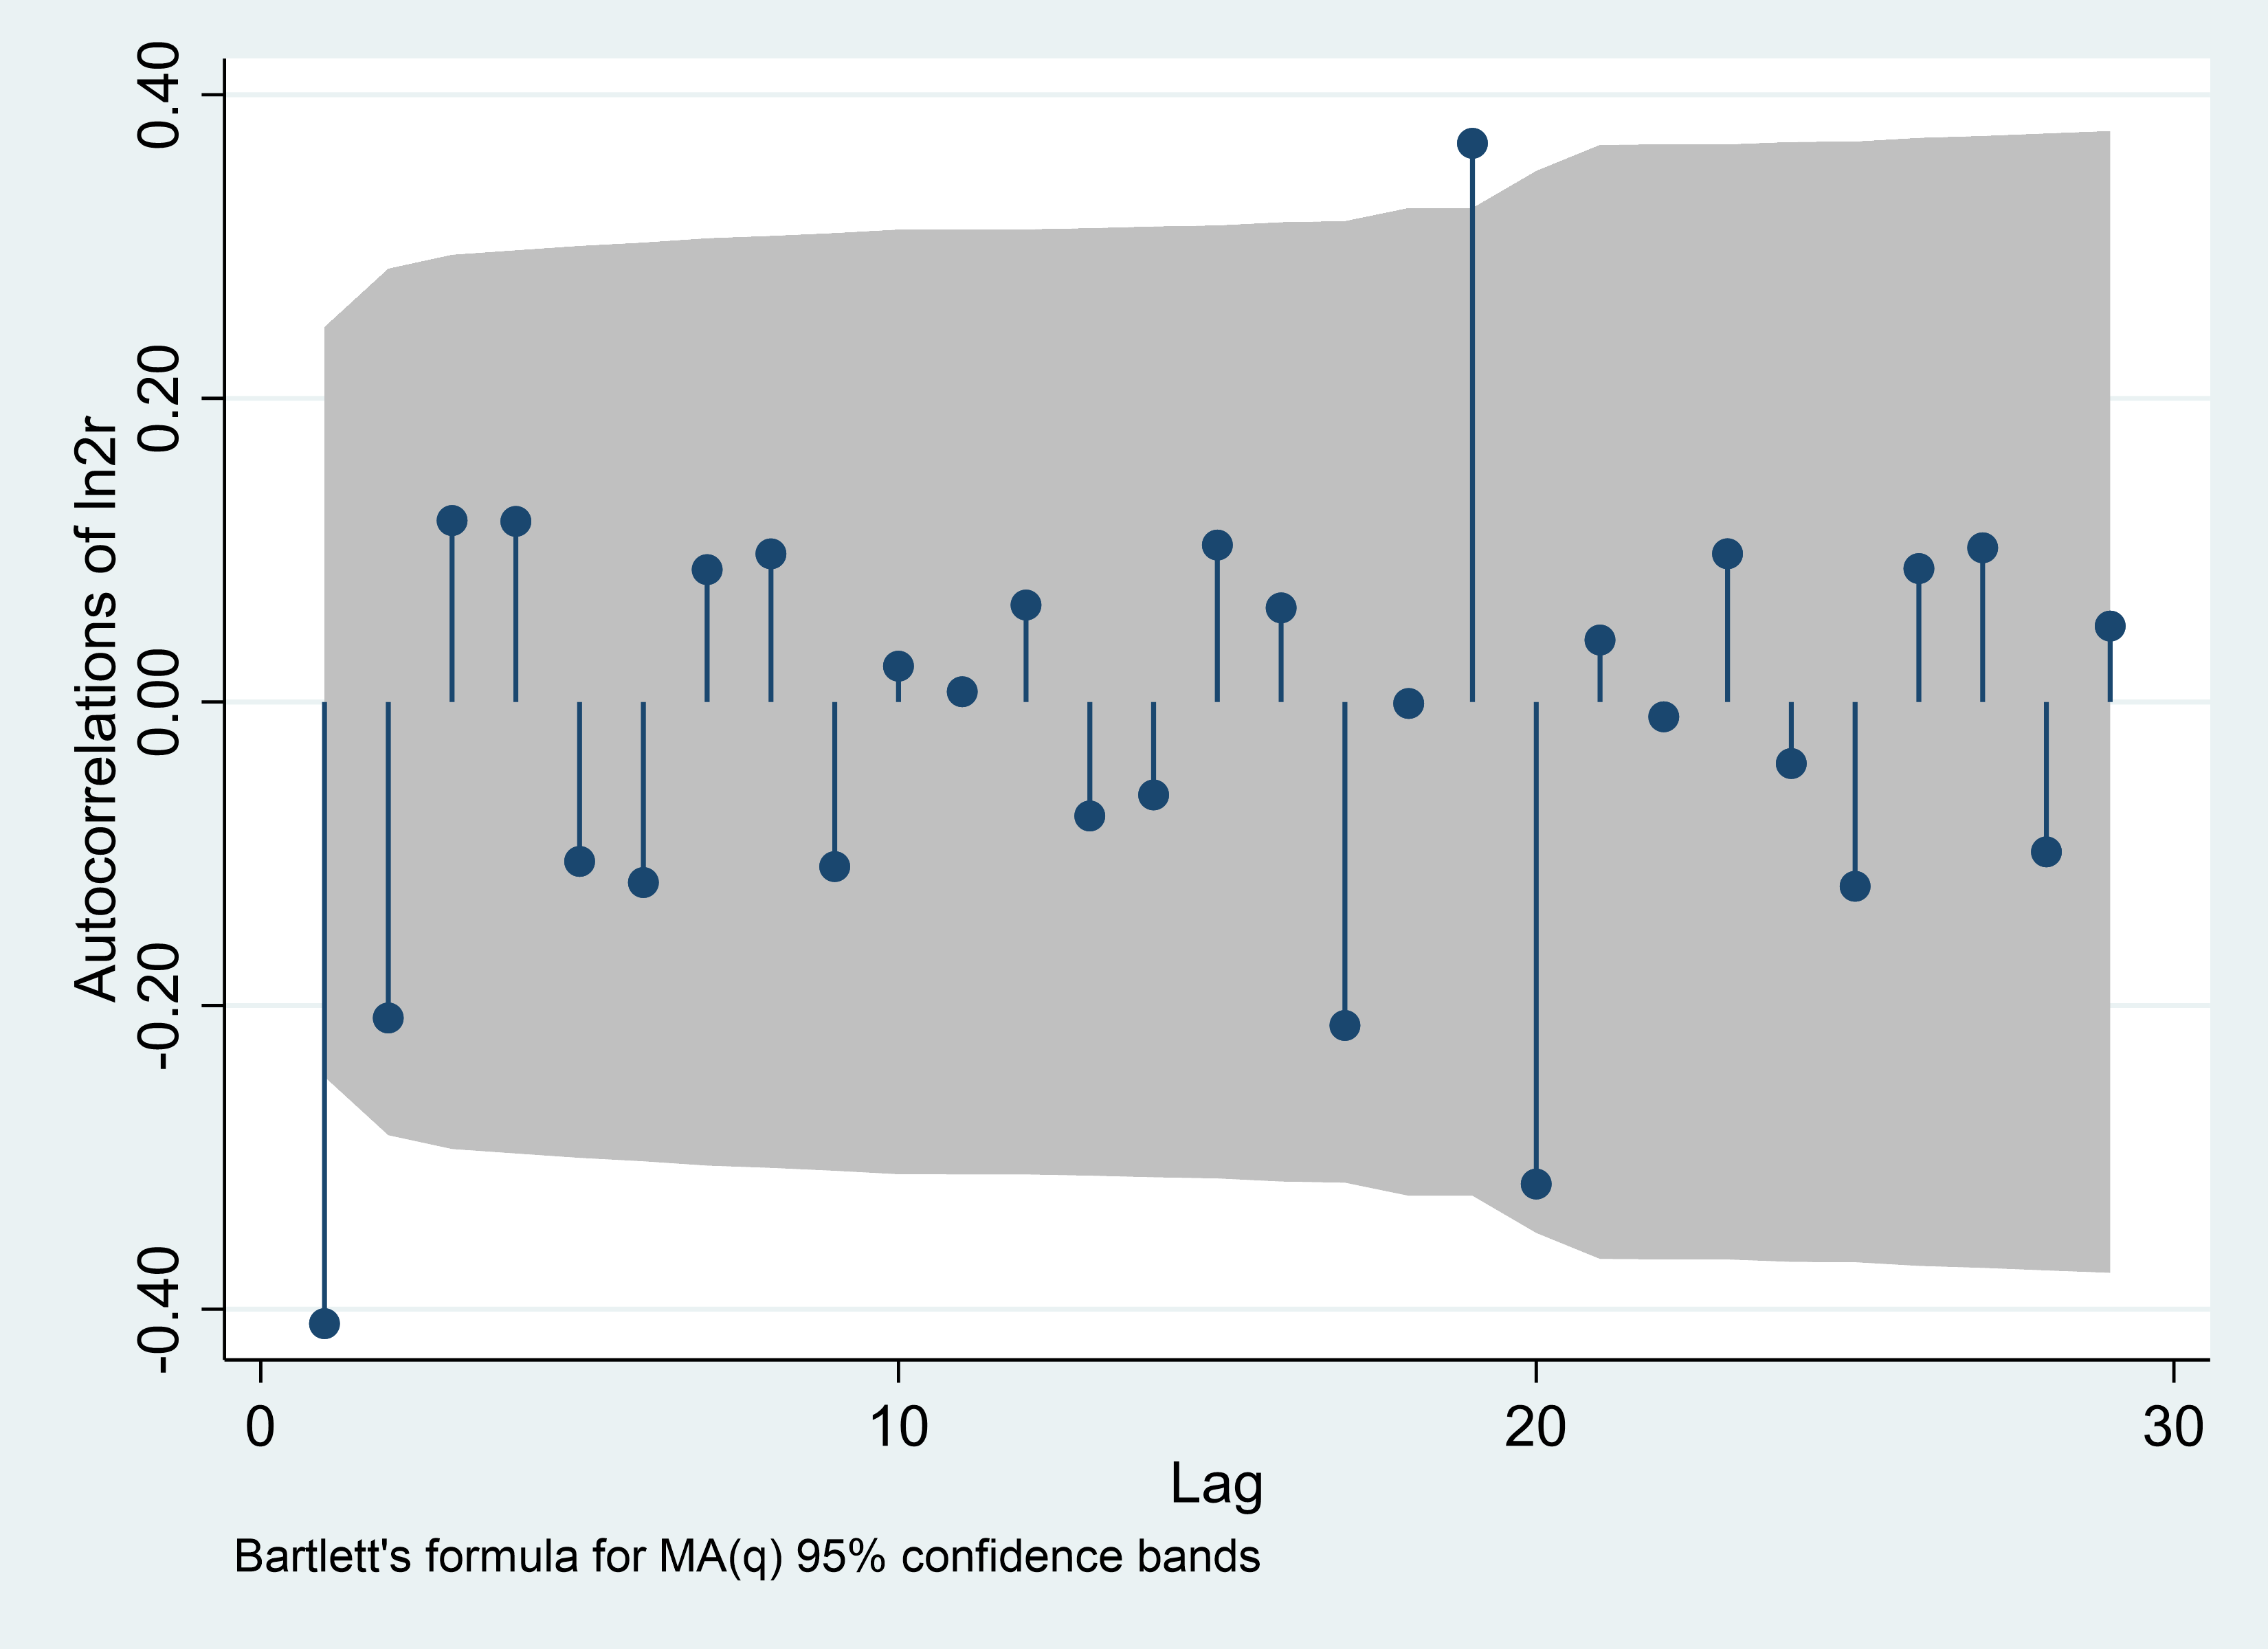
In this section of the article, it is first necessary to order the daily, weekly and monthly series using the PACF and ACF pairs, the results of which are shown below Figure 1.
PACF | ACF |
Daily | |
|
|
Weekly | |
|
|
Monthly | |
|
|
Figure 1: ARMA (p, q) identification. | |
Photo credit: Original | |
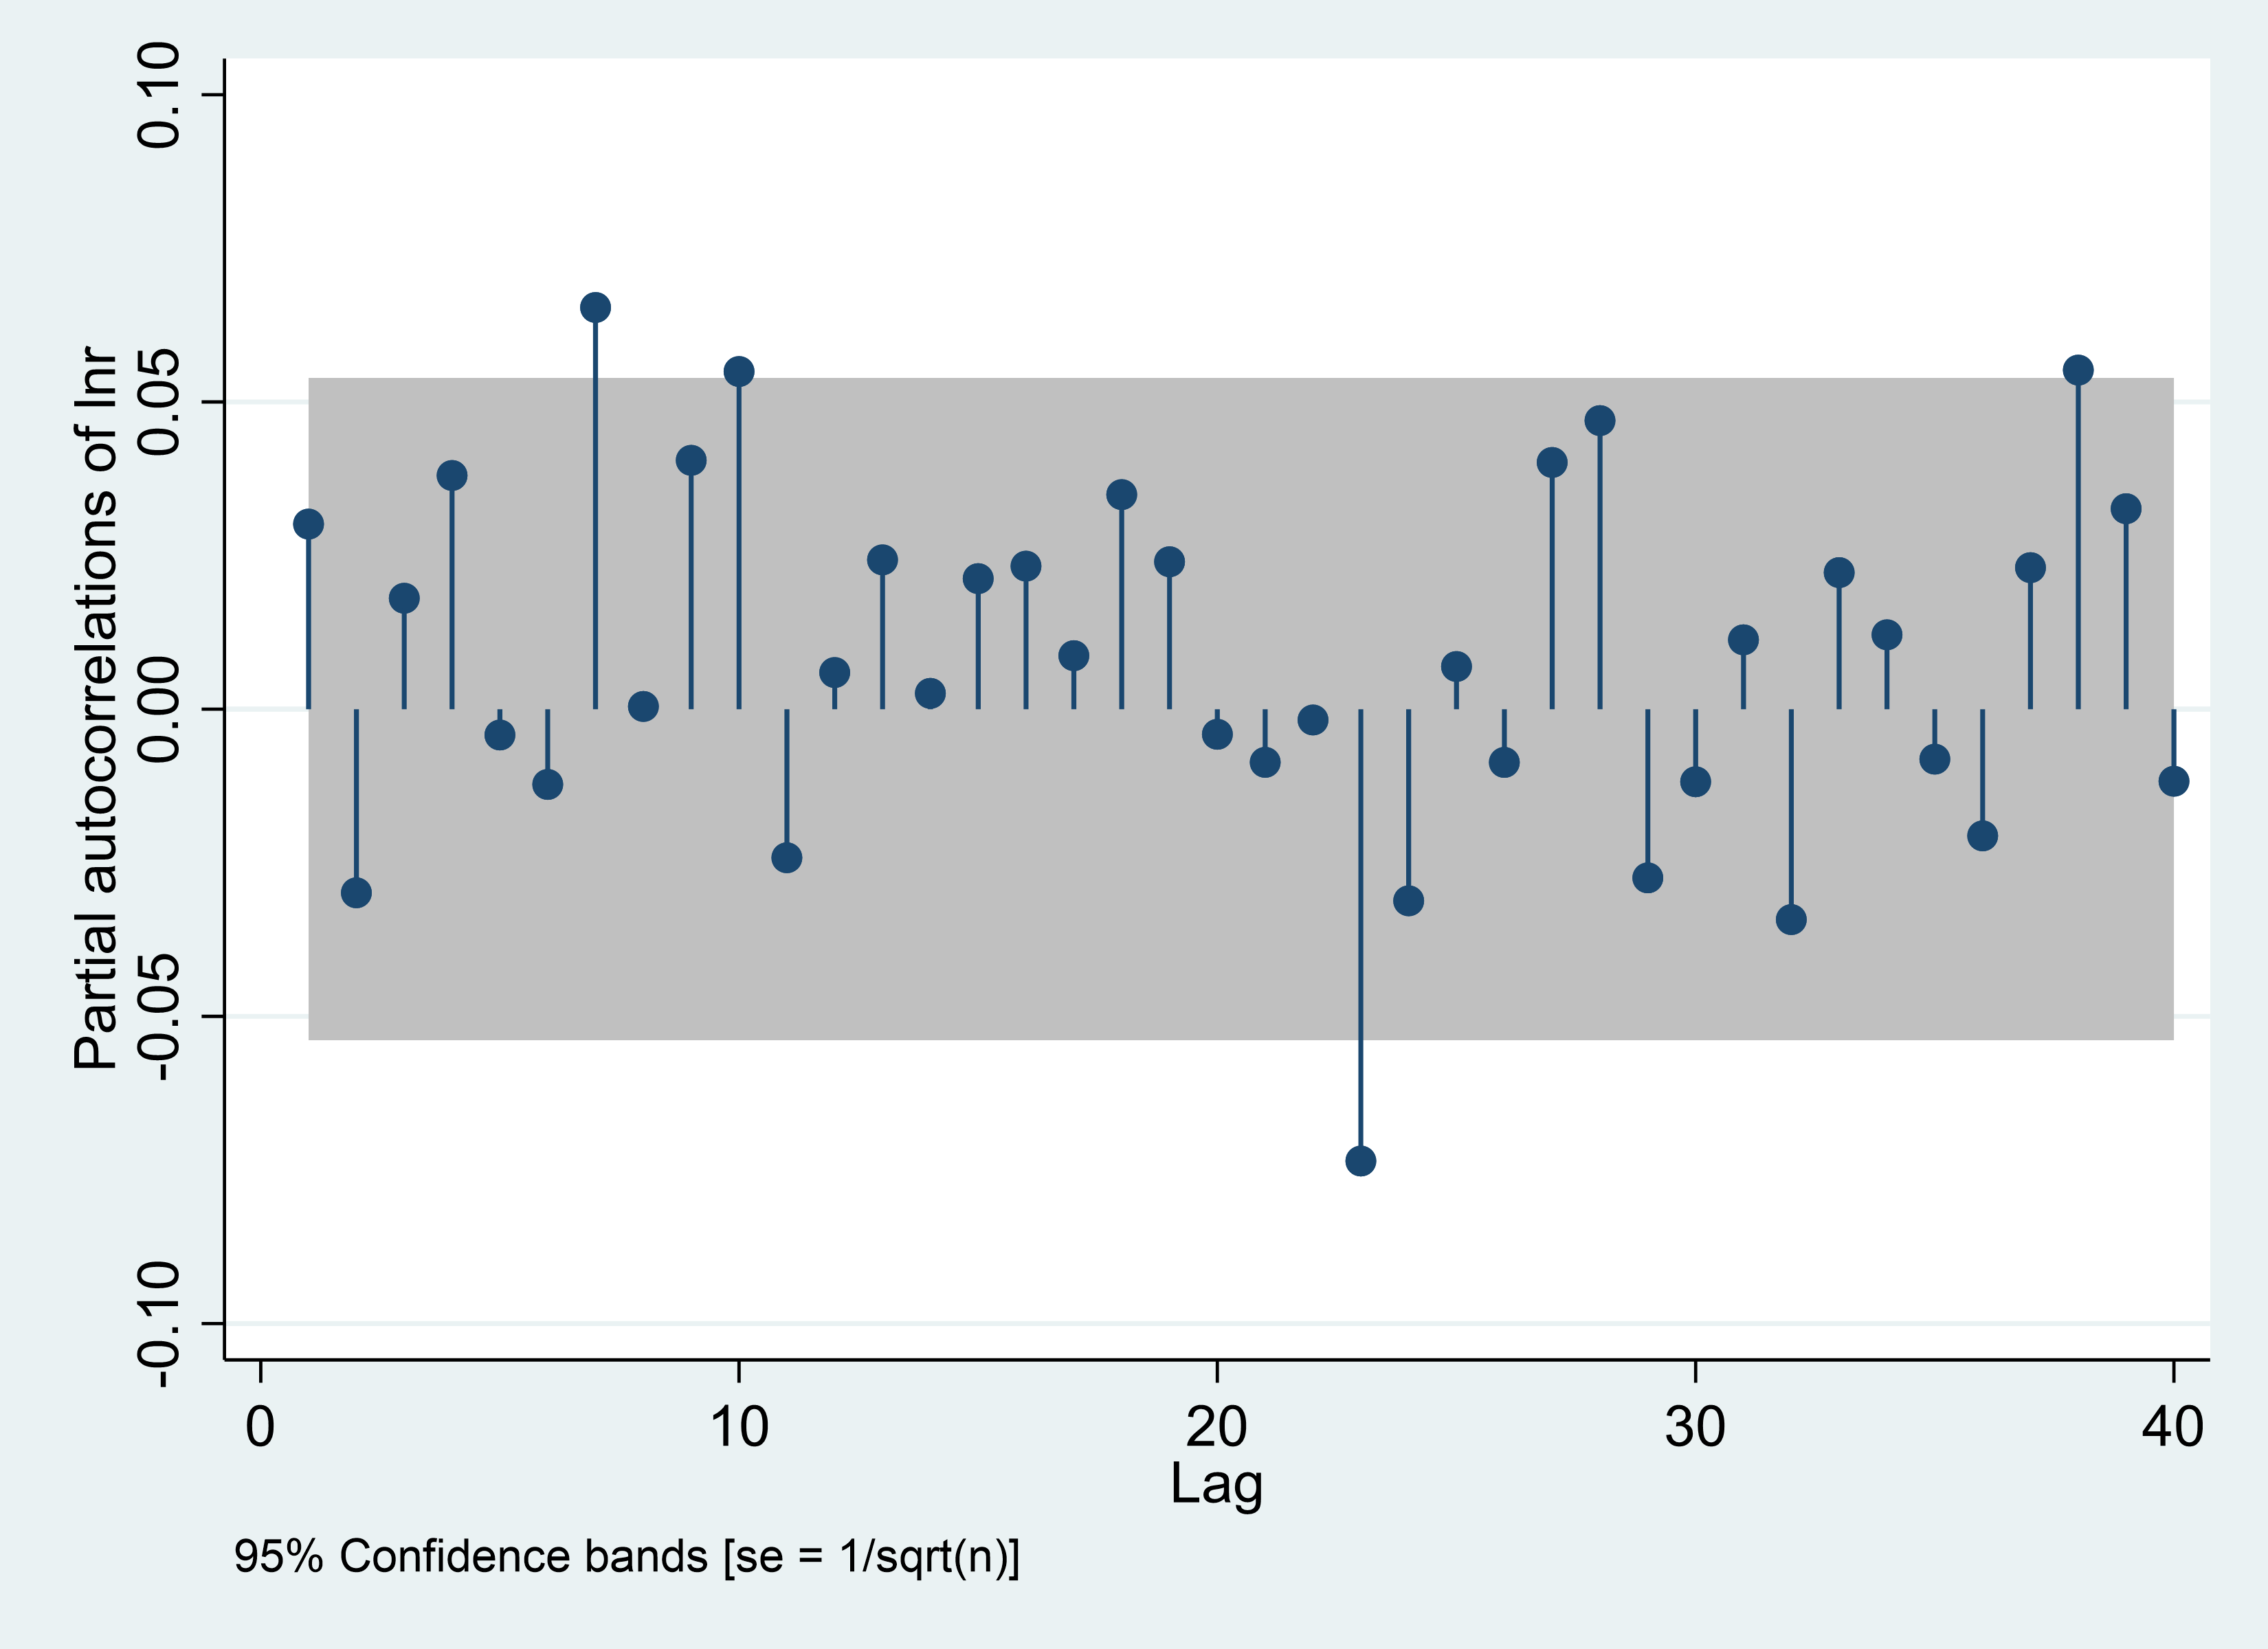
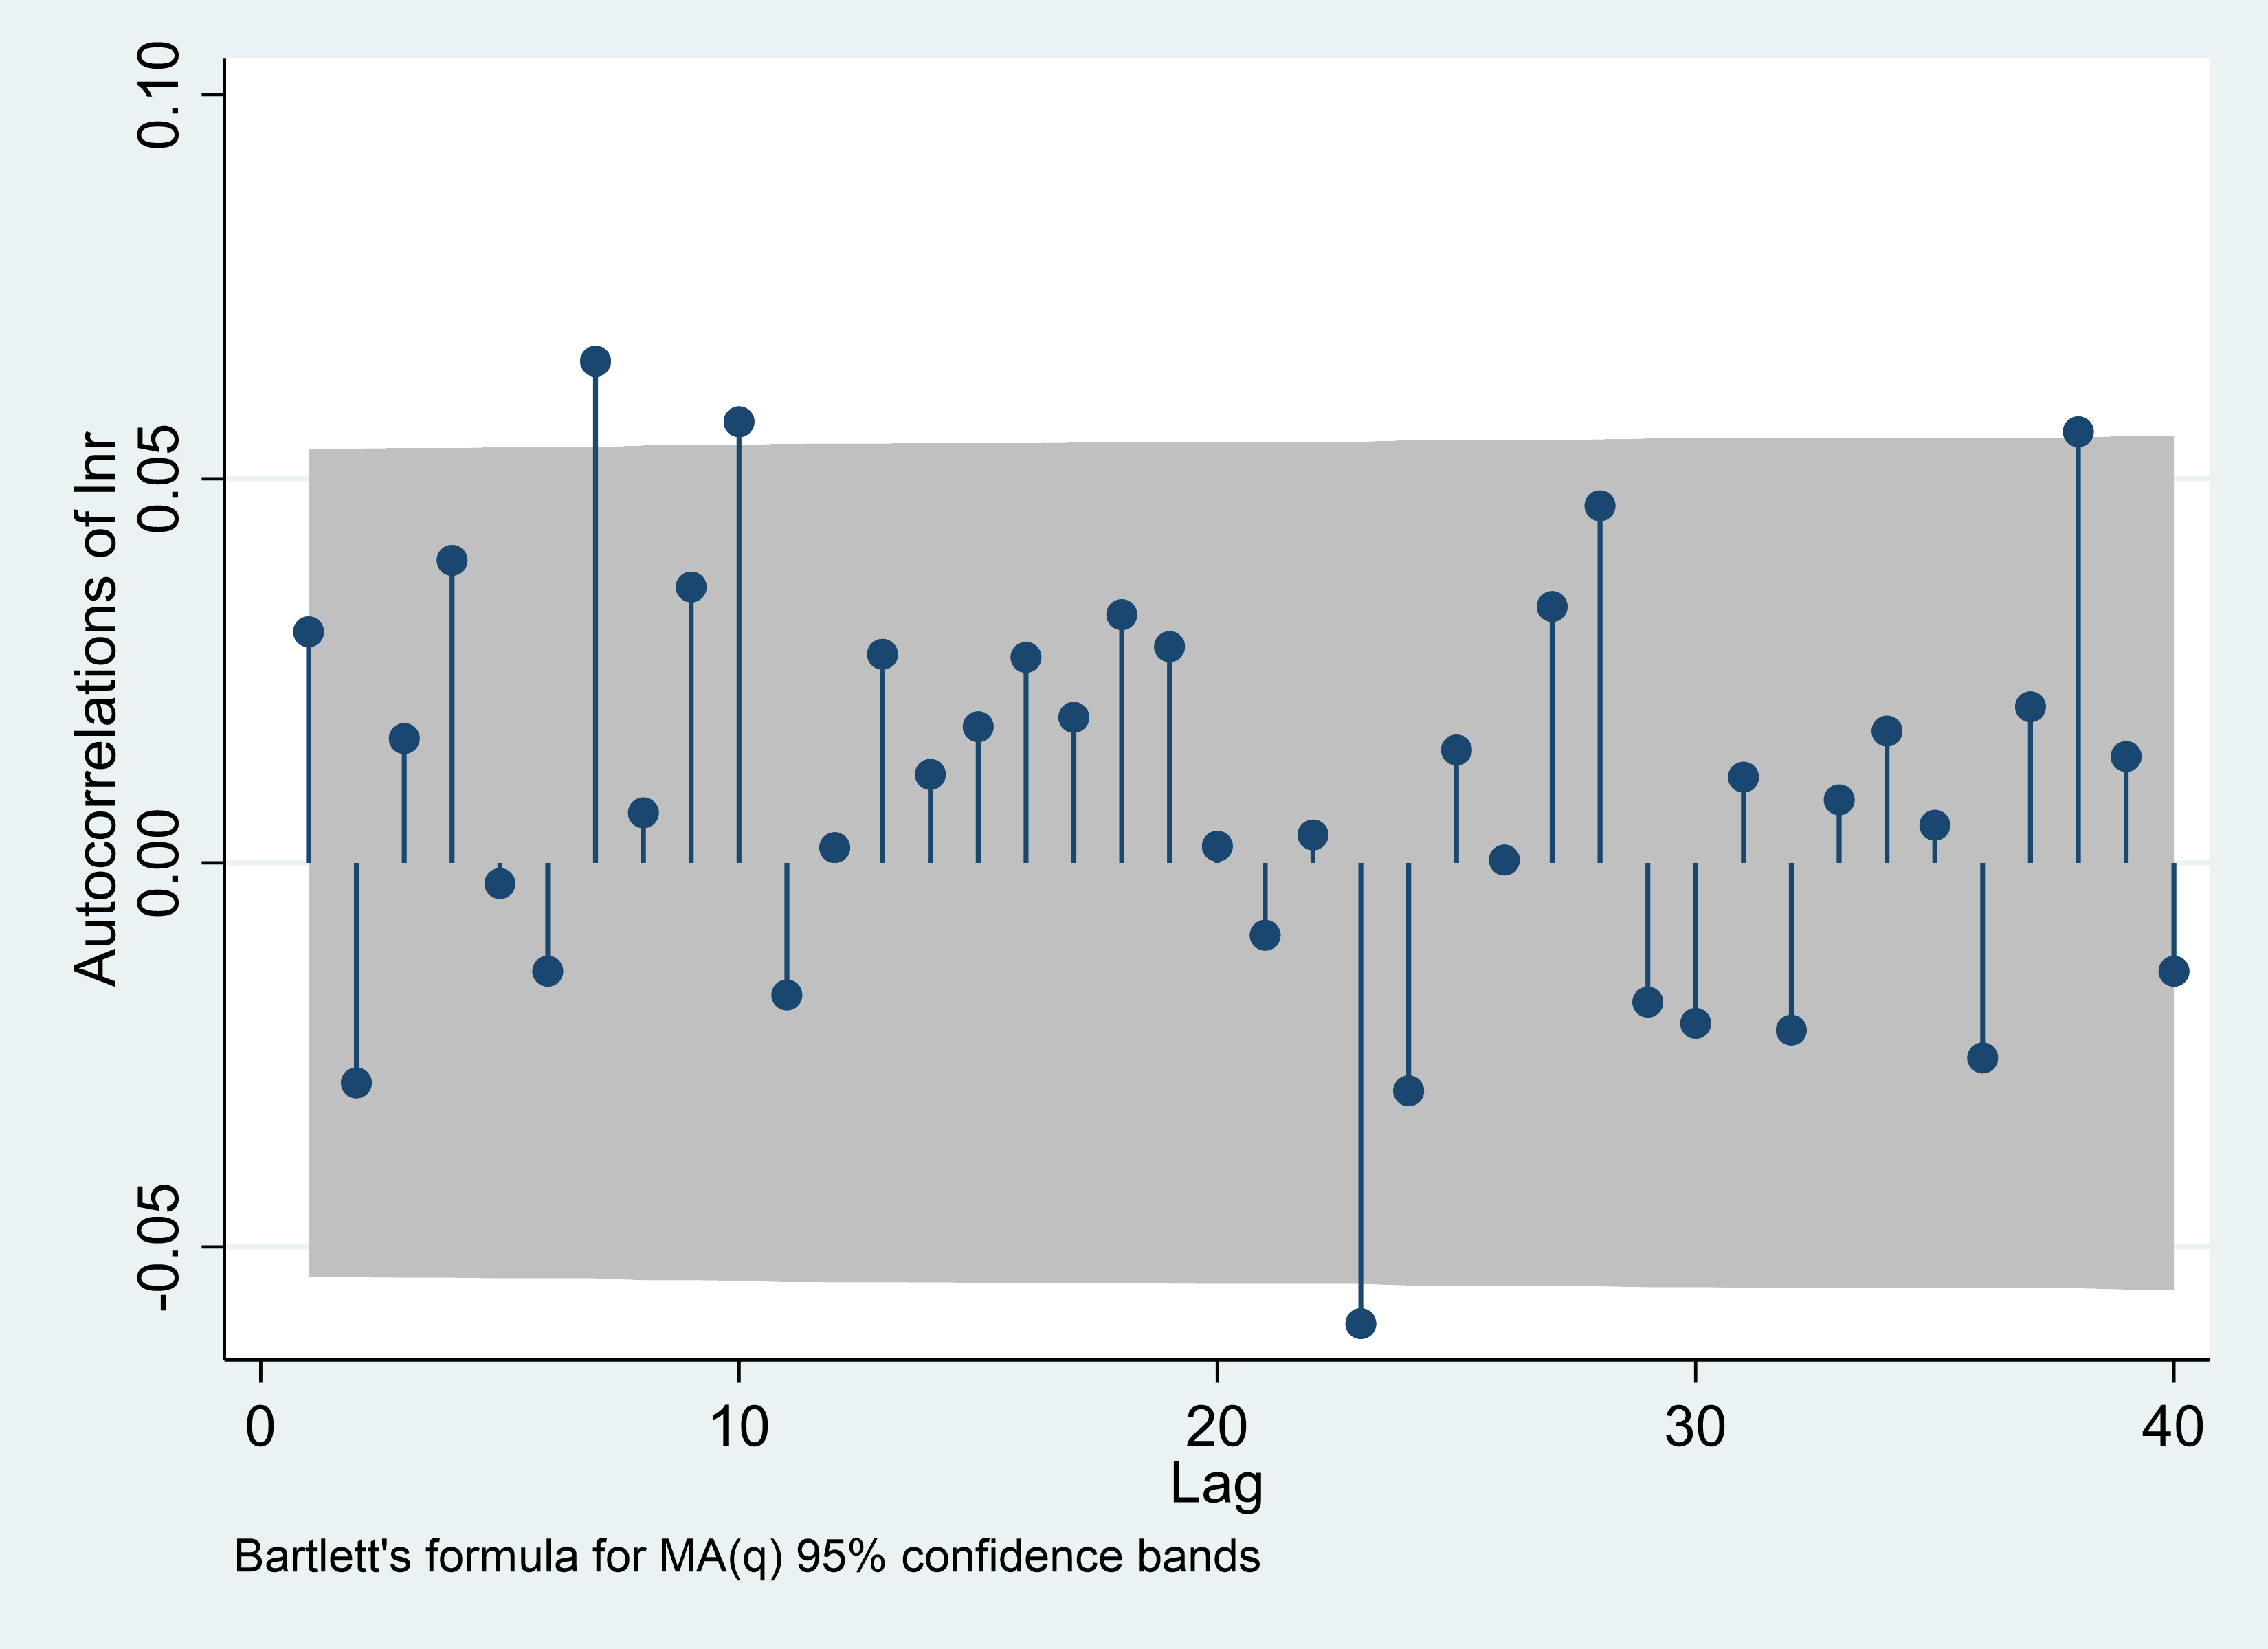
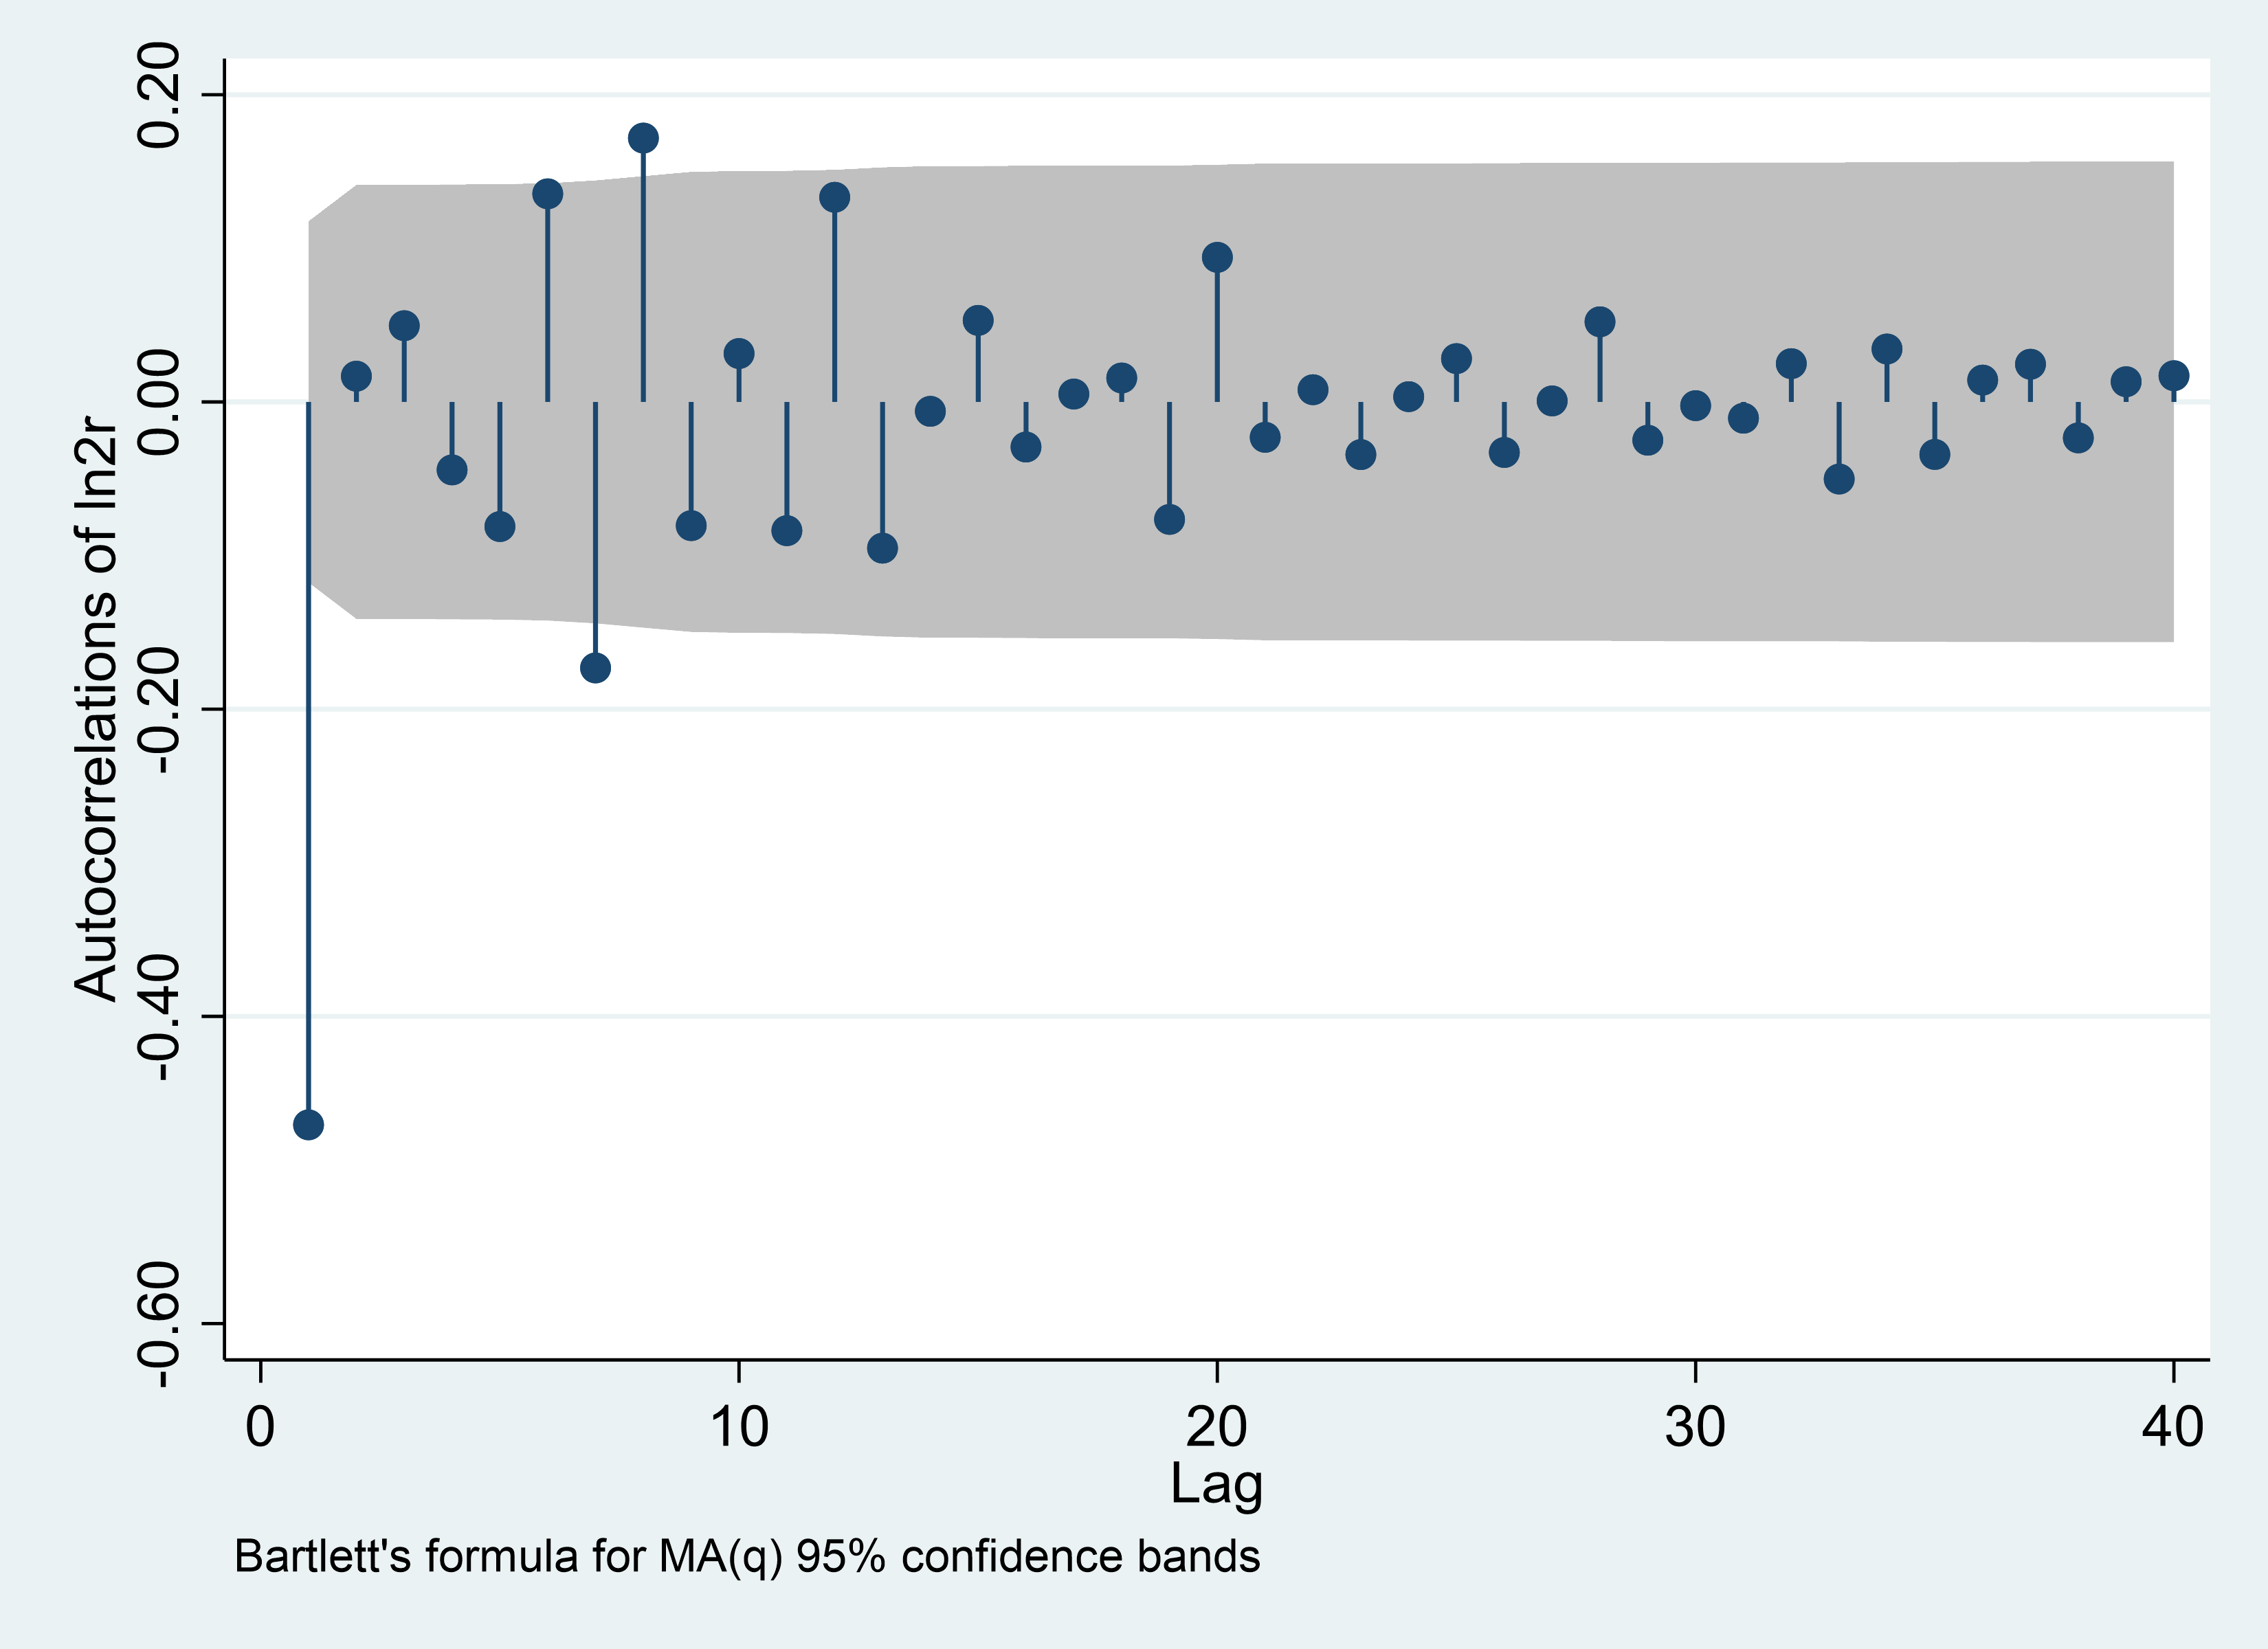
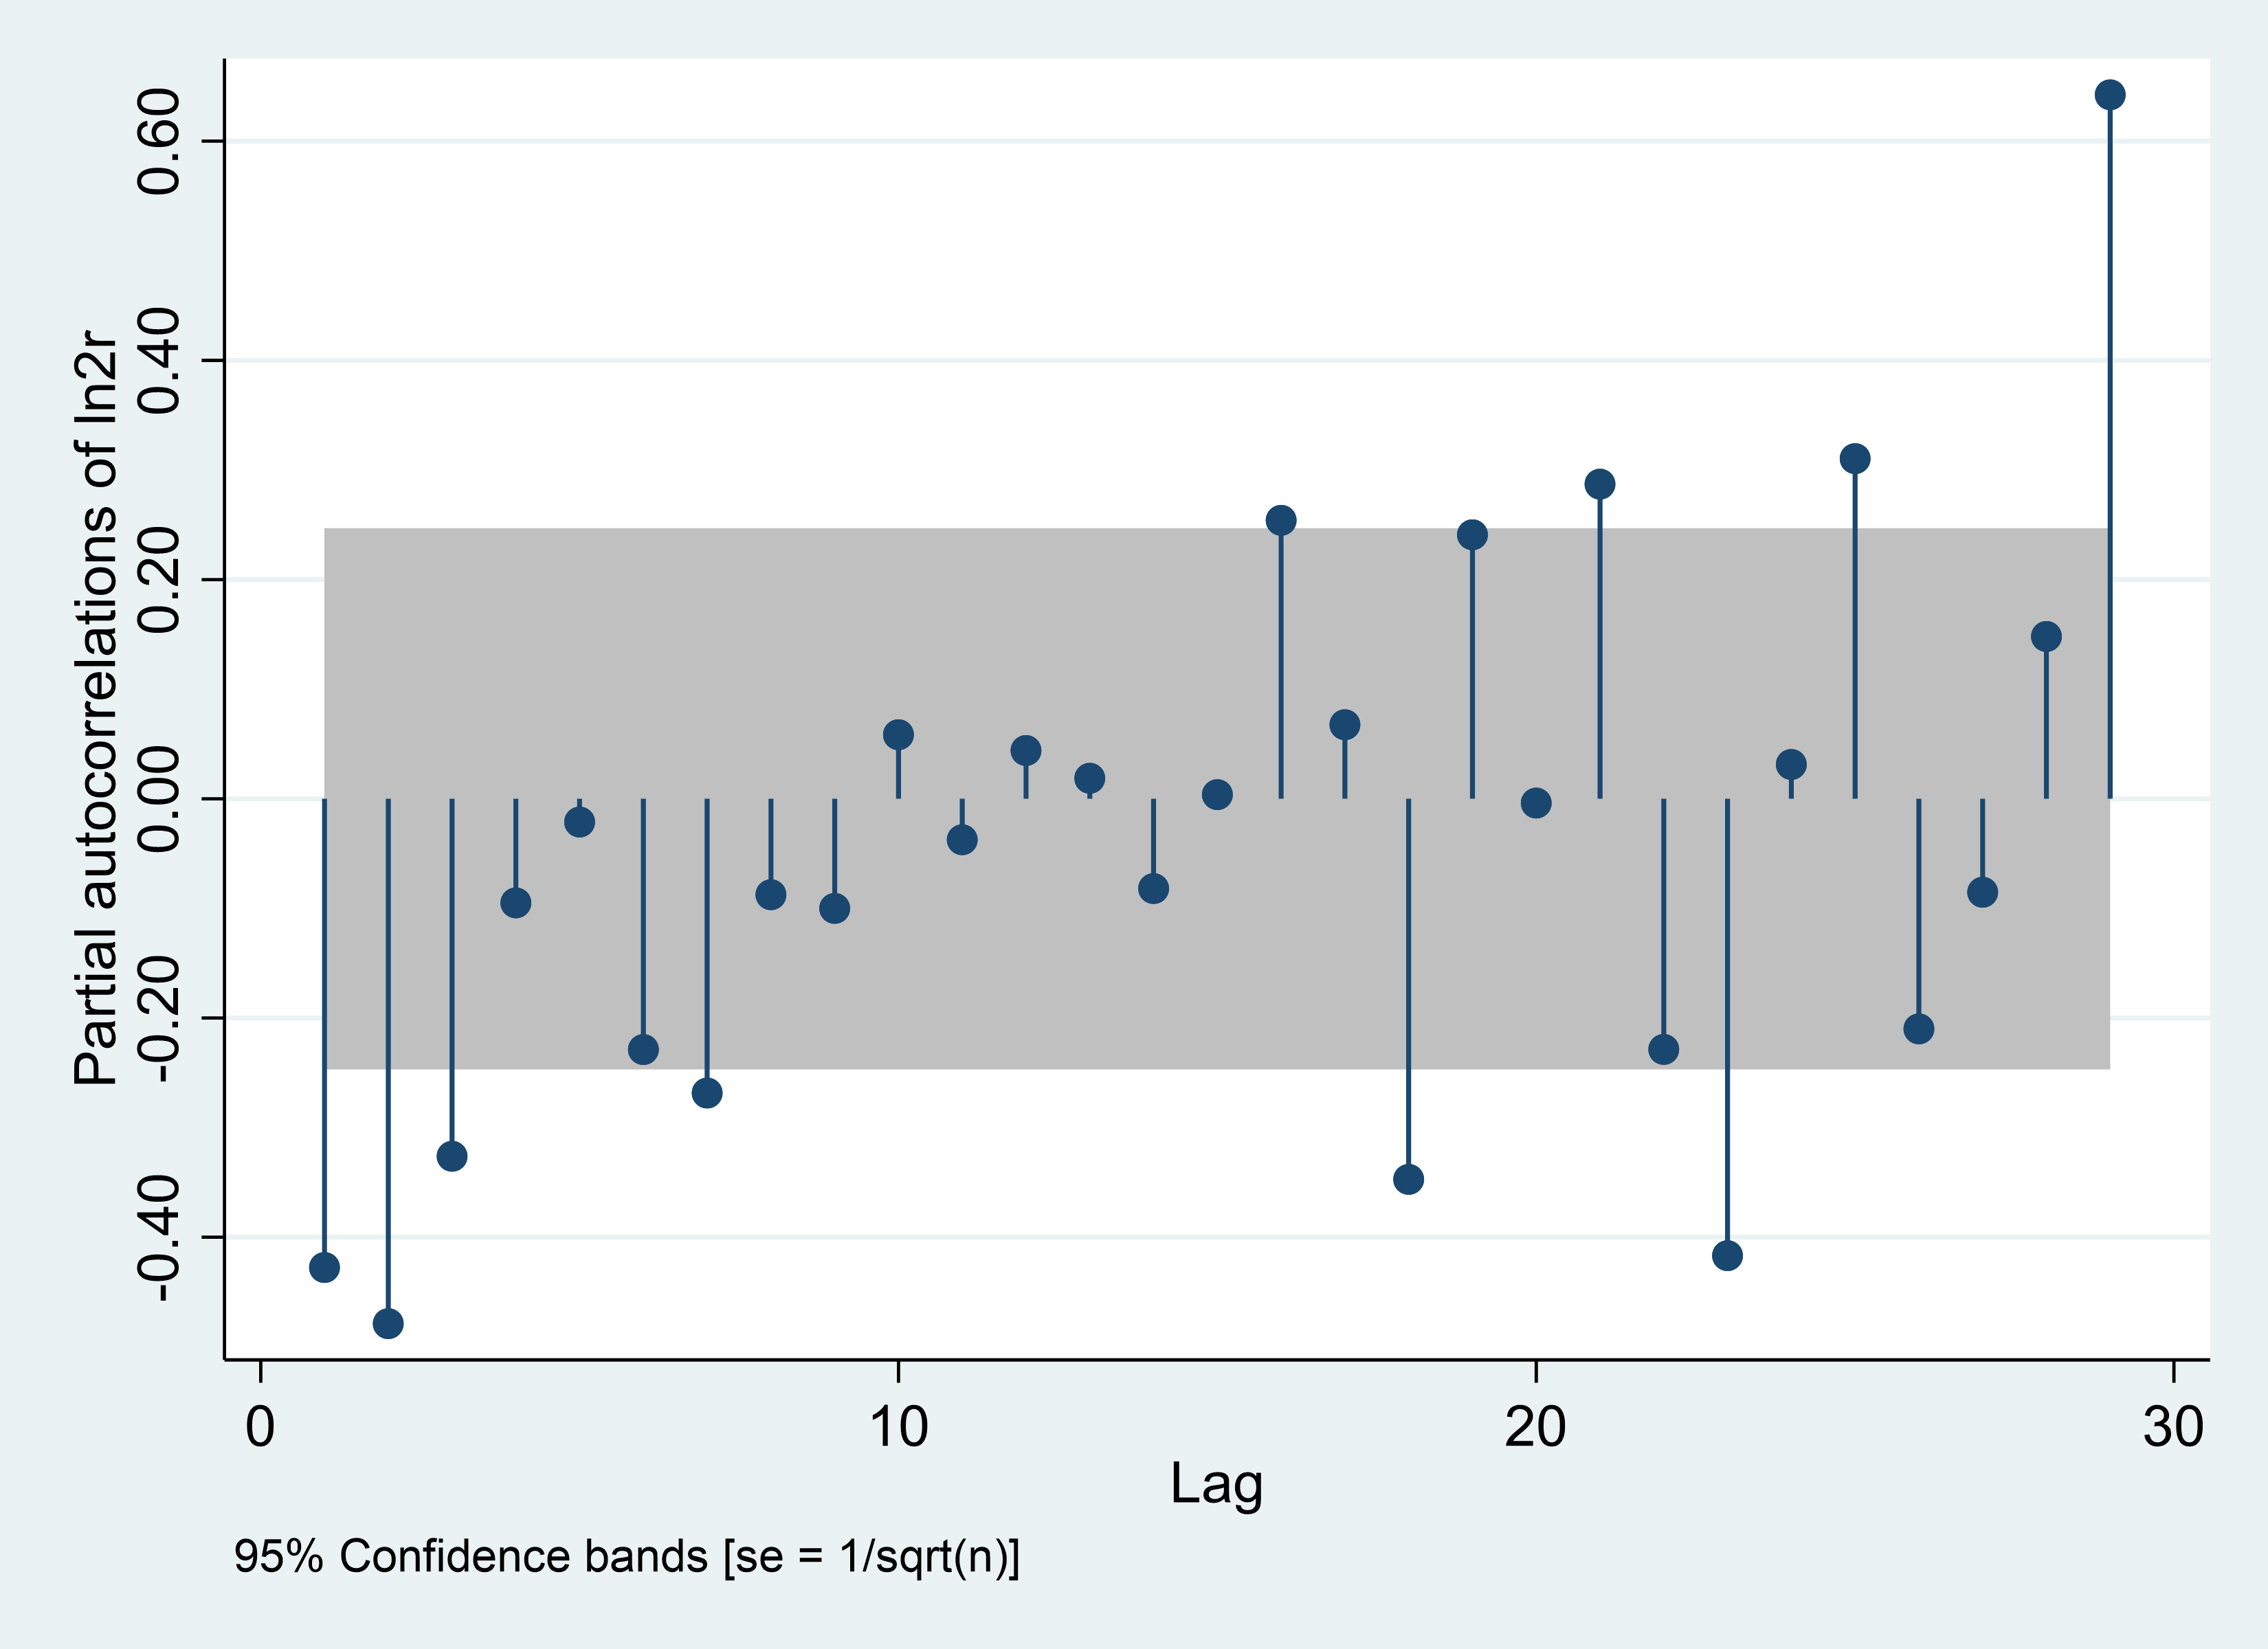
Firstly, this paper needs to order the logarithm of the daily SSEC with first-order difference and the result is showed in the figure above.
According to the result of the two images in the first row in Figure 1, the maximum value of the significant order less than or equal to 10 of x-axis is 10, so AR(P) is of order 10. MA(q) is also of order 10. Thus, the value of p and q is 10.
Then this paper needs to order the logarithm of the weekly SSEC with second-order difference and the result is showed in the figure above.
According to the result of the two images in the second row in Figure 1, the maximum value of the significant order less than or equal to 10 of x-axis is 7, so AR(p) is of order 7. MA(P) is of order 1, so the value of p and q are 7 and 1 respectively.
Finally, this paper needs to order the logarithm of the monthly SSEC with. second-order difference and the result is showed in the figure above.
According to the result of the two images in the third row in Figure 1, the maximum value of the significant order less than or equal to 10 of x-axis is 3, so AR(p) is of order 3. MA(P) is of order 1, so the value of p and q are 3 and 1 respectively.
4.3. Model Testing
This paper uses Portmanteau Q test to check whether the residual sequence is a homogeneous or auto-correlative sequences. The result is shown in Table 2.
Table 2: Residual test.
Model | Portmanteau (Q) statistic | Prob > chi2 |
Daily-ARIMA(10,1,10) | 144.3737 | 0.0000 |
Weekly-ARIMA(7,2,1) | 51.4829 | 0.1054 |
Monthly-ARIMA(7,2,0) | 40.9840 | 0.4272 |
It is found from Table 2 that the Q statistics of the daily data are greater than the critical value, thus the residual sequence is not a white noise process. The Q statistics of the weekly and monthly are both smaller than the critical value, thus both the data are all white noise processes. This conclusion shows that the model setting using weekly and monthly data is more reasonable.
4.4. Prediction
The B-J method adopts L-step prediction, that is, according to the known n-time sequence observations \( {w_{1}},{w_{2}}⋯{w_{n}} \) , to estimate the sequence value of \( n+L \) times in the future. Linear minimum mean squared error method is the most used one. The following gives ARIMA (10,1,10), ARIMA (7,2,1) and ARIMA (3,2,1) to predict the trend of the SSEC after June 18, 2015 respectively, and compare it with the actual trend, as shown in Figures 2, 3 and 4.
Figure 2: Actual value and fitted value, daily. | |
Photo credit: Original | |
Figure 3: Actual value and fitted value, weekly. | |
Photo credit: Original | |
Figure 4: Actual value and fitted value, monthly. | |
Photo credit: Original | |
According to above figures, after June 19, 2015, the actual performance of the SSEC differs obviously from the expected performance. According to the ARIMA model, the SSEC is expected to show an oscillating upward trend in the next two weeks for daily data, while the actual SSEC has sharply declined by 18% in next two weeks. For weekly data, the expected index also shows an upward trend, while the actual SSEC has declined by 10% in a month. And for monthly data, the expected index tends to show a straight upward trend, while in fact the SSEC has shown a cliff-like decline by 25% from Jun 2015 to Aug 2015. Specifically, the average difference in weekly data is 15.90%, as shown in Table 3.
Table 3: Weekly difference.
Year 2015 | 6/21 | 6/28 | 7/5 | 7/12 | 7/19 | 7/26 | 8/2 |
Predicted value | 4565.29 | 4577.00 | 4489.17 | 4625.55 | 4662.24 | 4625.27 | 4791.31 |
Actual value | 4192.87 | 3686.92 | 3877.80 | 3957.35 | 4070.91 | 3663.73 | 3744.20 |
5. Conclusion
This paper studies the impact of SFR on the SSEC from an empirical perspective. In order to obtain the results, this paper use the SSEC data from January 2010 to August 2015 with feasible ARIMA model. Daily, weekly, and monthly data of the SSEC are used to fit the tendency of the ones after June 19, 2015. Compared with the actual trend, it is found that SFR has a significant negative impact on the SSEC.
Most of existing literatures take stock return as the research object, and there is not much research on the index performance. The study in this paper focuses on the SSEC. In addition, the existing research mainly use regression analysis to identify the relationship between SFR and stock market, and rarely use the method of predicting the index to study the one. This paper mainly uses ARIMA model to predict the SSEC, which can reflect the degree to which SFR has affected the SSEC.
SFR have a strong short-term impact on the stock market, and it is necessary to reduce the likelihood of SFR from a policy perspective. Three policy proposals are put forward as following. Improve the censorship of local government debt issuance, rationally plan the use of debt funds, and promote bond market-oriented reform. Improve the financial prevention and control system, steadily promote the internationalization of RMB cross-border settlement, and construct a domestic and international double-cycle pattern. Strengthen corporate information disclosure to make financial market more transparent and avoid financial manipulation.
In a word, the conclusions of this paper may be used to help investors to identify investment risks and discover investment opportunities. Consideration can be given to combine other forecasting factors such as the stock market’s own institutional factors, national macroeconomic policies, and the domestic and foreign market environment. These factors also have certain research value to the stock market. Using this model to make short-term forecasts of the overall market trend can provide investors with a basis for investment decisions.
References
[1]. Xiaopu, Z. (2010). A study on systemic financial risk:evolution,causes and supervision. Studies of International Finance.
[2]. Rong-Cai, H. U. (2010). New characteristics of policy market in china’s stock market. The Theory and Practice of Finance and Economics.
[3]. Shu-Lin, W., & Zhen-Xi, Z. Design suggestions to the financial products based on the population characteristics of investors. Journal of Harbin Institute of Technology.
[4]. Al-Qudah, A. (2013). The effect of financial leverage & systematic risk on stock returns in the amman stock exchange (analytical study – industrial sector). Research Journal of Finance & Accounting, vol.4(No.6), 136-145.
[5]. Nugroho, M., Arif, D., & Halik, A. (2021). The effect of financial distress on stock returns, through systematic risk and profitability as mediator variables. Accounting.
[6]. MAGHSOUD, Hosein†, RAHNAMAY-ROODPOSHTI, Fraydoon´, & VAKILIFARD. The impact of time-varying systemic risk on predicting the dynamics of stock return volatility in tehran stock exchange.
[7]. Zolotoy, L. Informations Shocks, Systemic Risk and the Fama-French Model: Evidence from the US Stock Market.
[8]. Yang Z H, Chen Y T, Zhang P M. (2020). Macroeconomic shock, financial risk transmission and governance response to major public emergencies. Management World, 36(5), 25.
[9]. Yang, L. (2008). The systematic liquidity risk and premium of shanghai stock exchange. Chinese Journal of Management.
[10]. Shengyao, L. Yi-Tsung, L. , & Yunhong, Y. . (2016). The systematic crash risk and investor preference in chinese stock market. Journal of Financial Research.
[11]. Box, G. E. P., Jenkins, G. M., & Reinsel, G. C. (1976). Time series analysis forecasting and control - rev. ed. Journal of Time, 31(2), 238-242.
Cite this article
Li,Y. (2023). The Impact of Systemic Financial Risks on the Shanghai Composite Index: Evidence from ARIMA Model. Advances in Economics, Management and Political Sciences,56,56-63.
Data availability
The datasets used and/or analyzed during the current study will be available from the authors upon reasonable request.
Disclaimer/Publisher's Note
The statements, opinions and data contained in all publications are solely those of the individual author(s) and contributor(s) and not of EWA Publishing and/or the editor(s). EWA Publishing and/or the editor(s) disclaim responsibility for any injury to people or property resulting from any ideas, methods, instructions or products referred to in the content.
About volume
Volume title: Proceedings of the 2nd International Conference on Financial Technology and Business Analysis
© 2024 by the author(s). Licensee EWA Publishing, Oxford, UK. This article is an open access article distributed under the terms and
conditions of the Creative Commons Attribution (CC BY) license. Authors who
publish this series agree to the following terms:
1. Authors retain copyright and grant the series right of first publication with the work simultaneously licensed under a Creative Commons
Attribution License that allows others to share the work with an acknowledgment of the work's authorship and initial publication in this
series.
2. Authors are able to enter into separate, additional contractual arrangements for the non-exclusive distribution of the series's published
version of the work (e.g., post it to an institutional repository or publish it in a book), with an acknowledgment of its initial
publication in this series.
3. Authors are permitted and encouraged to post their work online (e.g., in institutional repositories or on their website) prior to and
during the submission process, as it can lead to productive exchanges, as well as earlier and greater citation of published work (See
Open access policy for details).
References
[1]. Xiaopu, Z. (2010). A study on systemic financial risk:evolution,causes and supervision. Studies of International Finance.
[2]. Rong-Cai, H. U. (2010). New characteristics of policy market in china’s stock market. The Theory and Practice of Finance and Economics.
[3]. Shu-Lin, W., & Zhen-Xi, Z. Design suggestions to the financial products based on the population characteristics of investors. Journal of Harbin Institute of Technology.
[4]. Al-Qudah, A. (2013). The effect of financial leverage & systematic risk on stock returns in the amman stock exchange (analytical study – industrial sector). Research Journal of Finance & Accounting, vol.4(No.6), 136-145.
[5]. Nugroho, M., Arif, D., & Halik, A. (2021). The effect of financial distress on stock returns, through systematic risk and profitability as mediator variables. Accounting.
[6]. MAGHSOUD, Hosein†, RAHNAMAY-ROODPOSHTI, Fraydoon´, & VAKILIFARD. The impact of time-varying systemic risk on predicting the dynamics of stock return volatility in tehran stock exchange.
[7]. Zolotoy, L. Informations Shocks, Systemic Risk and the Fama-French Model: Evidence from the US Stock Market.
[8]. Yang Z H, Chen Y T, Zhang P M. (2020). Macroeconomic shock, financial risk transmission and governance response to major public emergencies. Management World, 36(5), 25.
[9]. Yang, L. (2008). The systematic liquidity risk and premium of shanghai stock exchange. Chinese Journal of Management.
[10]. Shengyao, L. Yi-Tsung, L. , & Yunhong, Y. . (2016). The systematic crash risk and investor preference in chinese stock market. Journal of Financial Research.
[11]. Box, G. E. P., Jenkins, G. M., & Reinsel, G. C. (1976). Time series analysis forecasting and control - rev. ed. Journal of Time, 31(2), 238-242.