


1. Introduction
2016 Trump during the presidential campaign, trump claim basis USA trade law section 201 and section 301 to imposing tariffs on China. He hopes to reduce USA trade deficit and boost the economy [1]. Along with rise of the China economy, USA economic policy toward China has undergone drastic changes under recent president. During the Clinton administration, China and US was “strategic partnership”. During the Bush administration, the US household investment developed rapidly, (come to recession during 2008). A huge amount of desire on borrowing come to place and China, on the same time, was experiencing a dramatic development after the policy of reform and open. Therefore, China is willing to loan out money to exchange for greater return in the future, so that President Bush claimed that relationship between China and US was “responsible stakeholder country”. During the Obama administration China and US was “mutual respect, mutual benefit and win-win partnership”, challenge change have taken place in Sino-US relation [2]. In August 2017 Trump according US trade law section 301 to investment about China infringes us intellectual property exhibition [3]. This move is considered the first direct trade measure in the US and China trade war.
On March 22, 2018, US president Trump signed a trade memorandum with China at the white house and increased tariffs on some products from China. This represents the start of the US and China trade war, this trade war dispute has resulted in repeated tariff increase.
On the December 1, at the G20 summit in Argentina, Chinese president Xi met with us president Trump and reached a proposal for a 90 day truce [4]. The traded war in the 2019 caused by Huawei being included in the list of controlled entities, mainly occurred in the two fields. The first one industry is China has advantages, for instance light industry, the second industry is China don’t have advantages, such as the semiconductor industry. US sanctions against China are mainly focused on the semiconductor industry [5].
Some scholars discuss and analyze and discuss the direction of the current round of trade friction between China and US from the perspective of going beyond the trade relationship between China and the US and even beyond the two economic relationships between the two countries. Goals1, to ease the trade deficit Goals. Goals 2, to combat China’s advanced manufacturing and high-tech industries. Goals 3, require China’s to fully open its financial industry [6].
In this Sino-US trade war, the area where China is taxed include: semiconductors and some high-end products. basically, no impact. For example, in the short term, the United States has an impact on China’s shipping industry. The main impact on China’s shipping industry is that the trade war’s psychology impact on us shippers may affect the promotion of the hot season [7].
From the perspective of the forestry industry, trade protectionism will not only not make the timber harvesting and processing industry in the United States grow stronger, but will accelerate the shrinkage of th timber industry, which is contrary to the trump administration’s “manufacturing return” concept [8].
From the perspective of the semiconductor industry, the United States is trying to use the “trade war “to attack the developing of my country’s high-tech industry. In the long run, it will not be effective at all, but in the short terms, it will have some adverse effects on my country’s technological developing, which is in line with our prediction [9].
2. Research Design
2.1. Data Source
This article uses the search engine Investing [10] to obtain and search the index of chip industry and this paper obtain opening price, closing price stock yield and expense. And process it and divide it into daily weekly monthly and intercept the data from 2010 to 2020.
2.2. Weak Stationarity Test
A stationarity test is required for this model in order to identify whether the model is smooth enough so that a forecast method can be decided (The assumption of the model is not smooth initially). In this article, the manipulation on the whole data set is taking the first and second order difference so that the construction of a smooth model is completed. The result of ADF test on STATA is represented below, in table 1, no matter the daily, weekly, and monthly data, the p-value of them is 0 after the first and second order difference, which implied that the null hypothesis about the data set is not stationary can be rejected. In conclusion, the entire data frame passes the stationarity test after the first and second order difference.
Table 1: Weak stationarity test.
t | p | |
Daily | ||
Raw | -2.864 | 0.1745 |
1st order difference | -26.753 | 0.0000 |
Weekly | ||
Raw | -2.980 | 0.1376 |
1st order difference | -11.864 | 0.0000 |
2nd order difference | -20.616 | 0.0000 |
Monthly | ||
Raw | -2.677 | 0.2456 |
1st order difference | -6.549 | 0.0000 |
2nd order difference | -9.358 | 0.0000 |
2.3. ARIMA Specification
ARIMA model is the combination of AR and MA model, first, AR model is an autoregressive model, which is a prediction method that use historical information to predict the future performance of data. It requires the data frame to meet some specific smoothness tests, so that past historical data can reliably estimate horizontal data. The first order form of autoregressive model can express as:
\( {Y_{t}}=c+φ{Y_{T-1}}+{ξ_{t}} \) (1)
Among them, \( {Y_{t}} \) reference to observed value at time t, c is constant, \( φ \) is the autoregressive coefficient, \( {Y_{T-1}} \) is the observed value at time T-1, and \( {ξ_{t}} \) is the error value.
When the autoregressive model is of order p, the model can be expressed as:
\( {Y_{t}}=c+{φ_{1}}{Y_{T-1}}+{φ_{2}}{Y_{T-2}}⋯+{φ_{p}}{Y_{T-p}}+{ξ_{t}} \) (2)
Among them \( {φ_{1}} \) , \( {φ_{2}} \) , \( {φ_{p}} \) is the autoregressive coefficient.
Second, the MA model, in the way opposite with AR model, doesn’t rely on the historical data. It is defined based on the white noise sequence (a sequence that the past and future data is not correlated and only fluctuated around a specific mean value) The basic ideas of MA model is: most of time series should be relatively stable. On the stable basis, the tag value at each point in time is fluctuated in a determined pattern by various unforeseen contingencies in the past period of time. That is within period of time, the time serious should fluctuate around a certain mean value. The label at the time point of the sequence will move around a certain mean value.
In summary, the ARIAM model is to speculate the future through past data.
MA model can be expressed as:
\( {Y_{t}}=μ+{θ_{1}}{ϵ_{t-1}}+{θ_{2}}{ϵ_{t-2}}+⋯+{θ_{q}}{ϵ_{t-q}} \) (3)
The ARIMA model can be expressed as:
\( {x_{t}}={∅_{0}}+\sum _{I=1}^{P}{∅_{i}}{x_{t-i}}+{a_{i}}-\sum _{i=1}^{q}{∅_{i}}{a_{t-i}} \) (4)
3. Empirical Results and Analysis
3.1. Order Identification
PACF of stationary time series is a function of ACF, and PACF is introduce through ACF.
\( {X_{t}}={ϕ_{0,1}}+{ϕ_{1,1}}{X_{t-1}}+{e_{1t}} \) (5)
\( {X_{t}}={ϕ_{0,2}}+{ϕ_{1,2}}{X_{t-1}}+{ϕ_{2,2}}{X_{t-2}}+{e_{2t}} \) (6)
\( {X_{t}}={ϕ_{0,3}}+{ϕ_{1,3}}{X_{t-1}}+{ϕ_{2,3}}{X_{t-2}}+{ϕ_{3,3}}{X_{t-3}}+{e_{3t}} \) (7)
\( {X_{t}}={ϕ_{0,4}}+{ϕ_{1,4}}{X_{t-1}}+{ϕ_{2,4}}{X_{t-2}}+{ϕ_{3,4}}{X_{t-3}}+{ϕ_{4,4}}{X_{t-4}}+{e_{4t}} \) (8)
ACF is independent of any particular time t and is a function of the time interval h Expressed:
\( {p_{h}}=p({x_{t}},{x_{t+h}})=\frac{cov({x_{t}},{x_{t+h}})}{{σ_{t}}{σ_{t+h}}} \) (9)
Among them, h is the interval, describing the correlation between the variable sequence and the sequence of its own interval time h. \( ({x_{t}},{x_{t+h}}) \) covariance of the two sets of vectors. \( {σ_{t}}{σ_{t+h}} \) the standard deviation of the two sets of vectors.
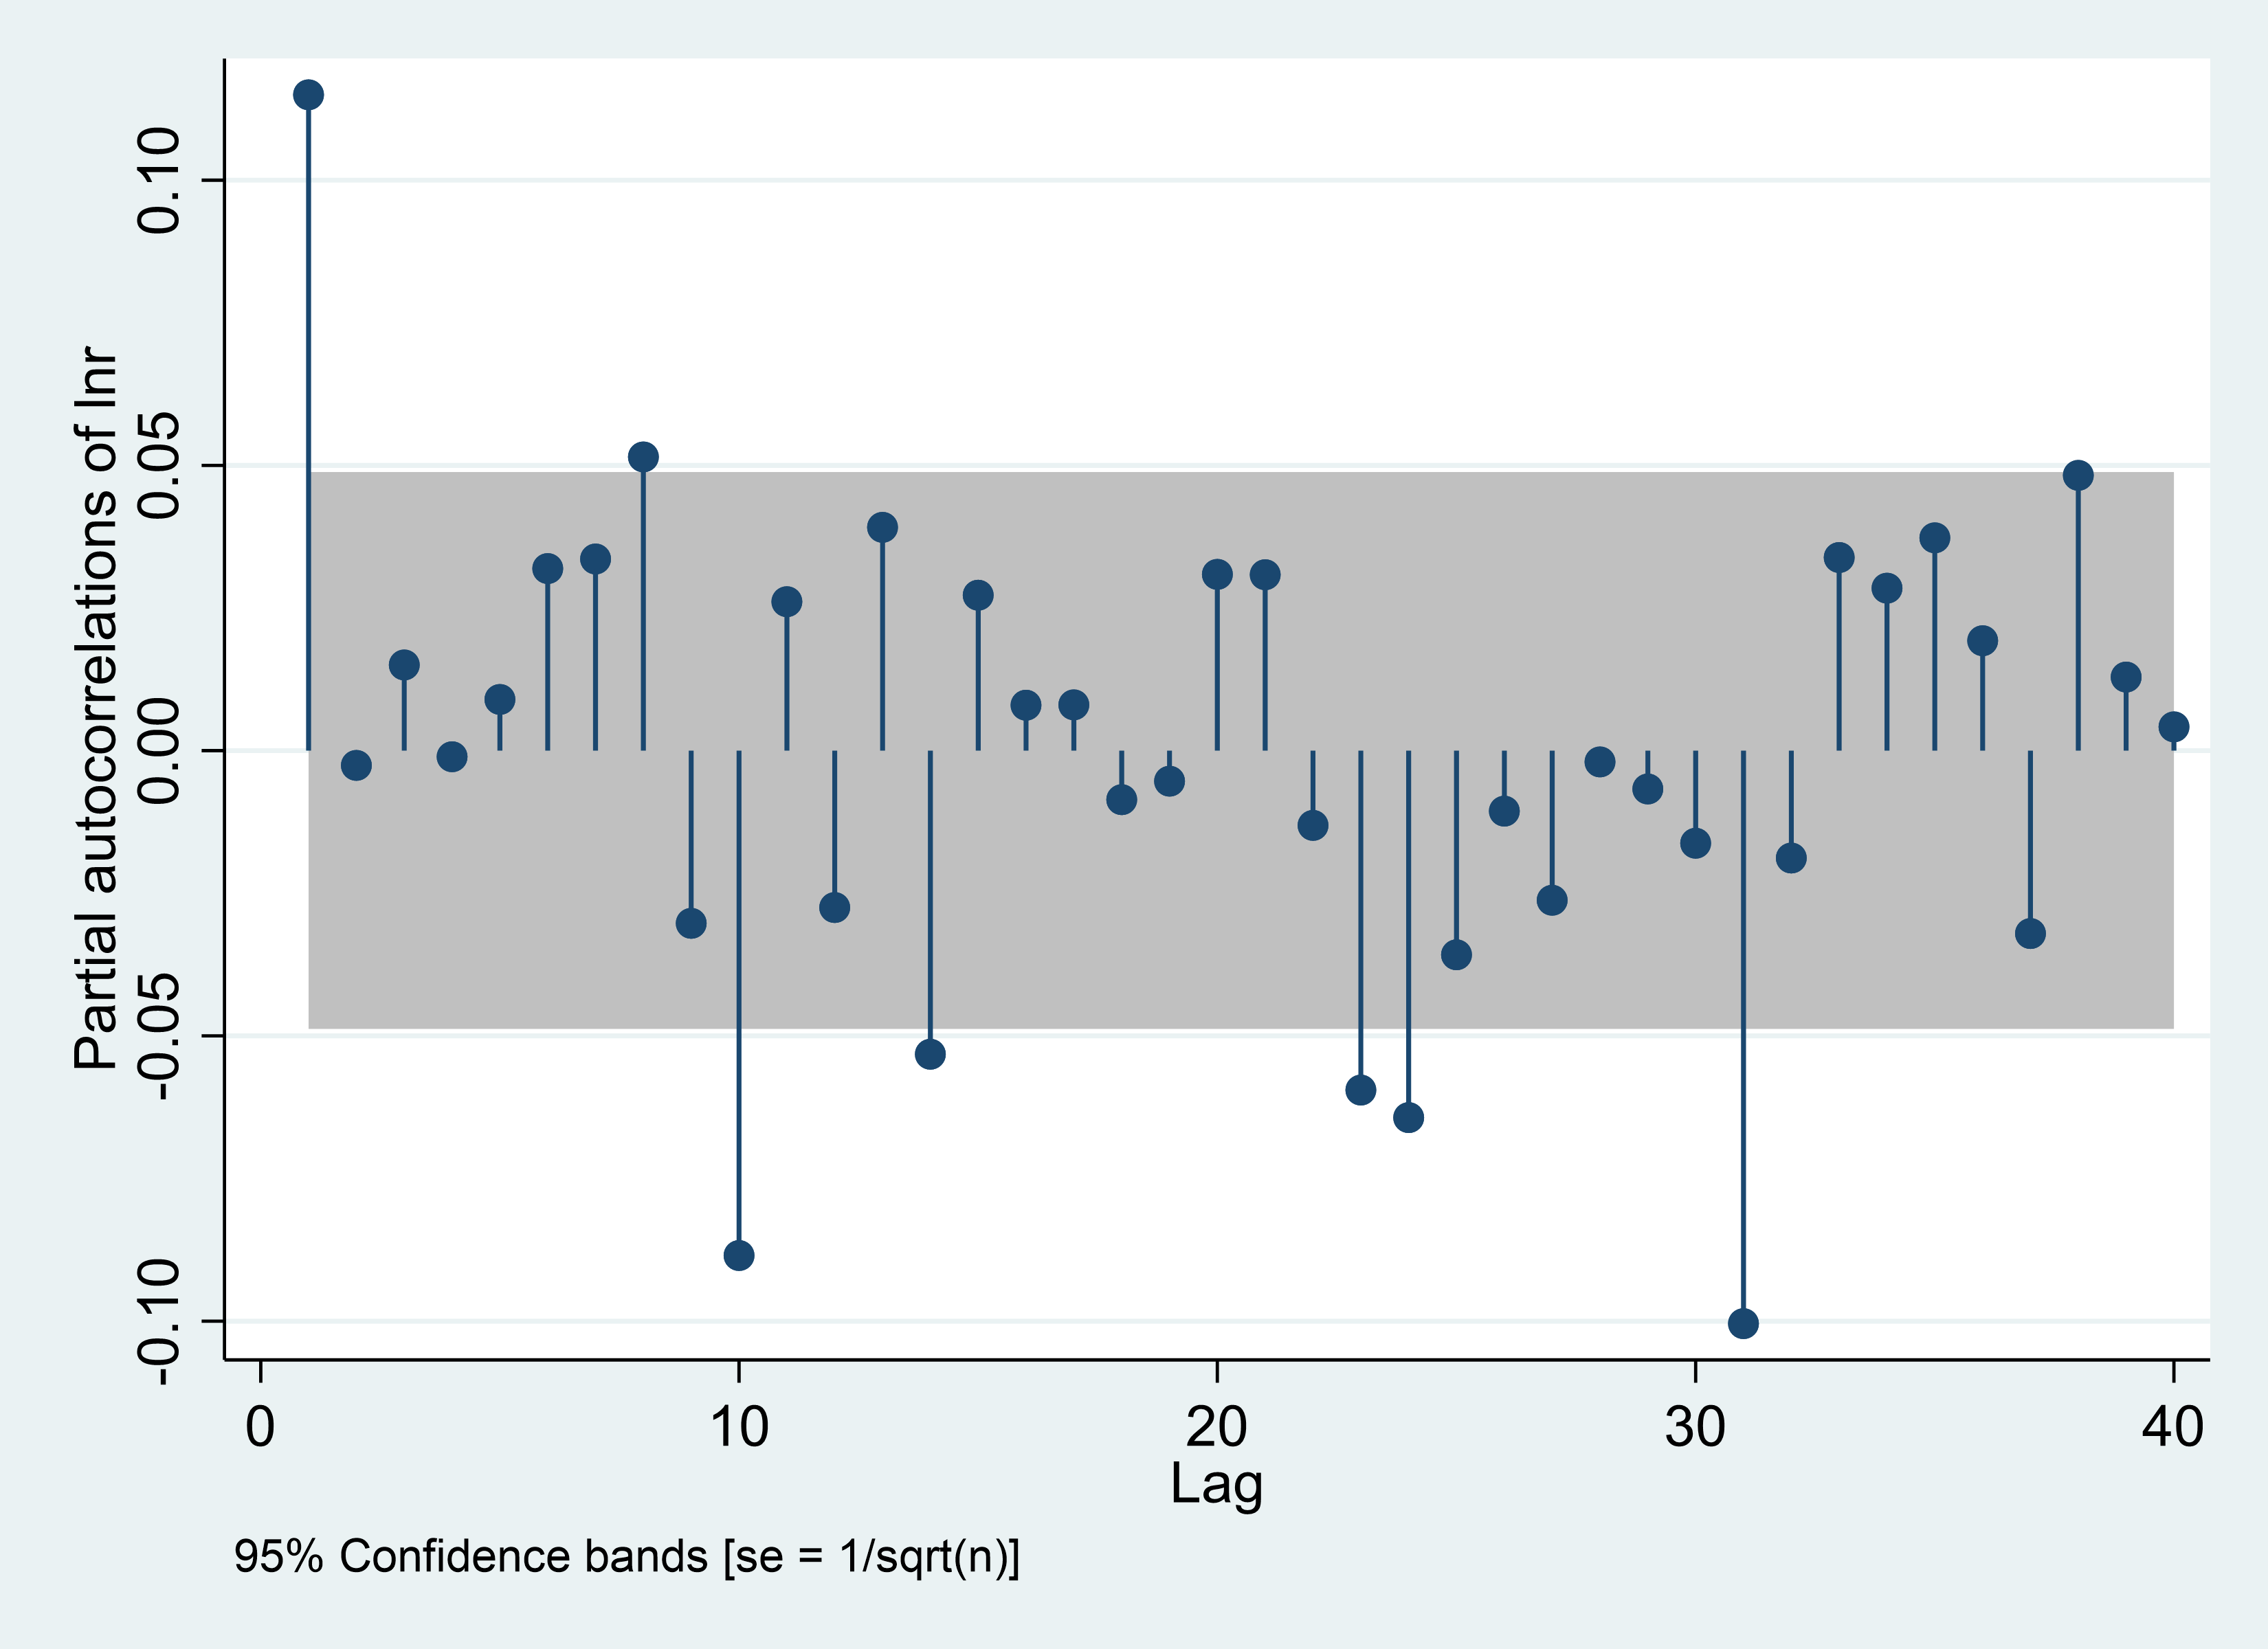
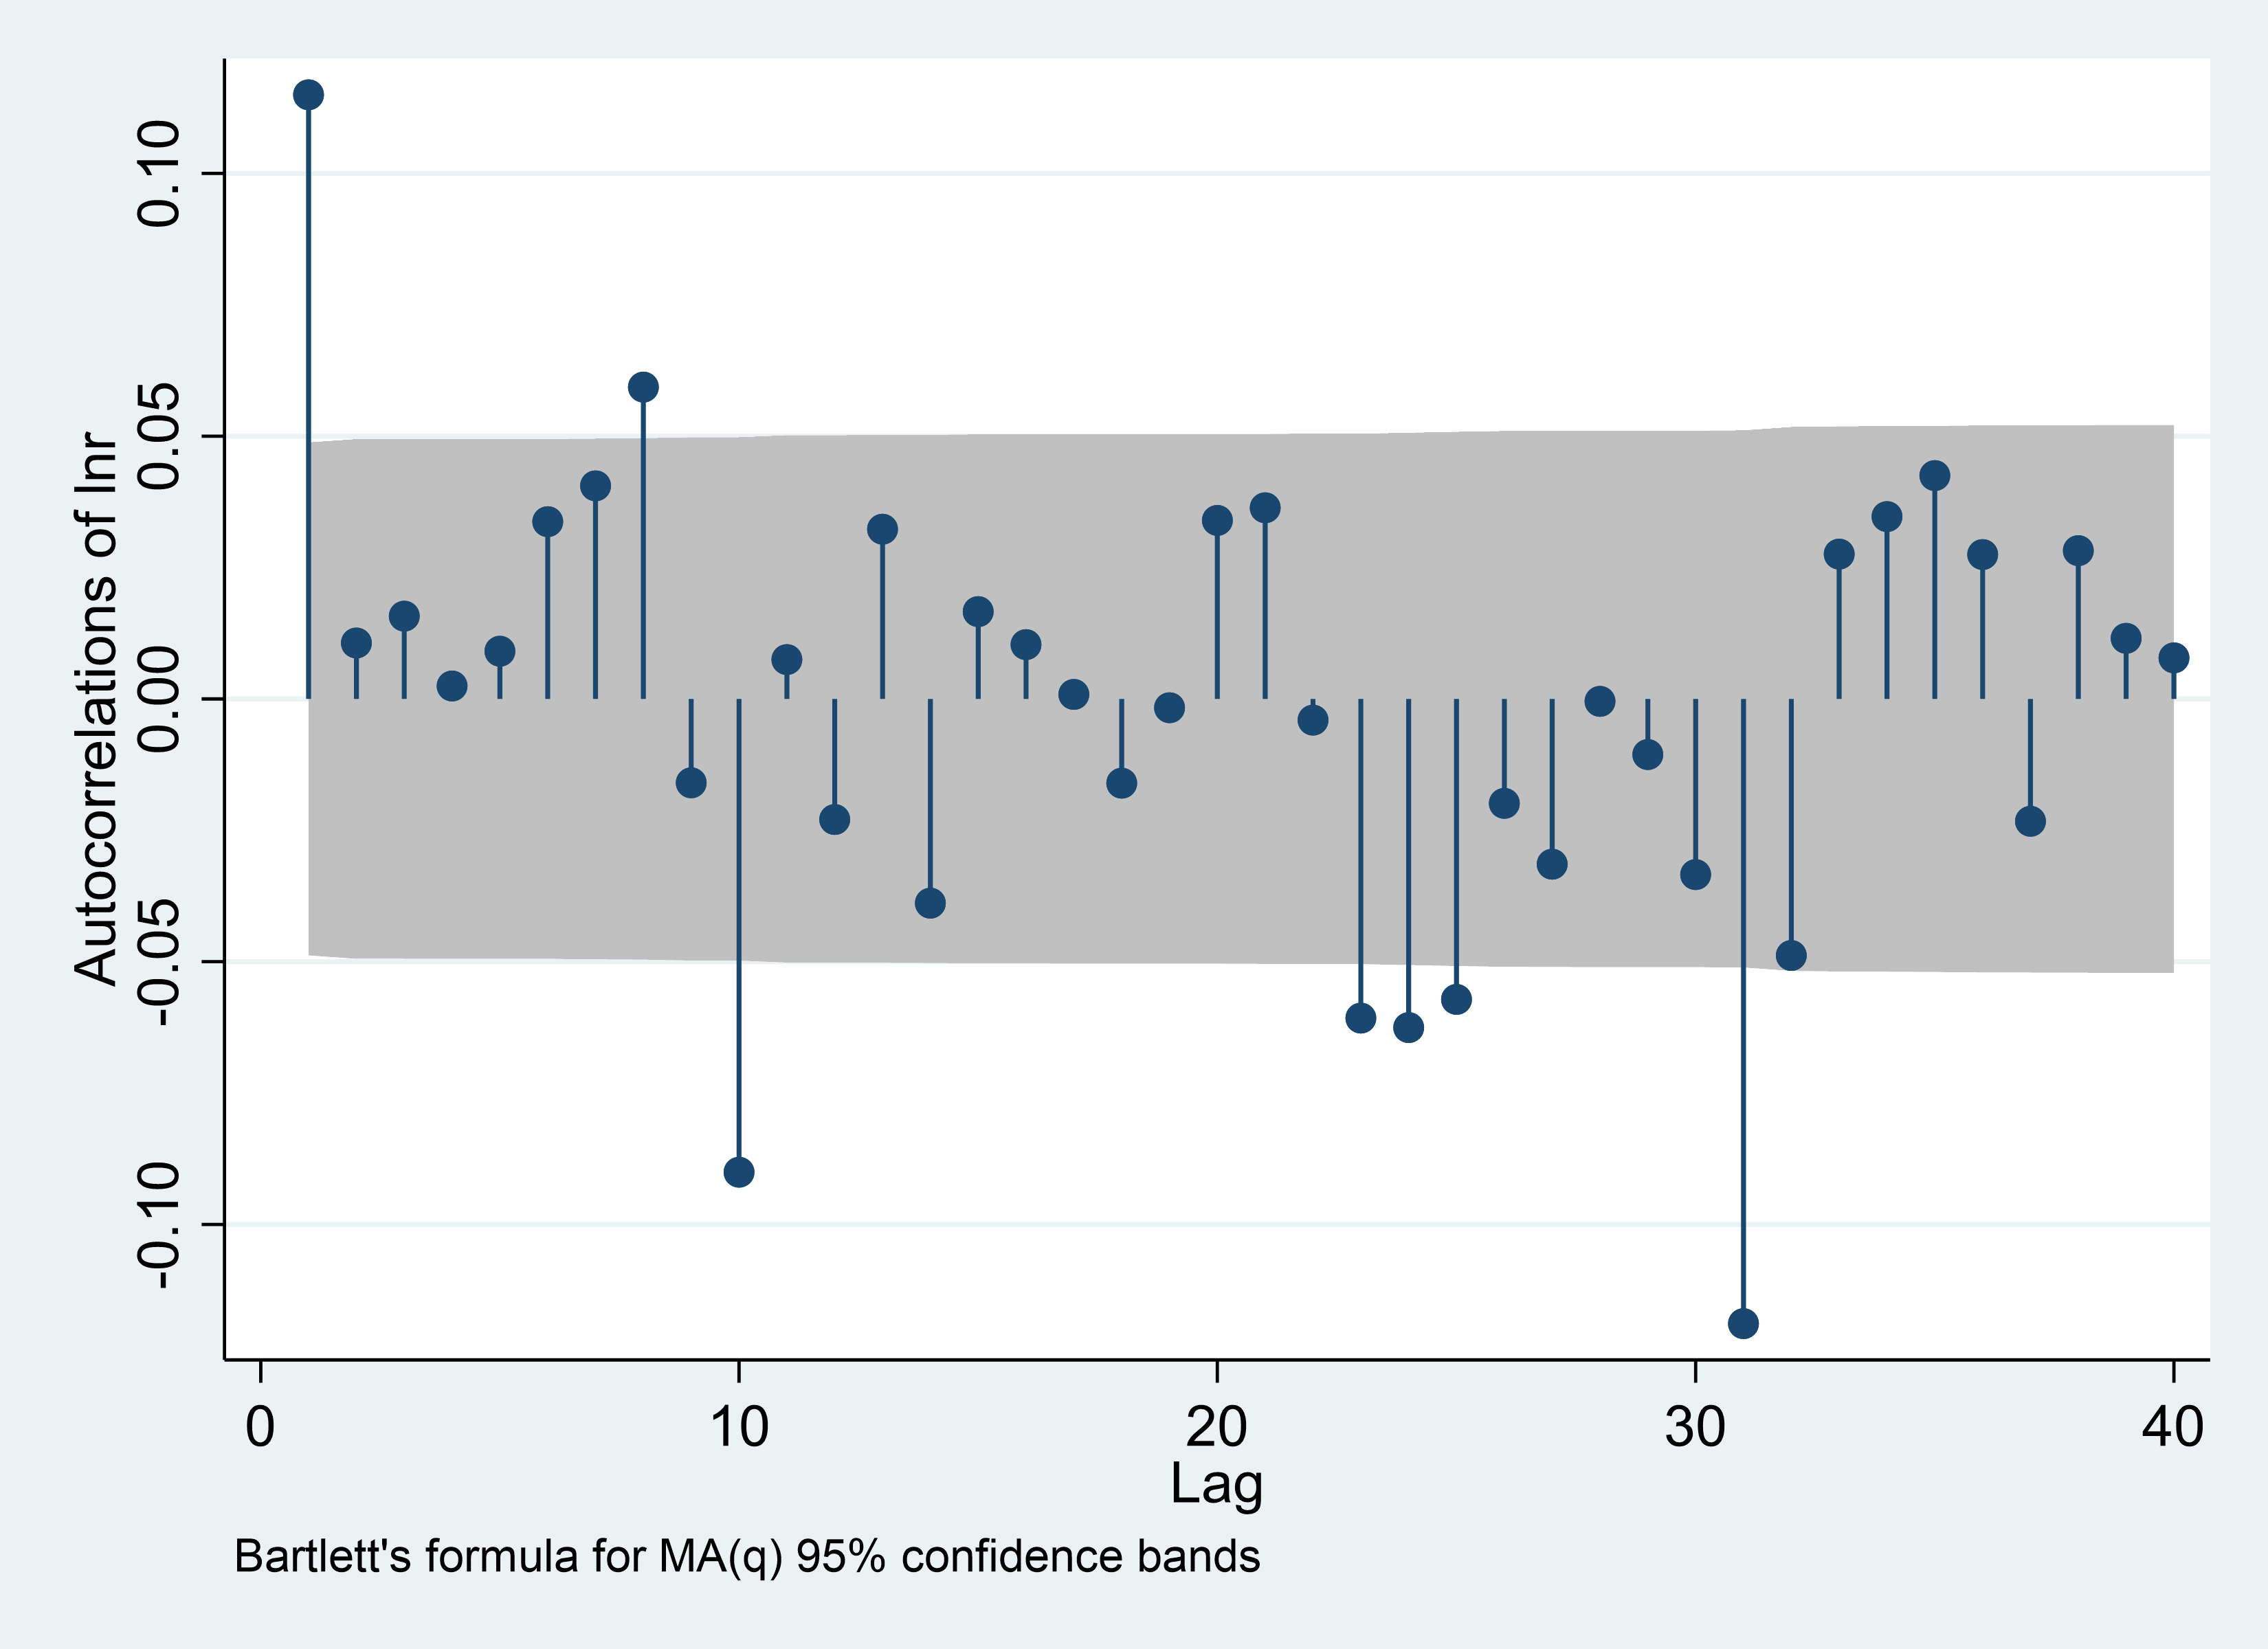
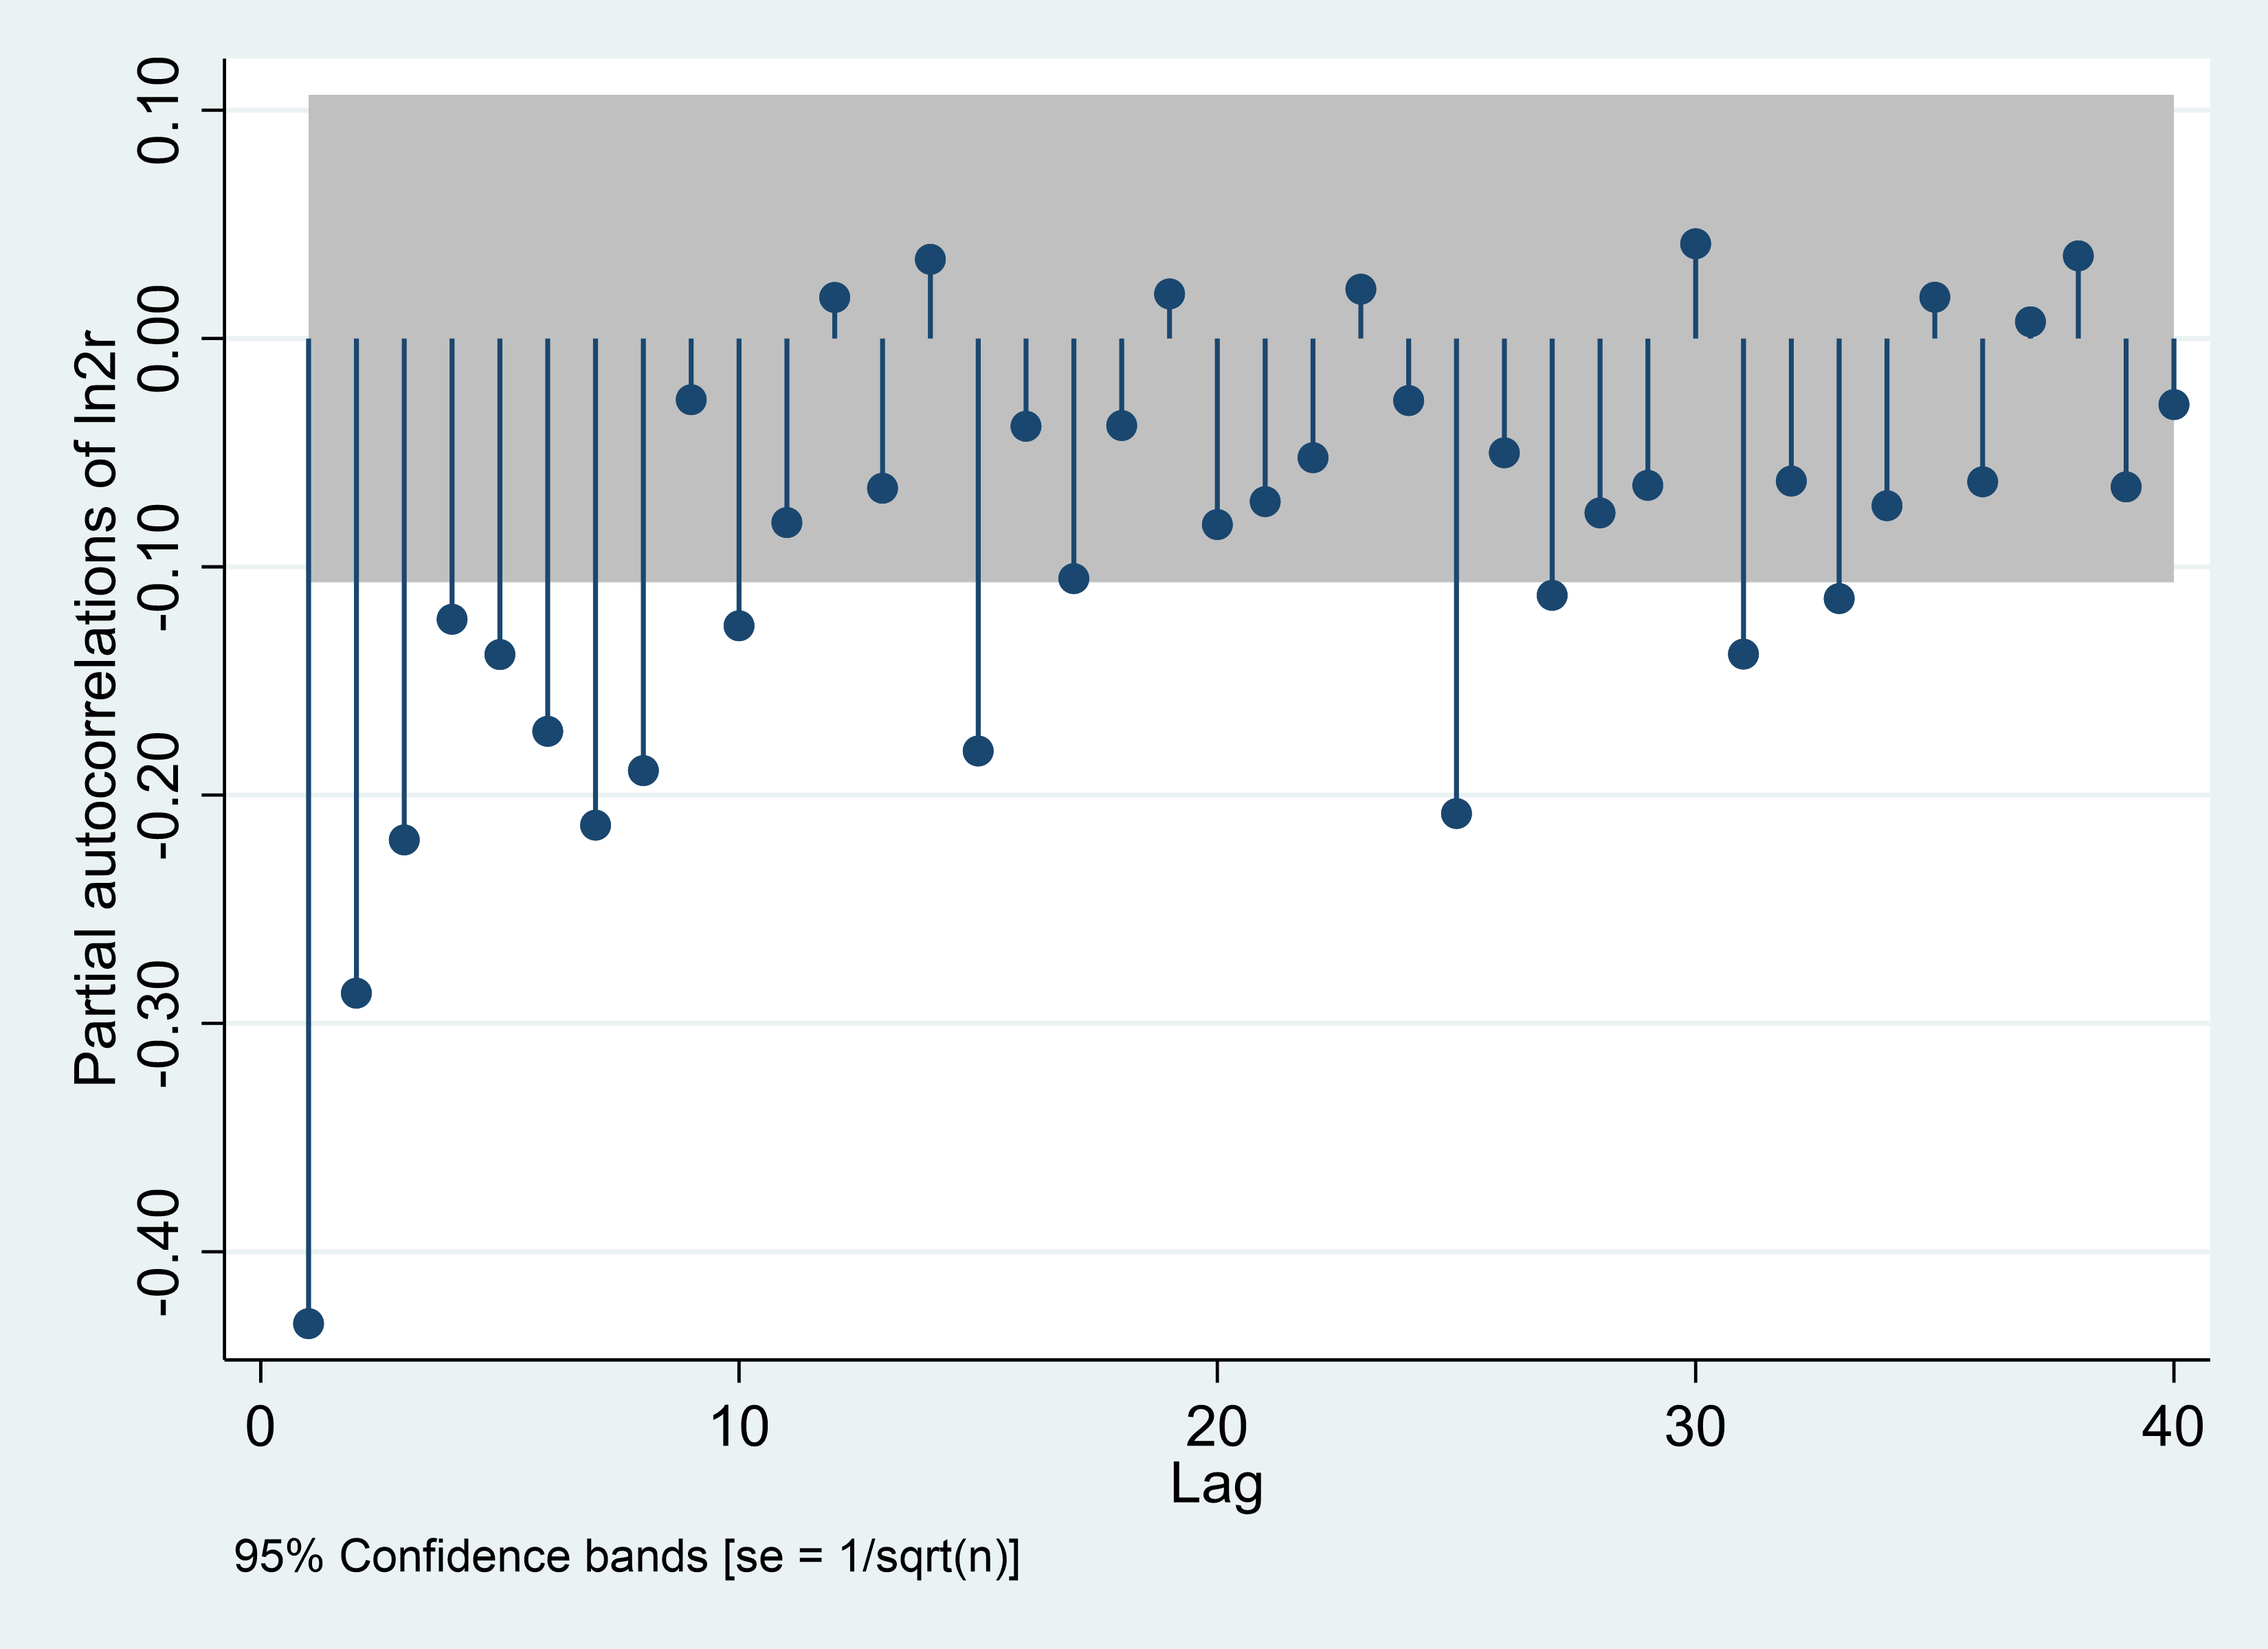
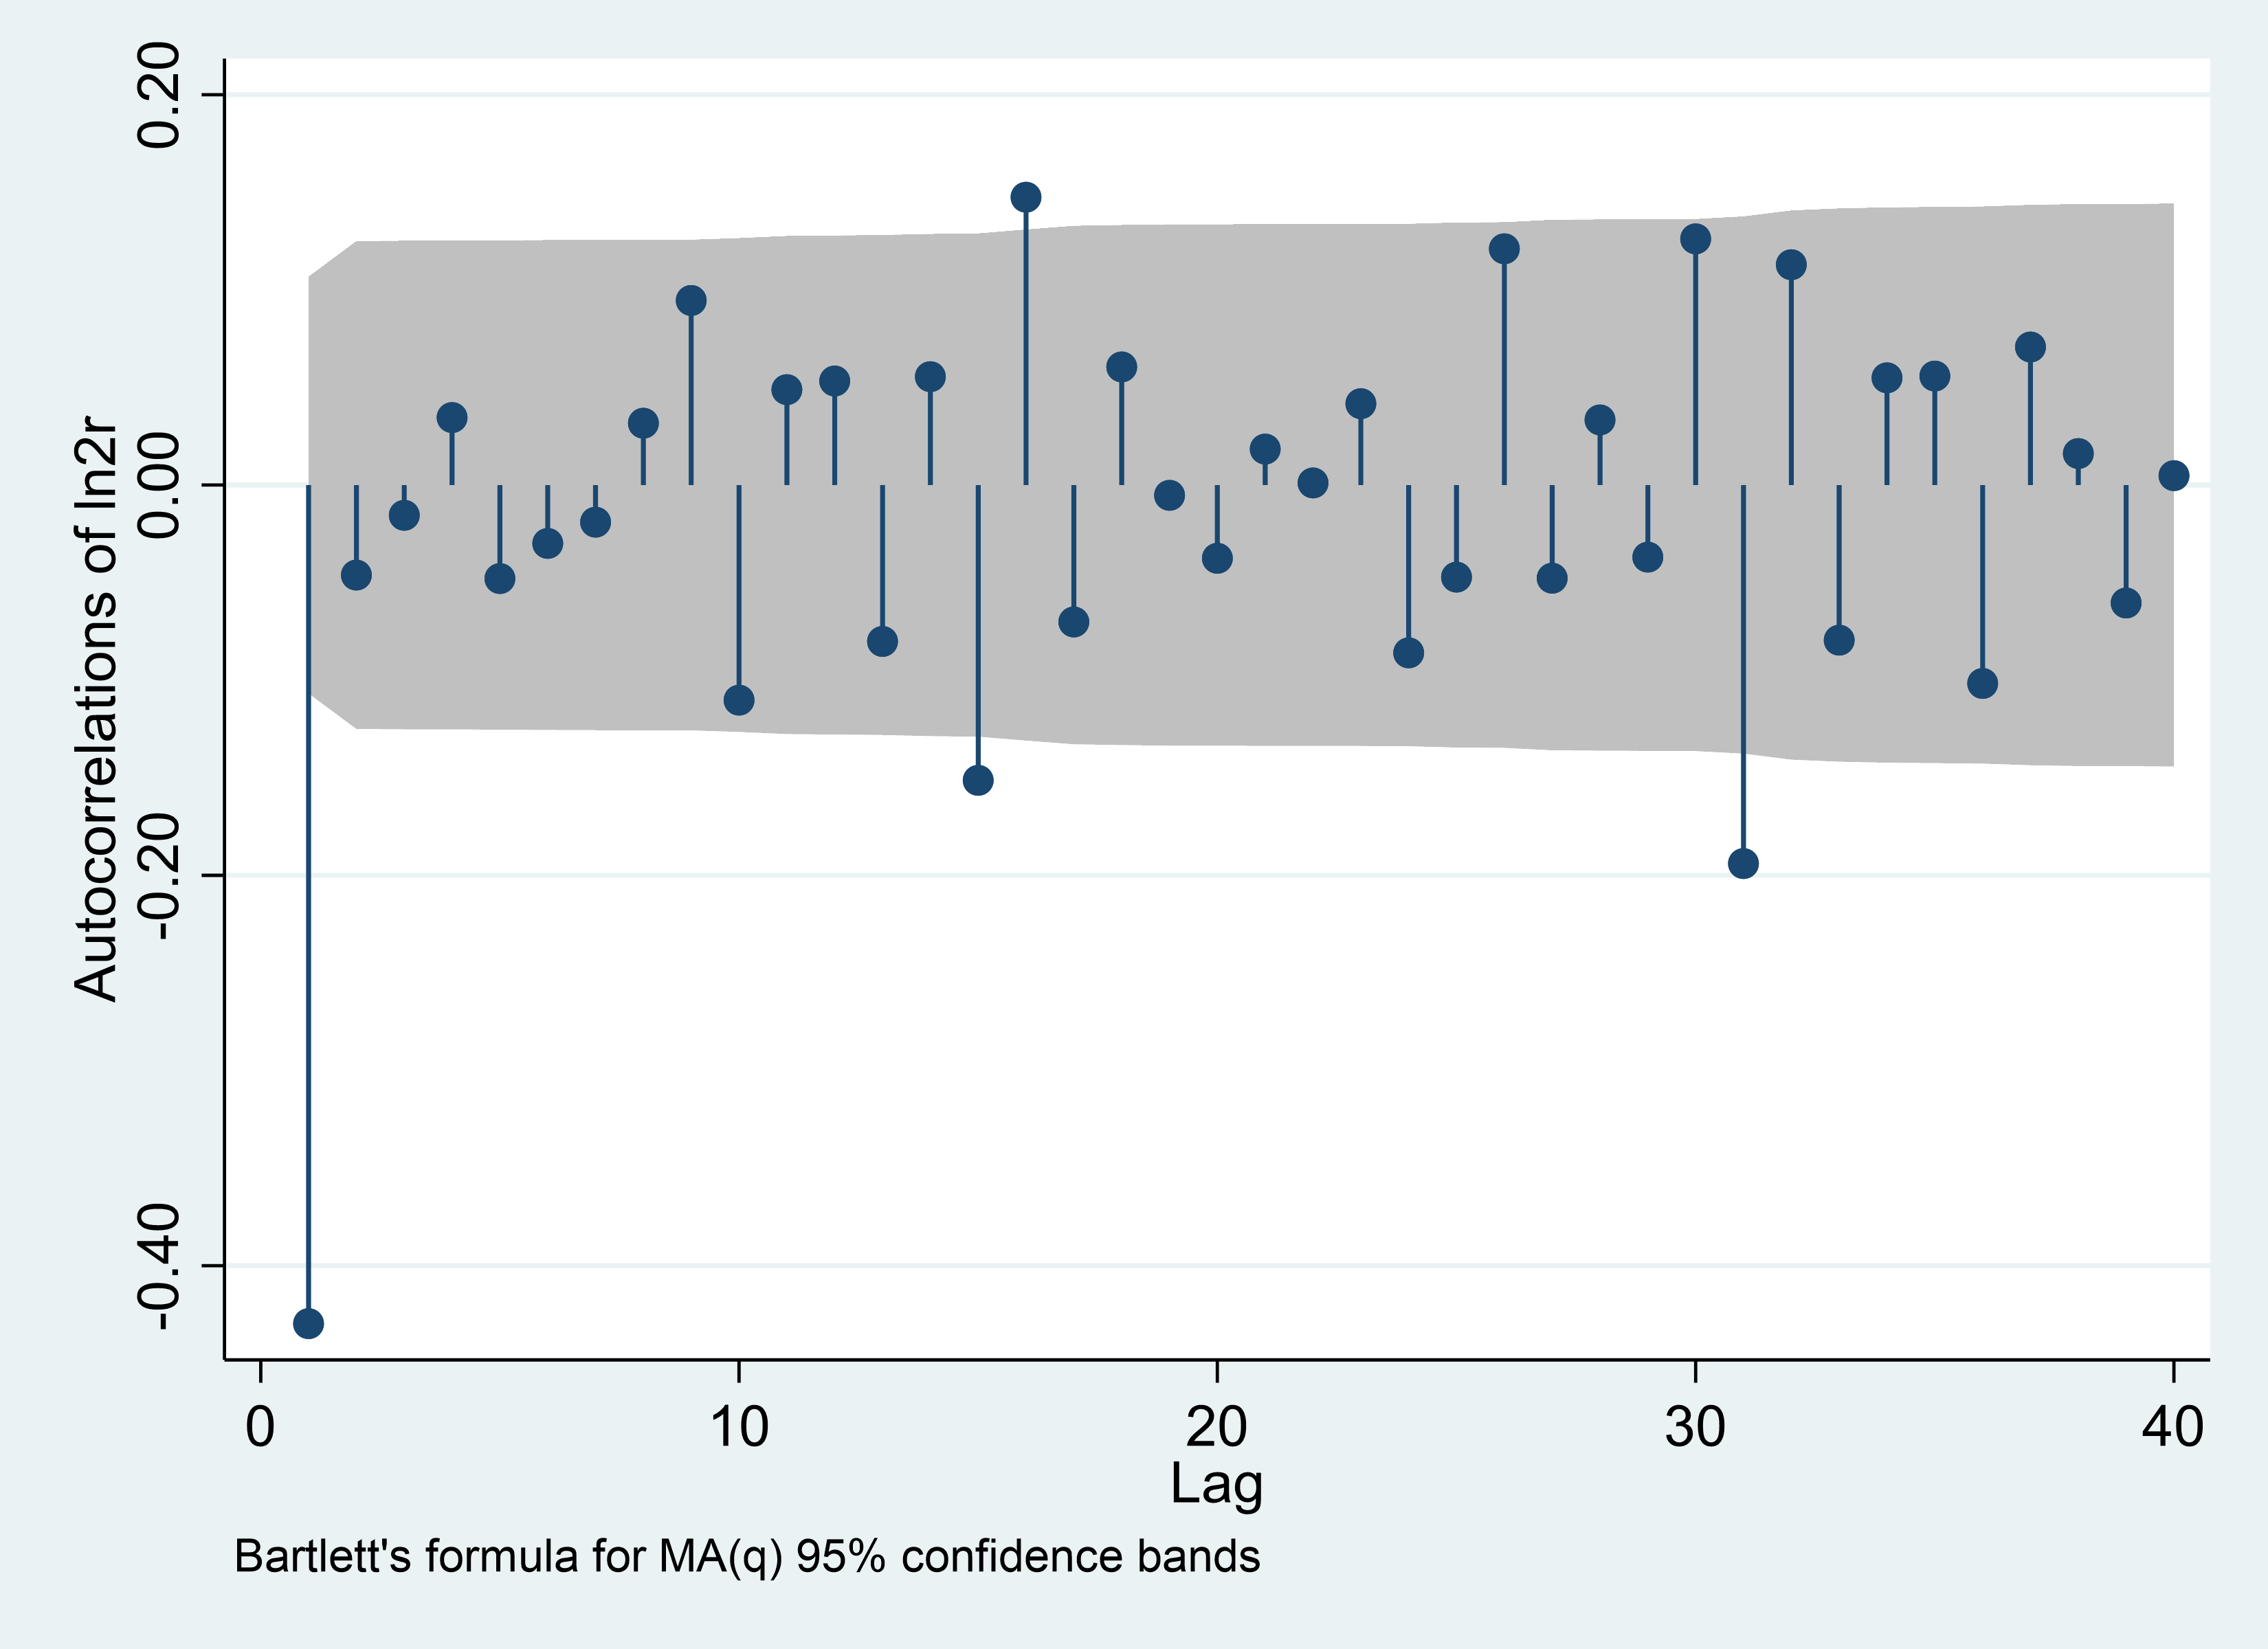
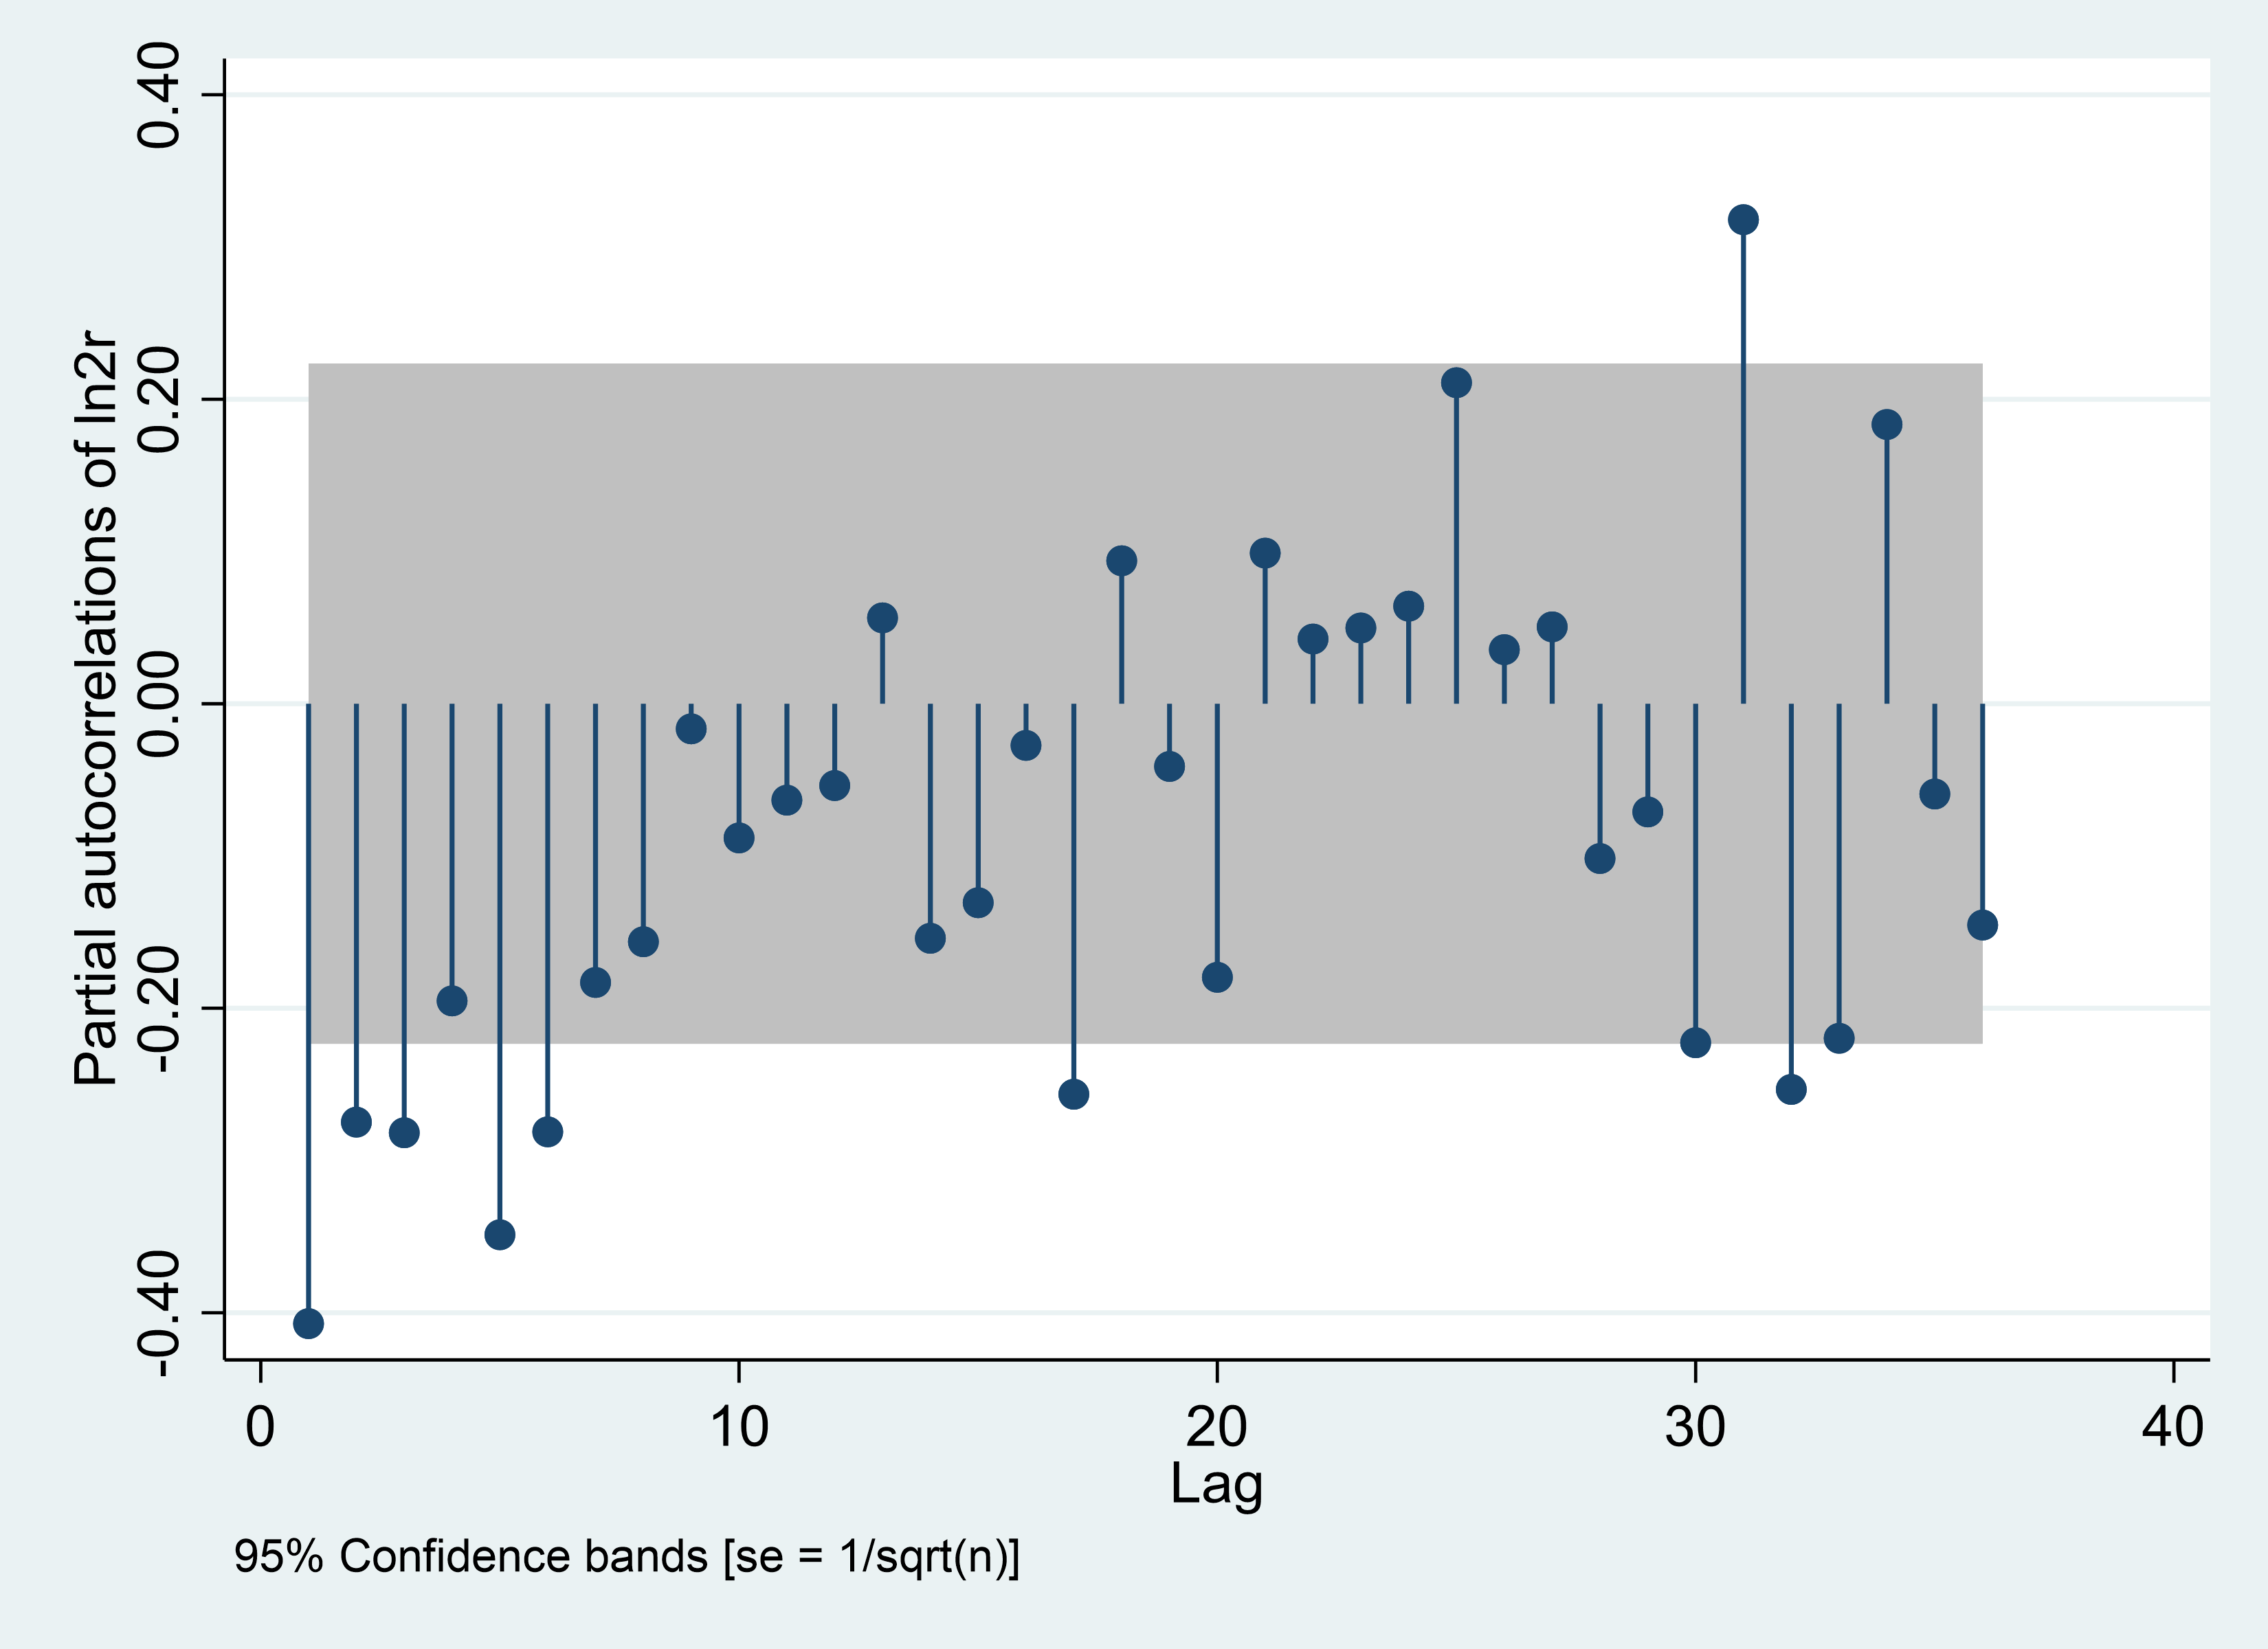
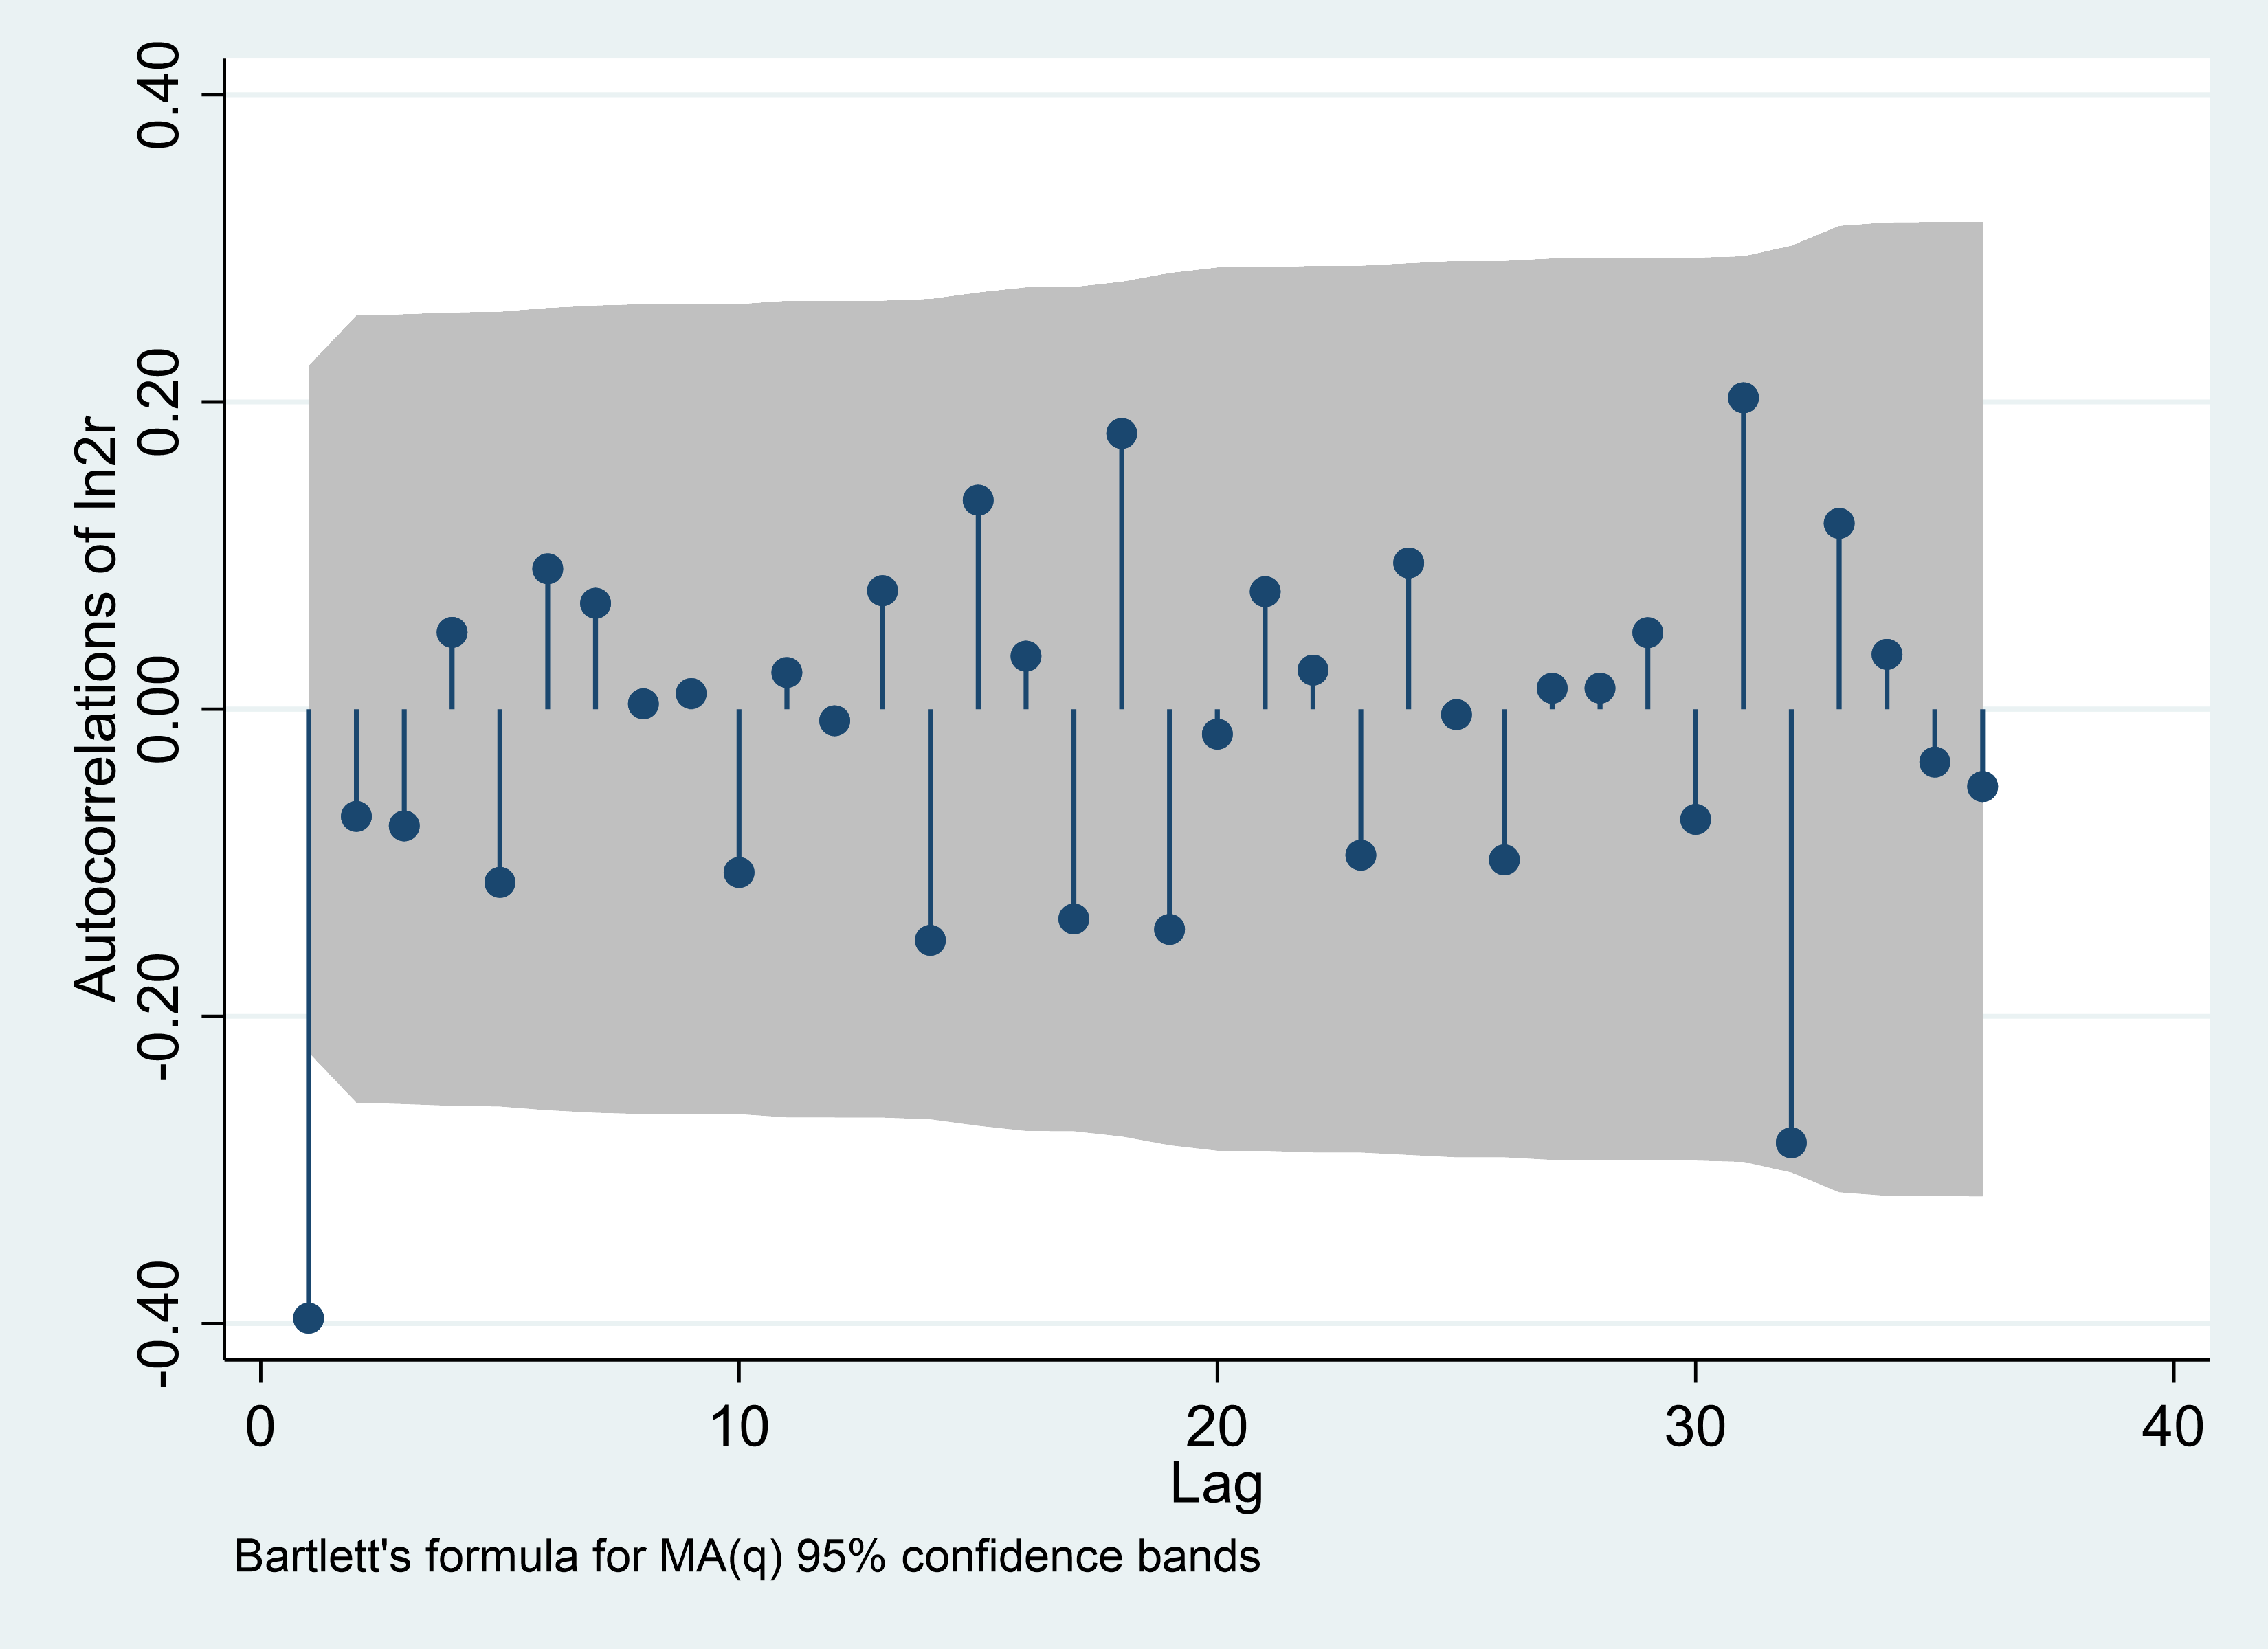
PACF determines the order of p (the order of AR), and the ACF determines the MA (q) Order.
Daily, the data is entered after 10 and falls into the shaded part. Weekly the data is entered after 1 and falls into the shade part. Monthly, the data is entered after 1 into the shade part (see Figure 1).
PACF | ACF |
Daily | |
|
|
Weekly | |
|
|
Monthly | |
|
|
Figure 1: ARMA (p, q) identification. | |
(Photo credit: Original) | |
3.2. Prediction Result and Interpretation
Table 2, the original hypothesis of this test is: there is no autocorrelation in the sequence (that is, the sequence is white noise), such as prob<0.05, the original hypothesis is rejected. It can be seen from the figure that daily meets the null hypothesis, monthly does not meet the null hypothesis, and not meets weekly.
Table 2: Residual test.
Model | Portmanteau (Q) statistic | Prob > chi2 |
Daily-ARIMA(10,1,10) | 2192.6054 | 0.0000 |
Weekly-ARIMA(8,2,1) | 52.1470 | 0.0945 |
Monthly-ARIMA(6,2,1) | 36.8376 | 0.6134 |
This paper select 3 times period daily, weekly, monthly for analysis. From the overall trend of the figure, figure 2 daily keeps rising steadily, even more than expected growth, and figure 3 weekly and short-terms (almost 6 weeks) keep rising even higher than expected it is expected to growth more, and the short-terms (more than 7 weeks) actually growth is less than the expected growth (Figure 4).
Figure 2: Actual value and fitted value, daily. |
(Photo credit: Original) |
The actual results of figure 3 monthly are two different from the forecast result, indicating that the US and China trade war has a great impact on the valuation of China’s semiconductor industry.
Figure 3: Actual value and fitted value, weekly. |
(Photo credit: Original) |
Figure 4: Actual value and fitted value, monthly. |
(Photo credit: Original) |
This paper is about the influence of the Sino-US trade war on the China’s semiconductor industry. In very short-terms (daily), basically no impact. In the short-terms (weekly)have small impact, but there is no effect if it is less than 7 weeks and it will be affected if it exceed 7 weeks (but not more than 7 weeks). long-terms(monthly) have huge impact (more than 60 percentage). During the period of US and China trade war, the main means of US sanction against China were tax increase and restriction on the export of the semiconductor industry.
China | US |
Figure 5: Industry structure of China and US. | |
(Photo credit: Original) | |
There is a huge distinguish in industrial structure of Sino-US (see Figure 5). Proportion of the tertiary industry in US is much higher than that of the primary and secondary industries. In China, although the tertiary industries occupy a dominant position in the industry structure, compared with the United States, the secondary industry is two times that of the United States. The proportion of primary industry in the United States is one-seventh that of China. The primary industries refer to agriculture, the secondary industry refers to industries such as automobiles and pharmaceuticals, and the tertiary industries such as automobiles and pharmaceuticals, and the tertiary industry mainly includes finance, education, telecommunication, retail entertainment medical care etc. [11].
China’s economy has developed enormously in just a few years, Sino-US relations have undergone tremendous changes, basically it can be roughly divided into four stages.
The first stage was between 1979 and 1988, when Sino-US relations were relatively stable; the second stage was from 1989 to 1994, when Sino-US relations deteriorated sharply; the third stage was from 1995 to 2000, when Sino-US relations were relatively stable. After stability, the fourth stage is from 2001 to 2005. although there are still frictions in bilateral relations in this stage, Sino-US relations are improving [12].
4. Conclusion
The object of this paper is to predict the stock index of the semiconductor industry without the Sino-US trade war. The research background of this paper is that the Sino-US trade war has affected many industries in China, and the United States had a huge influence on China’s chip industry. After forecasting, this paper found that there is no daily impact, and weekly impact, but there is no complex impact, and there is a great monthly impact, but there is no complex impact, and there is a great monthly impact. Because there may be some problems with the ARIMA model, this paper suggests that latecomers in the academic community can use the LASSO model and the neutral net model to predict.
This paper has several suggestions for policy makers and investors. Investors,some time ago due to the Sino-US trade war, China’s financial market suffered the most losses. This article recommends investors investing in the semiconductor industry. Investors who want to hold chip industry stocks in the short term may consider it more, in the short terms, this impact will not disappear unless China can make a huge breakthrough in the semiconductor industry in the short term. However, if investors who want to hold stocks in the semiconductor industry in the long term can choose to buy, people can trust the relevant government departments, there will be some policy support for companies like HUAWEI that are trying to break the US blockade of the semiconductor industry in some ways.
Policy makers suggest using some financial means to save the financial market of the semiconductor industry and increase support for the semiconductor industry. Policy support and R&D investment to avoid being locked in by foreign countries.
References
[1]. JY Chen. (2018). The background,reasons,nature and China’s countermeasures of the Sino-US trade war. Journal of wuhan university (philosophy and social sciences edition) 71(5), 72-81.
[2]. C Gao. (2014). Changes in peripheral structure and strategic adjustment in the context of china’s rise. International Economic Review, 2, 33.
[3]. RX Cao. (2020). Analysis of “special section 301” related issue in the Sino-US trade war. Heilong jiang finance, (2), 11-14.
[4]. MN Zhang. (2019). Reshaping Sino- US relations in “ trade war ” and economic and trade negotiations finance and economics , (2), 1-1.
[5]. ZW Tang, YX Li , & LP Zhang . (2021). The identification method and breakthrough path of “stuck neck “technology under the background of Sino-US trade friction -- Taking the electronic information industry as an example. Science and technology progress and countermeasures, 38(1), 1-9.
[6]. SA Huang. (2018). China cannot passively open up its finance- strategic thinking based on the Sino-US trade war. Journal of Dongbei University of finance and economics, (3), 3-5.
[7]. Y Chen, DJ Wang , HY Su , HF jiang , & X Zhang . (2019). The impact of the Sino-US trade war on forest product trade and countermeasures. Forestry Economic Issues, 39(1), 1-7.
[8]. T Zhang. (2018). The impact of the Sino-US trade war on the shipping industry . China water transport, (4), 12-13.
[9]. RK Zhang. (2019). The United States’ technological blockade against China in the context of the trade war and my country’s response strategy. Science and Technology China, (8), 1-4.
[10]. Investing homepage. https://cn.investing.com
[11]. LH Zhang. (2013). The current situation of China’s industrial structure and its adjustment ideas- based on a horizontal comparison of the industrial structures of China and the United States. Economic Perspective , (1), 29-30.
[12]. J QI. (2008). Analysis of the evolution trend of Sino-US economic and trade relations. Contemporary Economic Research, (4), 47-49.
Cite this article
Liu,Z. (2023). The Sino-US Trade Conflict’s Impact on Semiconductor Stock Index: China’s Case. Advances in Economics, Management and Political Sciences,56,263-270.
Data availability
The datasets used and/or analyzed during the current study will be available from the authors upon reasonable request.
Disclaimer/Publisher's Note
The statements, opinions and data contained in all publications are solely those of the individual author(s) and contributor(s) and not of EWA Publishing and/or the editor(s). EWA Publishing and/or the editor(s) disclaim responsibility for any injury to people or property resulting from any ideas, methods, instructions or products referred to in the content.
About volume
Volume title: Proceedings of the 2nd International Conference on Financial Technology and Business Analysis
© 2024 by the author(s). Licensee EWA Publishing, Oxford, UK. This article is an open access article distributed under the terms and
conditions of the Creative Commons Attribution (CC BY) license. Authors who
publish this series agree to the following terms:
1. Authors retain copyright and grant the series right of first publication with the work simultaneously licensed under a Creative Commons
Attribution License that allows others to share the work with an acknowledgment of the work's authorship and initial publication in this
series.
2. Authors are able to enter into separate, additional contractual arrangements for the non-exclusive distribution of the series's published
version of the work (e.g., post it to an institutional repository or publish it in a book), with an acknowledgment of its initial
publication in this series.
3. Authors are permitted and encouraged to post their work online (e.g., in institutional repositories or on their website) prior to and
during the submission process, as it can lead to productive exchanges, as well as earlier and greater citation of published work (See
Open access policy for details).
References
[1]. JY Chen. (2018). The background,reasons,nature and China’s countermeasures of the Sino-US trade war. Journal of wuhan university (philosophy and social sciences edition) 71(5), 72-81.
[2]. C Gao. (2014). Changes in peripheral structure and strategic adjustment in the context of china’s rise. International Economic Review, 2, 33.
[3]. RX Cao. (2020). Analysis of “special section 301” related issue in the Sino-US trade war. Heilong jiang finance, (2), 11-14.
[4]. MN Zhang. (2019). Reshaping Sino- US relations in “ trade war ” and economic and trade negotiations finance and economics , (2), 1-1.
[5]. ZW Tang, YX Li , & LP Zhang . (2021). The identification method and breakthrough path of “stuck neck “technology under the background of Sino-US trade friction -- Taking the electronic information industry as an example. Science and technology progress and countermeasures, 38(1), 1-9.
[6]. SA Huang. (2018). China cannot passively open up its finance- strategic thinking based on the Sino-US trade war. Journal of Dongbei University of finance and economics, (3), 3-5.
[7]. Y Chen, DJ Wang , HY Su , HF jiang , & X Zhang . (2019). The impact of the Sino-US trade war on forest product trade and countermeasures. Forestry Economic Issues, 39(1), 1-7.
[8]. T Zhang. (2018). The impact of the Sino-US trade war on the shipping industry . China water transport, (4), 12-13.
[9]. RK Zhang. (2019). The United States’ technological blockade against China in the context of the trade war and my country’s response strategy. Science and Technology China, (8), 1-4.
[10]. Investing homepage. https://cn.investing.com
[11]. LH Zhang. (2013). The current situation of China’s industrial structure and its adjustment ideas- based on a horizontal comparison of the industrial structures of China and the United States. Economic Perspective , (1), 29-30.
[12]. J QI. (2008). Analysis of the evolution trend of Sino-US economic and trade relations. Contemporary Economic Research, (4), 47-49.