


1. Introduction
Netflix, a renowned American enterprise, which is a member subscription based streaming platform, headquartered in Los Gato, California, USA [1]. Established in 1997 as a Blu-ray DVD rental company, their subscribers can rent and return a large number of physical movies CDS from Netflix inventory by express delivery. Earning consistent customer satisfaction accolades, Netflix has been recognized as the foremost website in this regard for five consecutive years. IHS Research Company stated that Netflix surpassed Apple in online movie revenue in 2011, primarily driven by the burgeoning demand for online videos from online users [2]. In 2011, the company's online film sales accounted for 45% of the total market, according to a report by IHS. With a steadfast presence on the prestigious Fortune 500 list, Netflix has solidified its position as a leading player in the realm of streaming media.
The stock price is a criterion for evaluating a company's business performance, particularly for leading streaming companies. In the early stages of stock forecasting, conventional methodologies predominantly employed straightforward formulas. For example, price-to-earnings ratio (P/E), price-to-book ratio (P/B) and price-to-earnings ratio (PEG) are all regarded as the evaluation criteria of stock price under external influence. These criteria are all based on a company's previous sales and operating conditions as well as market trends to predict stock prices. However, the accuracy of the stock price predicted by this method has proven to be inadequate, and it also requires a large amount of manpower and resources. In the past 10 years, machine learning has effectively improved prediction accuracy, and the resources and time spent have also been greatly reduced.
Long Short-term Memory (LSTM) is a variant of temporal Recurrent Neural Networks (RNNS), a model designed specifically to solve long-standing problems that exist in general RNNS. In a normal RNN, there is only one simple structural module. For example, a layer of LSTM often outperforms recurrent neural networks, used in face image recognition. LSTM has a good manifestation in various fields. For instance, human face image generation and prediction. Since this concept was put forward, it has been widely used by people, which is why this paper uses this model to make a series of predictions. As a nonlinear regression model, LSTM has the ability to help build a broader neural network to solve the problem that too much data cannot be carried by the model. LSTM doesn't just have one version; it updates itself all the time. One of which is the Gated Recurrent Unit (GRU) [3]. Regulators believe that stock prices are the best representation of current financial market conditions, so for regulators, stock forecasting is very important. This prediction is important not just for regulators, but for those who invest in financial markets. This paper uses the model of gated circulation unit (GRU) neural network to forecast stocks. The model adopts the method of processing data first, adding uncertainty after data processing is completed, and combining GRU model to predict. This can lower the error rate of the end results and make the results more accurate [4].
In practical research, the author also used commonly seen linear regression models and non-linear machine learning regression models (i.e., LSTM and GRU) for prediction to compare the differences and accuracy of several algorithms. During the research of this article, several algorithms were used for comparison. Through in-depth understanding of machine learning algorithms, the advantages and disadvantages of the several models used in this article were discovered. In the end, the accuracy was good among the results of several models. The accuracy of the data in the linear regression model is as high as 98%, while the results obtained by the LSTM and GRU models are roughly the same, fluctuating around 70%.
2. Method
2.1. Dataset Preparation
This article collected data from Netflix from May 23, 2002, to October 11, 2021, sourced from Kaggle [5]. The dataset encompasses a total of 4961 observations and aims to facilitate accurate predictions of Netflix's future stock price. The price trend of the stock can be found in Figure 1.
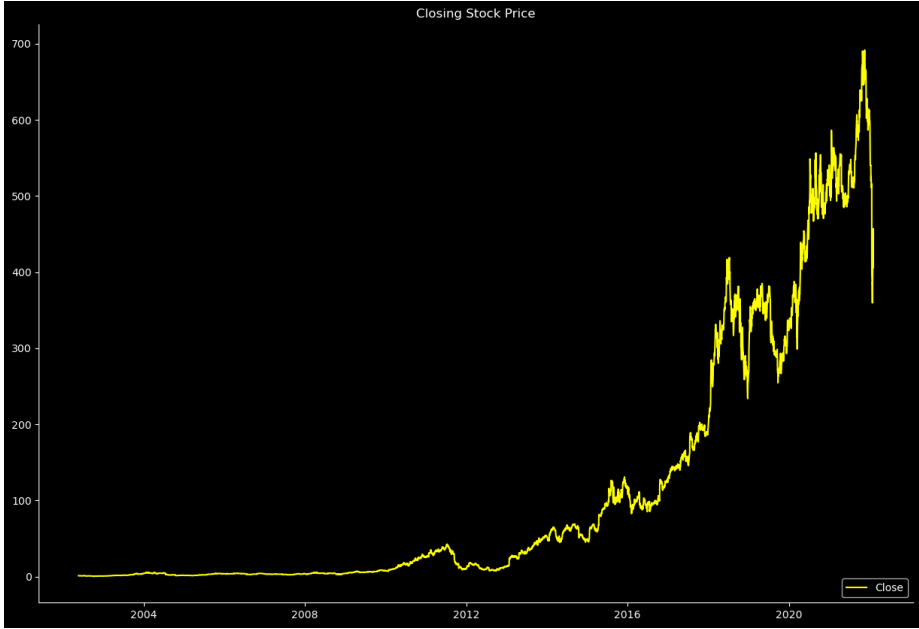
Figure 1: Closing Stock Price of the collected dataset (Photo/Picture credit: Original).
2.2. Predictive Algorithms
2.2.1. Linear Regression
Linear regression is the main driver of influence, which can explain the changes of dependent variables [6]. In the actual study of life, the dependent variable is a standard quantity of change, and there are generally several external factors affecting the dependent variable. And its changes are explained by these influencing factors, these external factors, they have a more appropriate name: independent variables. The linear relationship between the two is also known as multiple regression. Multiple linear regression is actually a regression analysis when two or more influential factors and dependent variables are involved [7]. When y is the dependent variable. It represents the independent variable and satisfies the condition that there must be a linear relationship between the two variables. This is a formula of the model:
\( Y={b_{0}}+{b_{1}}{x_{1}}+...+{b_{k}}{x_{k}} \) (1)
Scikit-learn (sklearn) is a machine learning tool that allows people to share data and source code over the Internet [8], which is considered in this study for implementing machine learning models. It has several different algorithms such as classification, regression and clustering [9, 10]. Like random Forest, gradient enhancement and DBSCAN, it is also designed to be used in combination with science libraries NumPy and SciPy. Scikit learn, which is primarily written in Python, can also perform some high-performance operations using numpy. In addition, some core algorithms have been written in Python to improve performance. Similar packaging for logistic regression and linear support vector machines surrounds LIBLINEAR.
2.2.2. Long Short-Term Memory
The Long Short-Term Memory (LSTM) was originally launched in 1997 [11], it has garnered significant attention due to its distinctive architectural design, which makes it good at solving some events characterized by long intervals and time delays in the forecast data. As a nonlinear machine learning model, LSTM can help build a larger and deeper neural network for people to study and use [2]. LSTM has the same structure as RNN, and it has a little bit of a different structure, but it uses one module. This is not the case with a single neural network layer, as shown in Figure 2, there are four levels that interact in a very specific way.
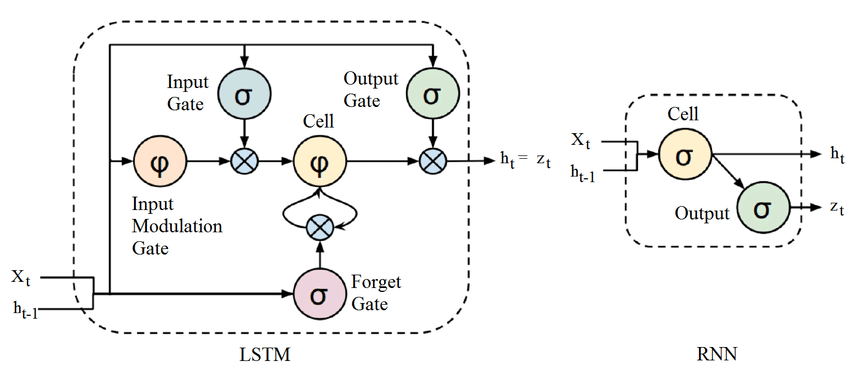
Figure 2: The structure of the LSTM [12].
2.2.3. GRU
Gate Recurring Unit (GRU) is a variation of the Recurring Neural Network (RNN), which optimizes issues of long-term failure and counter-spread of the regular RNN based RNN. Its function is similar to that of LSTM, but it is simpler and easier to train than LSTM [13]. Reset gate and update gate are two important gates in GRU module, with the structure shown in Figure 3.
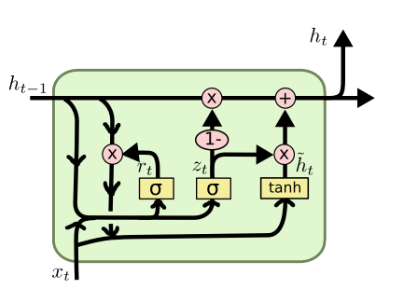
Figure 3: The structure of GRU [14].
2.2.4. Implementation Details
Mean Square Error (MSE), Root Mean Square Error (RMSE), Mean Absolute Error (MAE), r square and Mean Absolute Percentage Error (MAPE) are all used as evaluation criteria for a model in this paper. The optimizer used in this paper is called Adam, named after Adaptive Moment Estimation. It is a universal optimizer proposed in 2015 [15], which is very convenient to use and has a fast gradient descent speed but is prone to oscillations near the optimal value.
3. Results and Discussion
3.1. The Performance of Models
In this article, epochs=100 and batch_ size=5 are employed. From Table 1, it can be found that the Loss function values of these models. Furthermore, Figure 4, Figure 5 and Figure 6 show the predicted curve. The findings are set out in Table 1, which displays the respective Loss function values obtained by three distinct models. Overall, the linear regression model exhibits the highest degree of fitting among the models examined. However, if only the Loss function values of LSTM and GRU are observed, LSTM is better under the MSE standard; Under the MAE standard, GRU is better; Moreover, when assessing the models using the RMSE criterion, LSTM demonstrates superior performance. If only the two models LSTM and GRU are compared, it is obvious that LSTM is better than GRU.
Table 1: The performance of various models evaluated by different metrics.
Loss Function (Methods) | Linear regression | LSTM | GRU |
MSE | 51.518 | 1430.97 | 2051.42 |
MAE | 7.178 | 31.39 | 30.8 |
RMSE | 6.626 | 37.83 | 45.29 |
R-Squared | 0.016 | - | - |
MAPE | 0.992 | - | - |
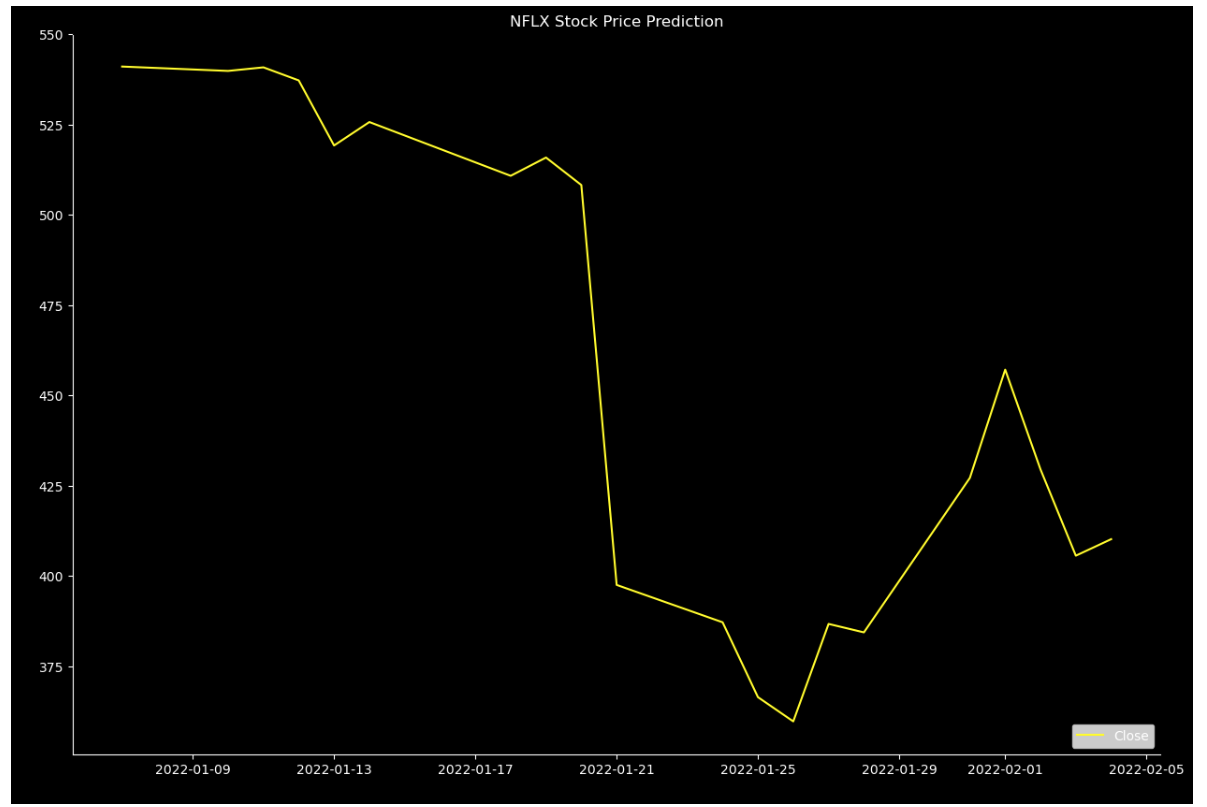
Figure 4: The prediction performance based on the linear regression (Photo/Picture credit: Original).
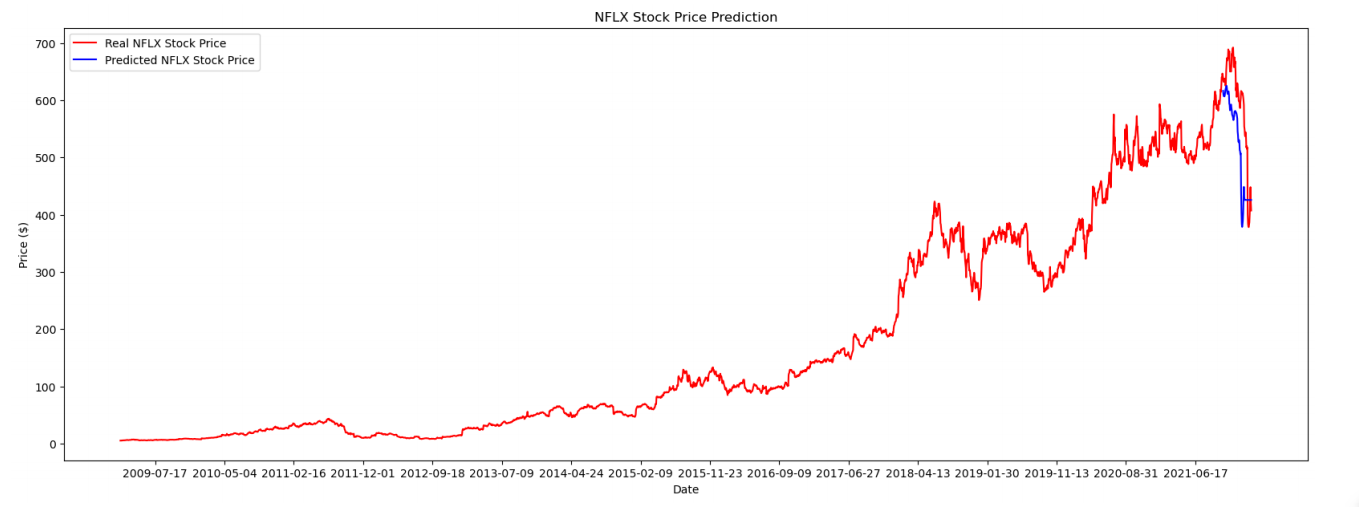
Figure 5: Predictive performance on account of LSTM (Photo/Picture credit: Original).
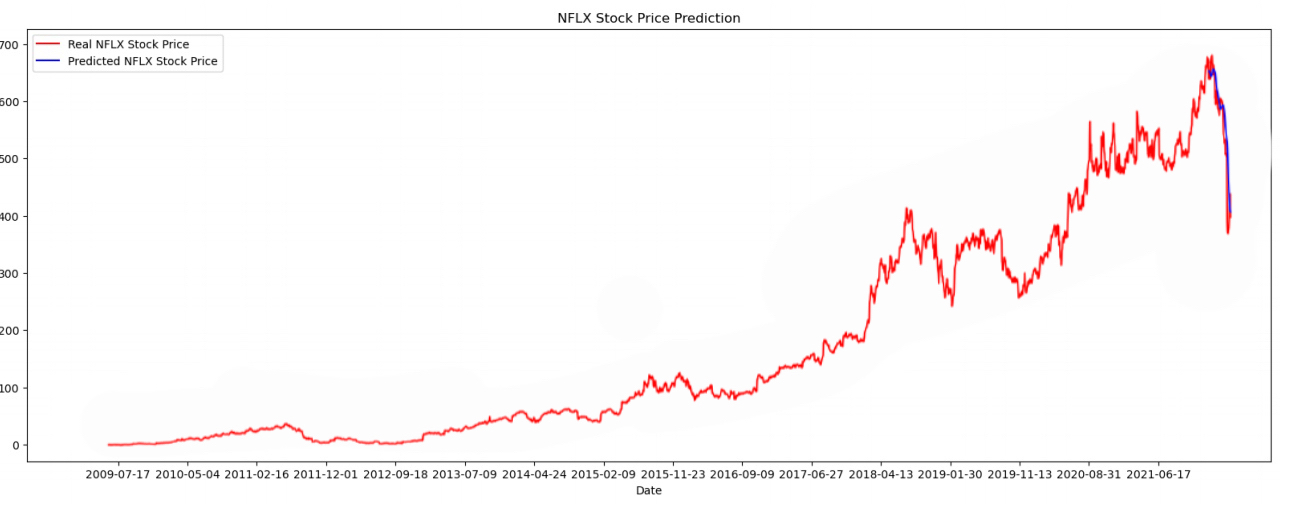
Figure 6: Predictive performance on account of GRU (Photo/Picture credit: Original).
The aforementioned results can be attributed to two potential factors. The first is that the data itself is extremely conforms to the linear model hypothesis and the characteristics have no obvious collinearity and outlier. The second is that the LSTM and GRU models did not undergo hyper parameter optimization (such as parameters in the kernel) or had severe over-fitting.
Generally speaking, the behavior of stock prices exhibits nonlinearity, indicating that linear regression models may not be the most suitable choice for achieving optimal fit with the data. In contrast, the application of nonlinear regression models, such as LSTM, tends to yield superior results. LSTM possesses enhanced power and flexibility as a nonlinear regression model, primarily attributed to its incorporation of three gates as opposed to two. The advantage of GRU is that the overall model is simpler, it can build a larger network faster and easier. In addition, the fact that there are only two gates in the model helps the model to calculate the result faster than other models.
4. Conclusion
In this paper, the author uses linear regression model and Nonlinear regression model (i.e. LSTM and GRU) to predict the stock price of Netflix, and uses several common metrics to evaluate these models. However, the results obtained by the author of this paper are slightly less satisfactory, and the Loss value is larger, but the accuracy is better. In this paper, the three models used by the author are more conventional and easier to implement, and many Nonlinear regression models with better accuracy can be used, and the results obtained are also relatively limited. The selected data range is also relatively narrow, and multiple different stocks can be selected for prediction using these three models. In future in-depth research, the author hopes to reduce the loss rate of LSTM and GRU models, and find a suitable method to optimize the two models and improve the fit of data and models.
References
[1]. Netflix., (2023) Retrieved from www.netflix.com
[2]. SP Global., (2023) Retrieved from https://www.spglobal.com/zh/
[3]. Liang, C., et al. (2017) Application of LSTM network in short-term power load forecasting under deep learning framework, Power Information and Communication Technology, 2017 (5): 8-11.
[4]. Niu, H. L., et al. (2022) Forecasting Stock Price Index by Bagging Algorithm and GRU Model. Computer engineering and Application, 58 (12): 132-138. DOI: 10.3778/j.issn.1002-8331.2105-0367
[5]. Kaggle (2022) Netflix Stock Price Data set 2002-2022, Retrieved from https://www.kaggle.com/datasets/meetnagadia/netflix-stock-price-data-set-20022022
[6]. Li, G. M., et al. (2011) Research on the prediction of power generation in grid connected photovoltaic power generation systems based on multiple linear regression models. Modern Power, 28 (2): 6. DOI: 10.3969/j.issn.1007-2322.2011.02.009
[7]. Preacher, K. J., et al. (2006) Computational tools for probing interaction effects in multiple linear regression, multilevel modeling, and latent curve analysis. Journal of Educational and Behavioral Statistics, 31:427-448.
[8]. Pedregosa, F., et al. (2011) Scikit-learn: Machine Learning in Python. JMLR.org, 85.
[9]. Nguyen, D., et al. (2011) Author age prediction from text using linear regression, Proceedings of the 5th ACL-HLT workshop on language technology for cultural heritage, social sciences, and humanities, 115-123.
[10]. Yu, Q., et al. (2020) Clustering Analysis for Silent Telecom Customers Based on K-means++, 2020 IEEE 4th Information Technology, Networking, Electronic and Automation Control Conference (ITNEC). IEEE, 1: 1023-1027.
[11]. Gers, F. A., et al. (2000) Learning to Forget: Continual Prediction with LSTM, Neural Computation, DOI:10.1162/089976600300015015.
[12]. Medium., (2018) Chapter 10.1: DeepNLP — LSTM (Long Short Term Memory) Networks with Math. Retrieved from https://medium.com/deep-math-machine-learning-ai/chapter-10-1-deepnlp-lstm-long-short-term-memory-networks-with-math-21477f8e4235
[13]. Li, X., et al. (2022). Multi-step forecasting of ocean wave height using gate recurrent unit networks with multivariate time series. Ocean engineering (Mar.15), 248.
[14]. Tutorial Example., (2020) Understand GRU (Gated Recurrent Unit): Difference Between GRU and LSTM – Deep Learning Tutorial, Retrieved from https://www.tutorialexample.com/understand-gru-gated-recurrent-unit-difference-between-gru-and-lstm-deep-learning-tutorial/
[15]. Bock, S., et al. (2023) An improvement of the convergence proof of the ADAM-Optimizer, 2018, DOI:10.48550/arXiv.1804.10587.
Cite this article
Zhou,Y. (2024). Stock Forecasting Based on Linear Regression Model and Nonlinear Machine Learning Regression Model. Advances in Economics, Management and Political Sciences,57,7-13.
Data availability
The datasets used and/or analyzed during the current study will be available from the authors upon reasonable request.
Disclaimer/Publisher's Note
The statements, opinions and data contained in all publications are solely those of the individual author(s) and contributor(s) and not of EWA Publishing and/or the editor(s). EWA Publishing and/or the editor(s) disclaim responsibility for any injury to people or property resulting from any ideas, methods, instructions or products referred to in the content.
About volume
Volume title: Proceedings of the 2nd International Conference on Financial Technology and Business Analysis
© 2024 by the author(s). Licensee EWA Publishing, Oxford, UK. This article is an open access article distributed under the terms and
conditions of the Creative Commons Attribution (CC BY) license. Authors who
publish this series agree to the following terms:
1. Authors retain copyright and grant the series right of first publication with the work simultaneously licensed under a Creative Commons
Attribution License that allows others to share the work with an acknowledgment of the work's authorship and initial publication in this
series.
2. Authors are able to enter into separate, additional contractual arrangements for the non-exclusive distribution of the series's published
version of the work (e.g., post it to an institutional repository or publish it in a book), with an acknowledgment of its initial
publication in this series.
3. Authors are permitted and encouraged to post their work online (e.g., in institutional repositories or on their website) prior to and
during the submission process, as it can lead to productive exchanges, as well as earlier and greater citation of published work (See
Open access policy for details).
References
[1]. Netflix., (2023) Retrieved from www.netflix.com
[2]. SP Global., (2023) Retrieved from https://www.spglobal.com/zh/
[3]. Liang, C., et al. (2017) Application of LSTM network in short-term power load forecasting under deep learning framework, Power Information and Communication Technology, 2017 (5): 8-11.
[4]. Niu, H. L., et al. (2022) Forecasting Stock Price Index by Bagging Algorithm and GRU Model. Computer engineering and Application, 58 (12): 132-138. DOI: 10.3778/j.issn.1002-8331.2105-0367
[5]. Kaggle (2022) Netflix Stock Price Data set 2002-2022, Retrieved from https://www.kaggle.com/datasets/meetnagadia/netflix-stock-price-data-set-20022022
[6]. Li, G. M., et al. (2011) Research on the prediction of power generation in grid connected photovoltaic power generation systems based on multiple linear regression models. Modern Power, 28 (2): 6. DOI: 10.3969/j.issn.1007-2322.2011.02.009
[7]. Preacher, K. J., et al. (2006) Computational tools for probing interaction effects in multiple linear regression, multilevel modeling, and latent curve analysis. Journal of Educational and Behavioral Statistics, 31:427-448.
[8]. Pedregosa, F., et al. (2011) Scikit-learn: Machine Learning in Python. JMLR.org, 85.
[9]. Nguyen, D., et al. (2011) Author age prediction from text using linear regression, Proceedings of the 5th ACL-HLT workshop on language technology for cultural heritage, social sciences, and humanities, 115-123.
[10]. Yu, Q., et al. (2020) Clustering Analysis for Silent Telecom Customers Based on K-means++, 2020 IEEE 4th Information Technology, Networking, Electronic and Automation Control Conference (ITNEC). IEEE, 1: 1023-1027.
[11]. Gers, F. A., et al. (2000) Learning to Forget: Continual Prediction with LSTM, Neural Computation, DOI:10.1162/089976600300015015.
[12]. Medium., (2018) Chapter 10.1: DeepNLP — LSTM (Long Short Term Memory) Networks with Math. Retrieved from https://medium.com/deep-math-machine-learning-ai/chapter-10-1-deepnlp-lstm-long-short-term-memory-networks-with-math-21477f8e4235
[13]. Li, X., et al. (2022). Multi-step forecasting of ocean wave height using gate recurrent unit networks with multivariate time series. Ocean engineering (Mar.15), 248.
[14]. Tutorial Example., (2020) Understand GRU (Gated Recurrent Unit): Difference Between GRU and LSTM – Deep Learning Tutorial, Retrieved from https://www.tutorialexample.com/understand-gru-gated-recurrent-unit-difference-between-gru-and-lstm-deep-learning-tutorial/
[15]. Bock, S., et al. (2023) An improvement of the convergence proof of the ADAM-Optimizer, 2018, DOI:10.48550/arXiv.1804.10587.