


1. Introduction
There are many different expressions of FCFE from different scholars. During the 1980s, “Free cash flow was defined as the remaining cash flow after a firm has met the funding requirements for all projects that have a positive net present value discounted at the relevant cost of capital.” says Michael Jensen (1986), professor at Harvard University. Tom Copeland (1990) is one of the senior leaders of McKinsey & Company, Inc.. He described the calculation of free cash flow in detail:” The free cash flow equals the net operating profit minus adjusted tax (NOPAT) plus non-cash expenses such as depreciation and amortization, then less the additions of working capital and investment in property, plant and equipment and other assets.” Bradford Cornell (1993) had a similar definition that the free cash flow is the net cash flow resulting from the cash flow created by a firm minus all of the firm’s expenses. The originator of Systematic Financial Management, L.P., K. S. Hackel (1996), thought that the equity free cash flow equals operating net cash flow minus capital expenditures plus the discretionary expenditure in the capital or other expenditures.
In this paper, Copeland’s FCFE definition will be adopted. Moreover, to apply this model, the FCFE discount model with a stable growth rate needs to be established [1].
2. Free Cash of Equity
Theoretically, relative and absolute valuation methods are commonly used to value listed companies. The relative valuation method is adopted when comparing the same kind of data is needed. Whereas the absolute valuation method is based on the principle that the share price is the present value of the company’s expected future cash flows discounted at a fair discount rate, it mainly consists of the Black-Scholes option pricing model and the discounted cash flow model [2]. The latter includes three models - the dividend discount model (DDM), the company’s free float model (FFT), and the dividend discounting model (DFM). Given the discontinuity of cash dividends in the Chinese securities market, DDM is not applicable, while both shareholders and creditors are the owners of the firm’s free cash flow, so FCFF is not applicable either [3][4]. So, FEFE is more suitable for China’s efficient market, which is highly priced and less vulnerable to cash dividends. It can avoid the disadvantages of DDM and FCFF and become a more feasible valuation method for the firms [5].
The more general Professor Copeland’s FCFE model will be adopted in this paper, which is calculated as Equation 1.
\( FCFE=EBIT(1-t) +Dep.-Capital Exp.-∆WC+ Net Borrowing \) (1)
Conducting an in-depth analysis of FCFE Model to lay the foundation for the following research is necessary. Based on different assumptions about the growth rate of future free cash flows, the FCFE model can be classified into the following three types: (1) Zero Growth Model, assuming the growth rate is 0, and the formula is P0=D0/k; (2) Stable Growth Model: assuming growth at a constant rate g, and the formula is P0=D1/(k-g); (3) Multistage Growth Model: growth rates are assumed to be variable [6].
3. The Analysis of the Gambol Pet Group Company
3.1. Industrial Background
Recent years have witnessed a spurt of progress in the pet industry because of the development of the national economy and the growing spiritual need for companionship. According to the ‘China’s Pet Industry White Paper’, the scale of China’s pet (dog and cat) food industry reached RMB137.2 billion/+7.0% in 2022, with a CAGR of approximately 24.2% from 2012-2022. (Figure 1) Although the growth trend has been maintained in recent years, the scale of China’s pet market and the penetration rate of pet ownership still have a big gap compared with developed countries [7].
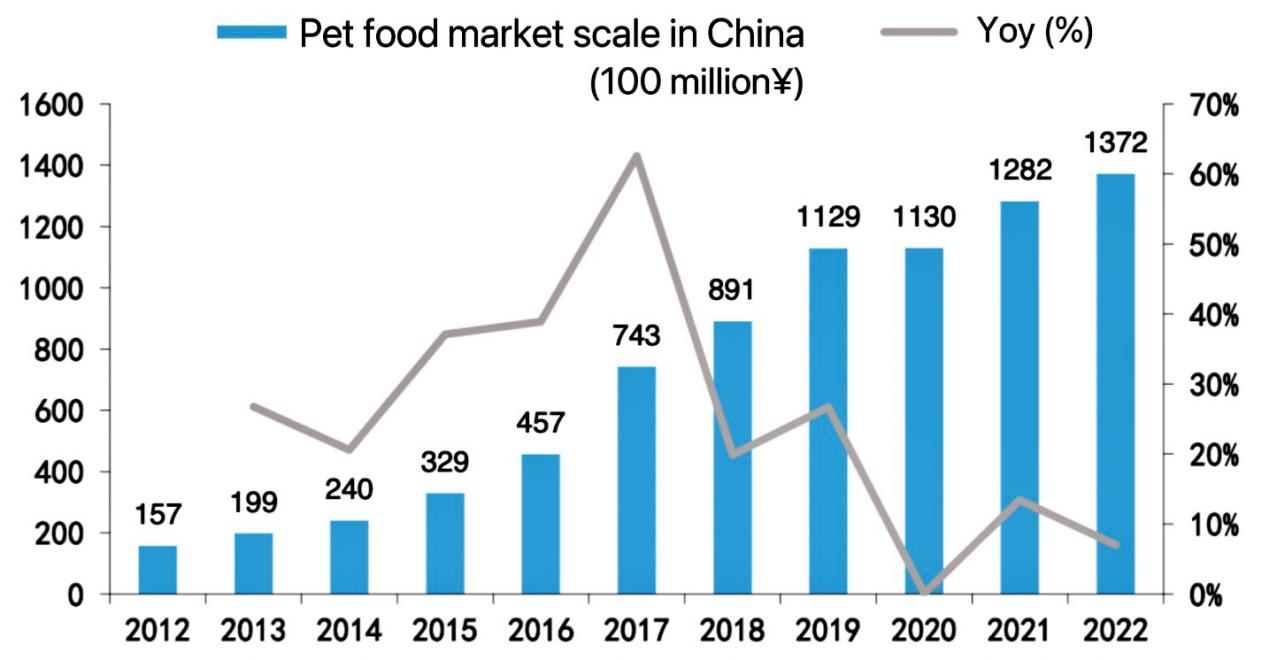
Figure 1: The Pet food market scale in China in 2012-2022.
(Data source: Essence Securities, China’s Pet Industry White Paper)
3.2. Company Background
3.2.1. Corporate Profile
Gambol Pet Group Co., Ltd. was founded on 26 June 2006 and has gradually developed into China’s largest pet food exporter. It has established several subsidiaries in the United States, Japan, the Netherlands, Thailand and Beijing, China. Its products are sold to more than ten countries and regions, including Europe and the United States, with an annual sales volume of more than RMB 1 billion. 16 August 2023, it was listed on the Shenzhen Stock Exchange GEM board [8].
According to the figure 2, in 2018-2022, the company’s revenue grew from 1.22 billion yuan to 3.40 billion yuan, with a CAGR of 29.2%. Moreover, in 2023H1, the company achieved an operating income of RMB 2.07 billion/+22.4%. The company’s earnings capacity increased mainly due to its brands’ enhanced popularity and influence. However, revenue growth slowed down because the overseas business was affected.
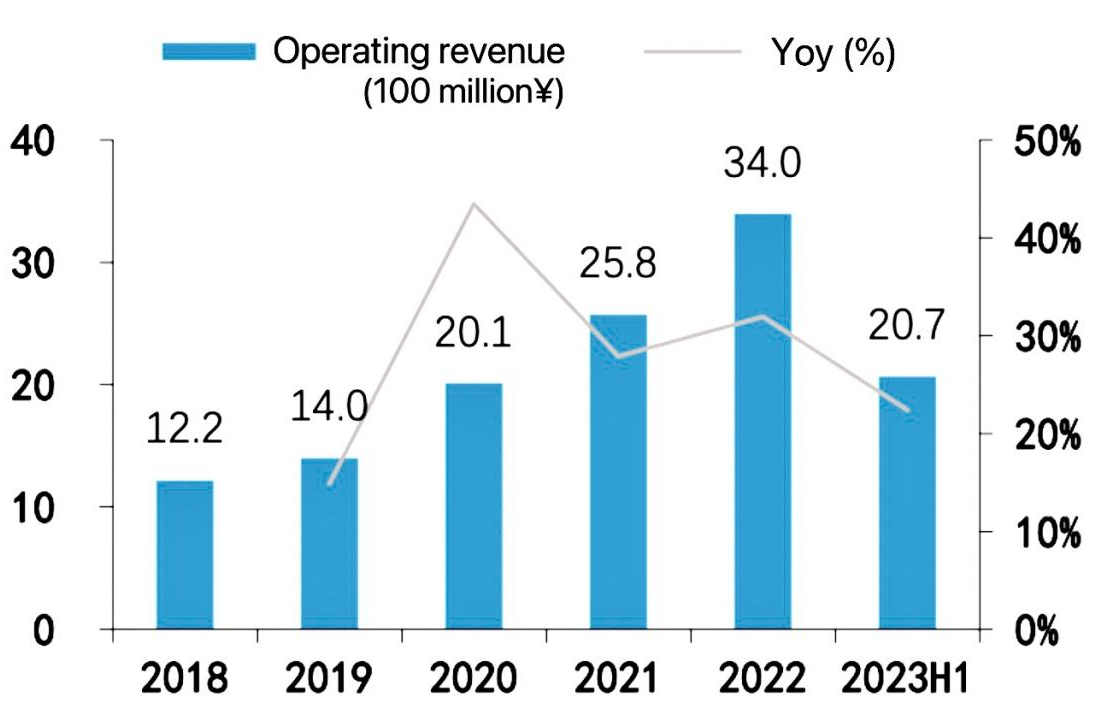
Figure 2: Company’s Revenue and Growth Rate 2018-2023H1.
(Data source: Essence Securities, Company’s Prospectus)
3.2.2. Main Business Income Composition
For products, the company mainly includes snacks, staple foods, nutraceuticals, and other three categories. Snacks and staple foods accounted for 57.8% and 41.1% of revenue in 2022, respectively. (Figure 3) Staple food is designed to meet the daily comprehensive nutritional requirements of dogs and cats. Revenue of $1.39 billion/+52.2% was realized in 2022, with CAGR reaching 42.1% from 2018-2022. Staple food products account for more than half of the company’s own-brand products, and its rapid development led to overall revenue growth in staple foods and a sustained increase in its share. Snacks are mainly made from livestock and poultry meat, fish, etc., and intended to supplement single or partial nutrients, regulate taste, enhance interaction, and assist in training. Revenue of $19.5 billion/+22.2% was realized in 2022, with CAGR reaching 19.9% from 2018-2022. Nutraceuticals mainly refer to nutritional supplements containing functional ingredients such as dried lecithin and calcium lactate, accounting for a relatively small proportion of revenue but maintaining a high growth rate. CAGR reached 103.5% from 2018-2022.
Figure 3: Categories.
(Data source: Essence Securities, Company’s Prospectus)
For regions, the company’s overseas revenue is growing steadily, while the proportion of domestic revenue is also gradually growing. The company is actively developing new customers in international markets. Overseas revenue mainly comes from North America, Europe and other regions, more than 90% of snack products. North America/Europe will account for 30.8%/7.0% of revenue in 2022. The proportion of domestic revenue has gradually increased from 44.4% in 2018 to 60.3% in 2022, mainly staple foods and snacks. (Figure 4)
Figure 4: Regions.
(Data source: Essence Securities, Company’s Prospectus)
For business model, the company has its brand business model, OEM/ODM business model and brand agency business model.
Own brand business model: In 2022, the revenue reached 2.05 billion yuan /+53.8%, accounting for 60.6% of the main business, with the primary market concentrated in China. The sales modes for this market include direct selling, distribution, and supermarket sales. However, the direct selling mode is the main focus for expansion.
OEM/ODM: In 2022, the revenue reached 1.19 billion yuan /+0.5%, accounting for 35.3% of the main business. In 2020, overseas orders increased significantly due to capacity releases from Thai factories and the active development of new customers despite the pandemic. However, in 2022, due to inflation, overseas OEM/ODM revenue is expected to decrease by 8.2%. On the bright side, domestic OEM/ODM business grew considerably, with a growth rate of 165.9%, owing to production capacity improvements.
Brand Agent Business: In 2022, the revenue reached 1.4 billion yuan, accounting for 4.2% of the central business. Mainly because the company became one of the sole agents of New Zealand brands “K9Natural” and “Feline Natural” in April 2021. (Figure 5)
Figure 5: Business Patterns.
(Data source: Essence Securities, Company’s Prospectus)
3.3. Challenges and Risks
3.3.1. External Issues
1) The Competition in the domestic market is intensifying
The pet food industry in the domestic market is in a rapid development period, so there is a great market prospect. In the domestic pet food market competition, the foreign-funded enterprises, represented by Mars and Nestle Purina, have leveraged their technological expertise, strong brand effect, and channel structure to secure a significant market share. Even so, various competitors, which attract customers with low-price promotions, flood the market. Even though it may disturb the price market and have a particular impact on the market share of the head players in the short term, after all, to avoid the risk of market expansion failure, the company must accelerate technological innovation, improve product quality, and explore new markets amid intense competition.
2) Unfavorable overseas market expansion
The company’s primary source of revenue comes from overseas markets, including North America, Europe, Asia, and other regions, focusing on the United States. However, due to the trade friction between China and the U.S., the price advantage of the products for export to the U.S. has been weakened. On the other hand, the OEM/ODM model has a high demand for labour resources. As global economic integration advances, emerging economies like Thailand and Vietnam will likely have a competitive edge in the pet food market with low labour costs. In summary, the company’s export business may face risks from declining market demand and impaired operating results in the future [9].
3.3.2. Internal Issues
1) Technological innovation and R&D
The technical level is the basis to ensure an enterprise’s core competitiveness and sustainable profitability. However, pet food is a fast-moving consumer good which is updated quickly. To keep up with the ever-changing industry trends and production processes, the company must swiftly respond to the demands of its customers for advanced technology and innovative products. It is crucial to launch products that cater to the needs of the market. If the company fails to invest enough money in product development and its technology research team, it may lose its technological advantage in the marketplace and affect its sustainable development.
2) The quality control of product
In the current world, consumers are becoming more concerned about food safety issues due to their heightened awareness of food safety and their rights. The company focuses on producing and selling pet food. If there are accidents related to product quality due to the lack of strict enforcement of quality control standards or the failure of upstream suppliers to provide safe and high-quality raw materials, the company’s reputation and brand image will be severely negatively affected, thereby affecting the company’s future operating performance. As a result, the company is at risk of product quality control.
3) Brand risk
Animal protection is becoming increasingly popular with the growing number of pet owners. The company should observe pets, collect data on product development and use visual media for branding, such as pet photography. Violent treatment or mishandling of pets can generate negative press and affect the company’s image. In addition, its “Mafudi” brand has strong brand influence, a good reputation, and wide popularity in the industry, so there is a high risk that the company’s brand will be imitated or misappropriated. Once the company has been infringed on the brand, it may decrease consumer trust, which may hinder its marketing and sales programs.
4. Valuation Analysis of FECF
4.1. Valuation Ideas
The formula of the FCFE steady growth model as Equation2:
\( {P_{0}}={FCFE_{1}}/(r-g) \) (2)
In the formula, P0 is the current value of the stock, i.e., the value of equity capital in the model is determined by three factors: the cost of equity capital or the investor’s required rate of return, r, the expected FCFE for the next year, and the fixed growth rate of the FCFE, g. Therefore, the CAPM model is used to determine the cost of equity capital, r, firstly. Then, China’s rate of GDP increase is used to confirm g [10]. Finally, the Equation 1 is applied to determine the FCFE [11][12].
4.2. Specific Calculation
(1) Acquire ri
The formula of CAPM as Equation3:
\( {r_{i}}={r_{f}}+β({r_{m}}-{r_{f}}) \) (3)
ri is the expected yield of stock i, rf is the risk-free rate, rm is the expected return on the market portfolio, and β is the beta coefficient [13].
This paper selects China’s one-year Treasury bill rate in 2022 as the risk-free rate, rf =3%; the Shanghai Stock Exchange index (SSEC, SH000001) is the closest index to the market portfolio. Estimating rm using the average daily return rate from 16 August to 8 September 2023. Its average yield is -0.05%, and assuming there is no change in the risk premium required by present and future investors, The daily return rate of the stock and that of the SSEC from 16 August to 6 September 2023 were selected for the regression analysis, then the regression result shows that the coefficient of determination R2=0.0109 and the regression coefficient β=0.0057 [14]. The figure 6 below shows the aggregated regression results:
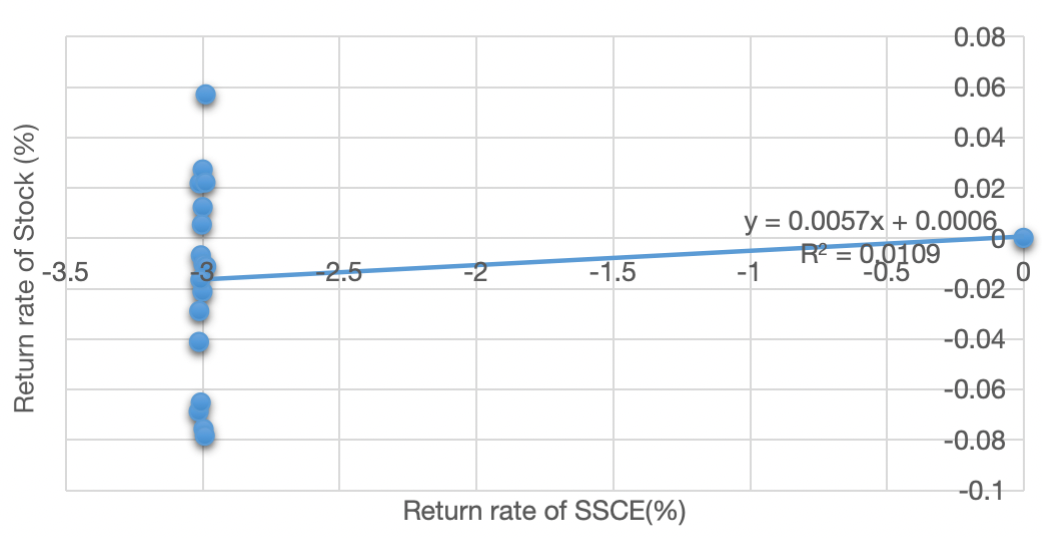
Figure 6: Linear fitting graph.
Finally, bringing rf =3%, rm=-0.05%, and β=0.0057 into the Equation3:
ri=3%+0.0057×(-0.05%-3%)=2.9826%(3)
(2) Acquire g
Table 1: China’s GDP growth rate in 2018-2023.
Years | 2018 | 2019 | 2020 | 2021 | 2022 | 2023 |
GDP growth rate(%) | 6.7% | 6% | 2.2% | 8.4% | 3% | 5% (forecast) |
(Data source: China Economic Information)
The arithmetic mean of China’s GDP growth rate from 2018 to 2023 is the stable growth rate g: g=5.217%. (Table 1)
(2) Ensure FCFE
Based on the calculation formula of FCFE, the following table is shown:
Table 2: Equity free cash flow statement. (Unit:1,000 CNY).
Year | 2020 | 2021 | 2022 | 2023 (forecast) | Growth Rate (%) |
EBIT(1-t) | 111,484 | 141,810 | 265,654 | 327,153 | 0.232 |
+Dep. | 147,776 | 221,503 | 307,590 | 385,437 | 0.253 |
-Capital Exp. | 210,367 | 98,342 | 179,858 | 132,345 | -0.264 |
- \( ∆ \) WC | 46,294 | 77,804 | 232,487 | 305,057 | 0.312 |
-Payment of Debt | 454,940 | 562,092 | 695,180 | 538,805* | -0.225 |
+Issuance of Debt | 323,574 | 741,347 | 414,191 | 393,481* | -0.050 |
=FCFE | -128,767 | 366,422 | -120,090 | 129,864 | -0.081 |
(Data source: Annual Financial Report of Gambol Pet Group Co., Ltd.)
The FCFE Model is unavailable because the FCFE in 2023 is negative. So, to get a positive FCFE, the writer first decided to forecast the other values in 2023. Linear prediction models are built based on the data for the last three years before giving a positive FCFE in 2023. It is worth noting that the payment or debt issuance values in recent years have been unstable, so adjusting these two forecast values in 2023 is necessary. So, based on relevant data in 2018, 2019, and the first quarter of 2023, their growth rates were revised downwards to -0.225 and -0.050, respectively. (Table 2)
According to Equation 2, bring g=5.217%, r=2.9826% into this model, and g2023=5%, P2023=FCFE2023×(1+g2023)/(r-g)=129,864×1.05/(0.029826+0.05217)=166,297,3.8(1,000 CNY)So, the stock price of Gambol Pet Group Co., Ltd. Is 166,297,380,0 CNY. Until 8 September 2023, the amount of circulation stocks is 37,560,100, which can be used to forecast the price per share in 2023: 166,297,380,0/37,560,100=44.275 CNY.
5. Conclusion
This paper adopts the FCFE Model to discuss the valuation of Gambol Pet Group Co., Ltd.. Overall, based on the final result, its predicted price per share in 2023 is 44.28 CNY, which means investors interested in this firm can consider investing in its stock. However, the economy is still recovering after the pandemic. Although this firm has great potential in the pet industry, investors need to make decisions carefully.
FCFE Model focuses on the company’s future performance and long-term development, and it can evaluate the valuation of firms according to their financial statements [15]. However, this model has some limitations: if the value of free cash of equity is negative, it will lead to inaccurate predicted value; the setting of relevant parameters has certain subjectivity. In addition, the accuracy of the prediction is affected because relevant data is few. In the future, if there is enough observation data, then the forecast result will be more accurate and significant.
References
[1]. Cegłowski, B., Podgorski, B. (2012). Equity Shares Equating the Results of FCFF and FCFE Methods. e-Finanse Financial Internet Quarterly, 8(2).
[2]. Eva, H. (2010). Method of Banks Valuation. Economic Analysis ,0013-3213.
[3]. Paweł M., Franjo M. (2014). The superiority of FCFF over EVA and FCFE in capital budgeting. Economic Research-Ekonomska Istraživanja, 27(1), 559-572, DOI: 10.1080/1331677X.2014.974916
[4]. Kusumanisita, A. I., Minanti, F. H. (2021). Stock Valuation Analysis of Dividend Discount Model, Free Cash Flow to Equity and Walter Model in Investment Decision. Agregat: Jurnal Ekonomi dan Bisnis, 5(1), 78-96.
[5]. Tan, W. K., Wang, Y. C. (2023). Valuing Commercial Banks in Indonesia: FCFE Model Outperforms DDM Model. In International Conference on Intellectuals’ Global Responsibility, 651-659.
[6]. Jiajing C. (2015). Valuation Analysis of Meike Home Furnishings Enterprise Based on FCFE Stable Growth Model. Business,17, 170-170.
[7]. Zitian T., Yabing T. (2023). Domestic pet consumer brands on the rise. Nanfang Daily, A05.
[8]. Pengfei Z. (2023). Pet Food Industry Leader Gambol Pet Group Co., Ltd. landed on the Growth Enterprise Market (GEM). China Securities Journal, A08.
[9]. Tongyao Z., chuanyue Y. (2018). “Gambol Pet” in Global Perspectives. Go to the World, 44, 30-31.
[10]. Khoa, B. T., Huynh, T. (2021). Support Vector Regression Algorithm Under in the CAPM Framework. In 2021 International Conference on Data Analytics for Business and Industry (ICDABI), 186-190
[11]. Zhongyuan G., Shuibin G. (2018). Research on the value evaluation of e-commerce enterprises based on FCFE discount method - A case study of Suning Commerce Group. Business accounting, 8, 21-24.
[12]. Fang X. (2016). The Application of FCFE Model in the Valuation of Listed Companies--Taking Beijing Tongrentang as an Example. Modern economic information, 7, 243-244.
[13]. Jezkova, V., Rowland, Z., Machova, V., Hejda, J. (2020). The Intrinsic Value of an Enterprise Determined by Means of the FCFE Tool. Sustainability, 12, 8868. https://doi.org/10.3390/su12218868
[14]. Wijaya, E., Ferrari, A. (2020). Stocks investment decision making capital asset pricing model (CAPM). Jurnal Manajemen, 24(1), 93-108.
[15]. Al-Zararee, A. N., Al-Azzawi, A. (2014). The impact of free cash flow on market value of firm. Global Review of Accounting and Finance, 5(2), 56-63.
Cite this article
Yang,X. (2024). Investment Strategy Analysis of The Gambol Pet Group Company Based on the FCFE Model. Advances in Economics, Management and Political Sciences,60,52-59.
Data availability
The datasets used and/or analyzed during the current study will be available from the authors upon reasonable request.
Disclaimer/Publisher's Note
The statements, opinions and data contained in all publications are solely those of the individual author(s) and contributor(s) and not of EWA Publishing and/or the editor(s). EWA Publishing and/or the editor(s) disclaim responsibility for any injury to people or property resulting from any ideas, methods, instructions or products referred to in the content.
About volume
Volume title: Proceedings of the 2nd International Conference on Financial Technology and Business Analysis
© 2024 by the author(s). Licensee EWA Publishing, Oxford, UK. This article is an open access article distributed under the terms and
conditions of the Creative Commons Attribution (CC BY) license. Authors who
publish this series agree to the following terms:
1. Authors retain copyright and grant the series right of first publication with the work simultaneously licensed under a Creative Commons
Attribution License that allows others to share the work with an acknowledgment of the work's authorship and initial publication in this
series.
2. Authors are able to enter into separate, additional contractual arrangements for the non-exclusive distribution of the series's published
version of the work (e.g., post it to an institutional repository or publish it in a book), with an acknowledgment of its initial
publication in this series.
3. Authors are permitted and encouraged to post their work online (e.g., in institutional repositories or on their website) prior to and
during the submission process, as it can lead to productive exchanges, as well as earlier and greater citation of published work (See
Open access policy for details).
References
[1]. Cegłowski, B., Podgorski, B. (2012). Equity Shares Equating the Results of FCFF and FCFE Methods. e-Finanse Financial Internet Quarterly, 8(2).
[2]. Eva, H. (2010). Method of Banks Valuation. Economic Analysis ,0013-3213.
[3]. Paweł M., Franjo M. (2014). The superiority of FCFF over EVA and FCFE in capital budgeting. Economic Research-Ekonomska Istraživanja, 27(1), 559-572, DOI: 10.1080/1331677X.2014.974916
[4]. Kusumanisita, A. I., Minanti, F. H. (2021). Stock Valuation Analysis of Dividend Discount Model, Free Cash Flow to Equity and Walter Model in Investment Decision. Agregat: Jurnal Ekonomi dan Bisnis, 5(1), 78-96.
[5]. Tan, W. K., Wang, Y. C. (2023). Valuing Commercial Banks in Indonesia: FCFE Model Outperforms DDM Model. In International Conference on Intellectuals’ Global Responsibility, 651-659.
[6]. Jiajing C. (2015). Valuation Analysis of Meike Home Furnishings Enterprise Based on FCFE Stable Growth Model. Business,17, 170-170.
[7]. Zitian T., Yabing T. (2023). Domestic pet consumer brands on the rise. Nanfang Daily, A05.
[8]. Pengfei Z. (2023). Pet Food Industry Leader Gambol Pet Group Co., Ltd. landed on the Growth Enterprise Market (GEM). China Securities Journal, A08.
[9]. Tongyao Z., chuanyue Y. (2018). “Gambol Pet” in Global Perspectives. Go to the World, 44, 30-31.
[10]. Khoa, B. T., Huynh, T. (2021). Support Vector Regression Algorithm Under in the CAPM Framework. In 2021 International Conference on Data Analytics for Business and Industry (ICDABI), 186-190
[11]. Zhongyuan G., Shuibin G. (2018). Research on the value evaluation of e-commerce enterprises based on FCFE discount method - A case study of Suning Commerce Group. Business accounting, 8, 21-24.
[12]. Fang X. (2016). The Application of FCFE Model in the Valuation of Listed Companies--Taking Beijing Tongrentang as an Example. Modern economic information, 7, 243-244.
[13]. Jezkova, V., Rowland, Z., Machova, V., Hejda, J. (2020). The Intrinsic Value of an Enterprise Determined by Means of the FCFE Tool. Sustainability, 12, 8868. https://doi.org/10.3390/su12218868
[14]. Wijaya, E., Ferrari, A. (2020). Stocks investment decision making capital asset pricing model (CAPM). Jurnal Manajemen, 24(1), 93-108.
[15]. Al-Zararee, A. N., Al-Azzawi, A. (2014). The impact of free cash flow on market value of firm. Global Review of Accounting and Finance, 5(2), 56-63.