


1. Introduction
The Bitcoin is a decentralized crypto currency which was firstly mined by a group of anonymous pioneers under the pseudonym, named as “Satoshi Nakamoto” on January 3, 2009, and it operates on a peer-to-peer network called the blockchain [1]. On October 31, 2008, Nakamoto published the original Bitcoin whitepaper titled “Bitcoin: A Peer-to-Peer Electronic Cash System” on a cryptography mailing list and this whitepaper introduced a decentralized peer-to-peer protocol with robust cryptographic security, which signified the birth of Bitcoin [2]. Later, during February 2011, the value of Bitcoin reached to its peak, hitting $1.06, but the price of Bitcoin soared to a new record-breaking price which was at $19,783.06 in December 2017 [3].
The financial field is always regarded as a forward-looking field of testing machine learning algorithms, since the prices of financial assets are more likely to be chaotic, volatile and non-linear, which lead to the increase in difficulty of predictions. Plenty of famous organizations such as American Accounting Associates (AAA) and EMERJ have already developed their own research areas, such as RNN, LSTM models have all been shown to be effective in forecasting future financial trends in stocks, shares, currency flow and other financial assets [4]. Although these studies of advanced machine learning models and time series prediction were widely applied in the predictions of various types of financial assets, there are seldom researches of Bitcoin price prediction by implementing high-level machine learning models. In the past decades, the Bitcoin price has experienced a series of fluctuations, which means it also shows a valuable signal in testing machine learning models. This paper plans to forecast the future trend of Bitcoin price by applying ARIMA, SARIMA and multiple linear regression model, and evaluate which model is more precise and accurate to show the future trend of bitcoin price through comparing the graphs as well as the training error and test error.
2. Literature review
While there is a group number of literatures on Bitcoin prices forecasting models, ARIMA model remains prominent in short and medium-term analysis. Based on the study by Roche & Caton in 2018, Long Short-Term Memory models (LSTM) and Recurrent Neural Network (RNN) show better performance than ARIMA in predicting long-term trends of Bitcoin prices [5]. Similarly, Azari examines the accuracy of ARIMA for a three-year time series and finds their effectiveness in short-term predictions compared to long-term predictions [6]. This paper indicates that as the length of predictions increases, the occurrence of predictive errors increases since the Bitcoin prices tend to jump or drop suddenly.
In a study conducted by Munim, Shakil, & Alon in 2019, they compare the results of Neural Network Autoregression (NNAR) and ARIMA in Bitcoin prices prediction using data for two time periods, which were from January 2012 to May 2013 and up to June 2017 [7]. The study highlights that ARIMA outperforms in this comparison during these volatile periods and exhibit higher predictive accuracy. Furthermore, Twarakavi & Bansal evaluate the performances of Deep Learning (DL) models ARIMA through measuring their Mean Squared Error values and the results show that ARIMA performs better than DL models overall [8]. From the research published by the Istanbul university in 2021, this paper applied ARIMA model as well and achieved the test error including Mean Absolute Percentage Error and Root Mean Square Error, which is 4.24% and 0.46 respectively [9].
In the research studied by Mittal in 2018, the prediction of various cryptocurrency prices, applying linear regression model, shows an accuracy of 99.3% using the data including open, low, and high cost [10]. Although this study shows a high-level predictive performance, the data set is relatively small for testing a model to run under the real circumstances. From a paper published in Indian Journal of Science and Technology in 2021, the method applied was simple linear regression and achieved a high accuracy which is 99.97% in both training and test set [11].
Based on the existing papers studied by a group of financial scholars, ARIMA seems to be a mainstream forecasting model in short and medium-term predictions and used to cooperate with other types of models in order to achieve higher accuracy. Meanwhile, the studies applying linear regression models are relatively scarce, but it still contributes a reliable prediction result.
3. Methodology
3.1. ARIMA & SARIMA
There are plenty of advantages of applying ARIMA and SARIMA to predict the Bitcoin price. Firstly, both of these two models are based on solid time series forecasting method, which can capture historical trends and patterns of Bitcoin price. Secondly, the differencing operation that is one of the most significant sections in the models can deal with the trends and seasonality in Bitcoin price. Through applying differencing, it tends to eliminate the lone-term trends and make the models concentrated on short-term fluctuations and cycles. Moreover, these two models can better fit the variations of Bitcoin price since they can evaluate parameters based on historical data. This means that the models can reflect the properties of historical prices more accurately through selecting appropriate orders of the AR, I, and MA.
3.1.1. ARIMA
ARIMA has been regarded as one of the most widely applied algorithms in forecasting time-series data [12]. The ARIMA model named as Autoregressive Integrated Moving Average was first invented by Box and Jenkins, which can be used for predicting the future values effectively based on the historical data of the variables, applying time series forecasting method [13]. ARIMA involves three sections including the Autoregressive (AR) model, Differencing I (d), and the Moving Average (MA) model [9]. The AR component in ARIMA considers the dependency of the current observation on past observations and it assumes that the current value is linearly correlated with its past values at a given time. Differencing, the order of integration, is applied to transform the time series into stationary and stationarity implies that the statistical characters of the data, including the variance and mean. Moreover, differencing also involves deducting the current value from a past value to eliminate the seasonality as well as trends. The MA takes into account the dependency of the current observation and a residual error from a MA model applied to lagged observations and it assumes that the current values are correlated with the average of previous errors.
In general, an ARIMA model is represented as ARIMA (p, d, q), where “p” refers to the order of AR, which means the number of previous lags of the variable considered in this model. While “d” is the level of the regression that is required to transform the series into stationary. The “q” represents the number of lagged residuals considered in this model.
Mathematically, the ARIMA process can be represented as:
\( (1-{ϕ_{1}}B-{ϕ_{2}}{B^{2}}-⋯-{ϕ_{p}}{B^{p}}){(1-B)^{d}}{Y_{t}}=c+(1+{θ_{1}}B+{θ_{2}}{B^{2}}+⋯+{θ_{p}}{B^{p}}){ε_{t}} \) | (1) |
Where:
\( {Y_{t}} \) refers to the time series date at time t.
B is the backshift operator, where \( {B_{i}}{Y_{t}}={Y_{t-i}} \) .
\( {ϕ_{1}} \) , \( {ϕ_{2}} \) , \( ⋯ \) \( {ϕ_{p}} \) are the AR parameters in the model.
\( {θ_{1}} \) , \( {θ_{2}} \) , \( ⋯ \) \( {θ_{p}} \) are the MA parameters in the model.
d represents the order of differencing applied to make the time series stationary.
\( {ε_{t}} \) is the error term.
c is the constant term.
3.1.2. SARIMA
The SARIMA named as Seasonal Autoregressive Integrated Moving Average, which is an extension of the ARIMA, but involves seasonal components in the time series forecasting method. It is especially useful when predicting data shows both non-seasonal and seasonal patterns. SARIMA also involves three sections including AR, d, and MA, which are similar to the ARIMA model, whereas, it increases three seasonal components including seasonal autoregressive (SAR), seasonal differencing I (SI), and seasonal moving average (SMA).
The mathematical expression of a SARIMA (p, d, q) (P, D, Q, s) can be shown as:
\( (1-{ϕ_{1}}B-{ϕ_{2}}{B^{2}}-⋯-{ϕ_{p}}{B^{p}})(1-{β_{1}}{B^{t}}-{β_{2}}{B^{2t}}-⋯-{β_{p}}{B^{pt}}){(1-B)^{d}}{(1-{B^{t}})^{D}}({Y_{t}}-μ)=(1+{θ_{1}}B+{θ_{2}}{B^{2}}+⋯+{θ_{p}}{B^{p}})(1+{δ_{1}}{B^{t}}+{δ_{2}}{B^{2t}}+⋯+{δ_{p}}{B^{pt}}){(1-B)^{d}}{(1-{B^{t}})^{D}}{ε_{t}} \) | (2) |
Where:
\( {Y_{t}} \) is the time series data.
B is the backshift operator for non-seasonal differences.
\( {B^{t}} \) is the backshift operator for seasonal differences.
\( {ϕ_{1}} \) , \( {ϕ_{2}} \) , \( ⋯ \) \( {ϕ_{p}} \) are the non-seasonal AR parameters in the model.
\( {β_{1}} \) , \( {β_{2}} \) , \( ⋯ \) \( {β_{p}} \) are the seasonal AR parameters in the model.
\( {θ_{1}} \) , \( {θ_{2}} \) , \( ⋯ \) \( {θ_{p}} \) are the non-seasonal MA parameters in the model.
\( {δ_{1}} \) , \( {δ_{2}} \) , \( ⋯ \) \( {δ_{p}} \) are the seasonal MA parameters in the model.
D represents the order of non-seasonal differencing applied to make time series into stationary.
D represents the order of seasonal differencing applied.
\( μ \) is the mean of time series data.
\( {ε_{t}} \) is the error term.
3.2. Multiple Linear Regression Model
There are also several advantages of applying linear regression model to predict Bitcoin price. On one hand, since Bitcoin price is affected by a series of variables, including market demand, investor sentiment, trading volume, and regulatory changes, the multi-linear regression model can take into account all of these potential factors and capture their combined effect on Bitcoin price prediction. Furthermore, multi regression model can analyze the relationship between bitcoin price and those multiple factors simultaneously and help to reveal the impact of different variables on bitcoin price. On the other hand, this model can also control confounding factors and assess the unique contribution of each variable to the bitcoin price. It helps identify the factors that significantly effect on price changes.
The multiple linear regression model is a statistical machine learning that builds a linear relationship, shown as a dependent variable correlates with two or more independent variables. In multiple linear regression, the dependent variable is predicted based on a linear combination of multiple independent variables. In this paper, the historical data set and trading volume were applied as the independent variables and bitcoin price was the dependent variable. Then, the economic model of bitcoin price can be shown as:
\( bitcoin price=f(historical data set, trading volume) \) | (3) |
In linear regression model, the function can be shown as:
\( bitcoin price= {β_{0}}+{β_{1}}data+{β_{2}}volume+u \) | (4) |
Where:
\( {β_{0}} \) , \( {β_{1}} \) , \( {β_{2}} \) are three unknown parameters.
u is an error term. It represents everything else that may affect wages other than the level of historical price and trading volume.
However, when generalizing for k explanatory variables, assume that the independent variables \( {y_{i}} \) is determined by the Bitcoin price:
\( {y_{i}}={β_{0}}+{β_{1}}{x_{1i}}+{β_{2}}{x_{2i}}+ \cdot \cdot \cdot +{β_{k}}{x_{ki}}+{u_{i}} \) | (5) |
Where:
\( i=1, ⋯, n \) and each observation ( \( {y_{i}} \) , \( {x_{1i}} \) , \( ⋯ \) , \( {x_{ki}}) \) is statistically independent of every other observation.
\( {β_{0}} \) is the intercept or constant term.
\( {β_{1}} \) , \( {β_{2}} \) , \( ⋯ \) , \( {β_{k}} \) are the coefficients or slopes associated with each independent variable.
\( {u_{i}} \) is the error term, that represents the random variation or unexplained part considered in the model.
4. Data Analysis
4.1. Data Description, Data Exploration & Data Preprocessing
The data set is cited from the Kaggle which is published by Mhaske in 2023, this data set contains the historical data of the Bitcoin prices from January 1 in 2012 to March 31 in 2021. In data exploration, this paper cited the notebook studied by Mhaske. After loading the dataset and uploading into the Python notebook, the results show that there are plenty of NaN, which means that a group number of missing values exist in the data set.
Then, in the data preprocessing, checking for missing values is important. From the result, it shows that there are 1243608 missing values in open, high, low, and close data sets. Then, converting Unix time to datetime and resampling to daily, monthly, annual, and quarterly frequency. Finally, using fillna to handle with these missing values.
4.2. Exploratory data analysis
After handling with the missing values, the boxplot graph of bitcoin daily trading volume by moth, which is applied in the linear regression model as a variable, can be derived and shown as in Figure 1:
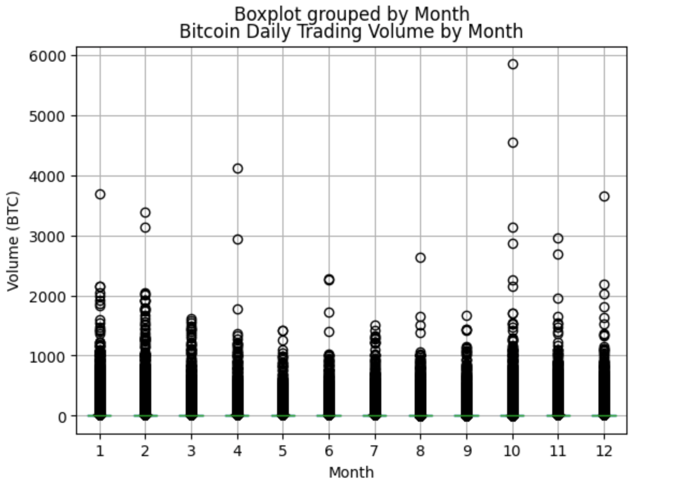
Figure 1: Bitcoin daily trading volume by month boxplot
From the Figure 1, the volume of bitcoin price was focused on most of the months was about 1500 and the highest volume occurs in October, which was almost 6000.
5. Results and Discussion
5.1. Model selection
The data set is now split into training set and test set in order to examine the training and test error separately. In the prediction of ARIMA, order of ARIMA (1, 1, 1) was applied and the additional seasonal order of SARIMA applied was SARIMA (0, 1, 1, 12). The historical data and trading volume were used to predict the Bitcoin price as the independent variables.
5.2. Prediction results
After dealing with the problem of processing data and run the Python code, the graph of prediction of bitcoin price trend was derived and shown as in Figure 2:
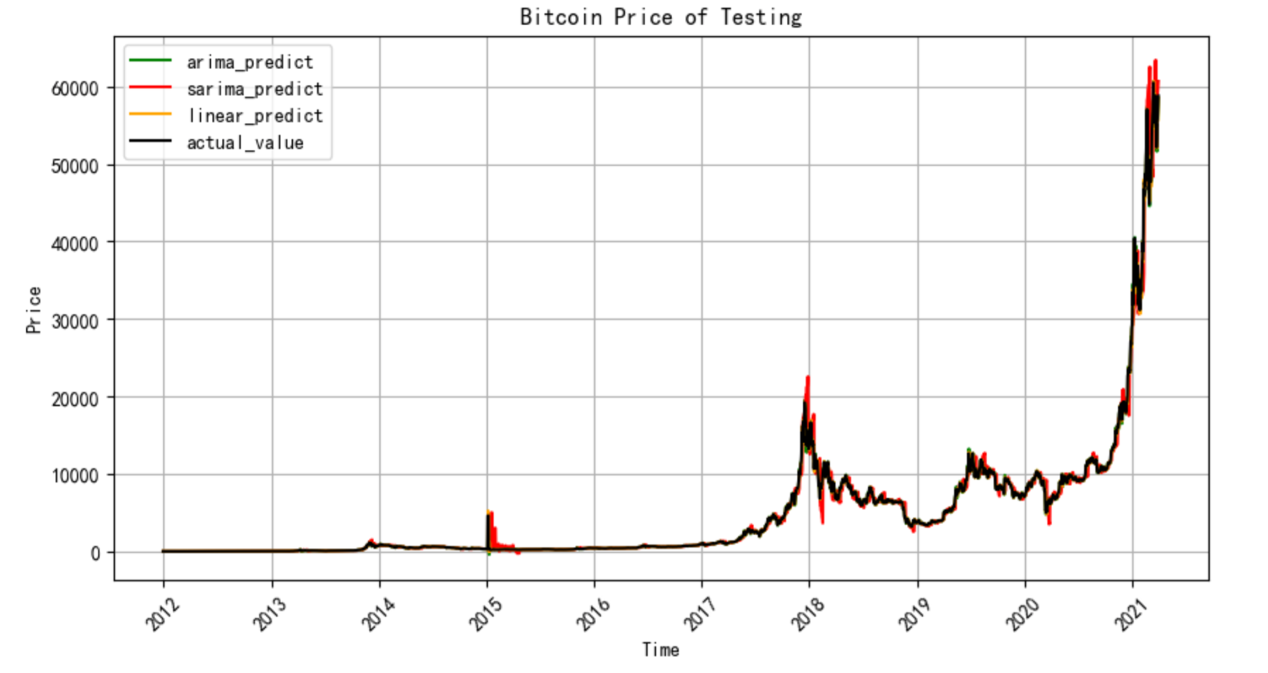
Figure 2: Bitcoin price prediction graph
From the Figure 2, the predictions of future trend of bitcoin price from 2012 to 2021 through applying three different models are clearly demonstrated. From the perspective of overall price change, these three models show the similar overall trend of price prediction comparing with the actual value, which states that the bottom price of Bitcoin would be occur from 2012 to 2014, that is around $1000. After that the bitcoin price reached to the first peak at approximately $5000 in 2015 and tended to increase gradually from 2016. It was worth to note that the price of Bitcoin increased suddenly from 2017 to 2018 and the Bitcoin price reached to its new peak, hitting almost $20000 at the end of 2017. However, the bitcoin price experienced a series of fluctuations and started to decline from 2018, and the price continued to decrease till the end of 2018, which also means that the Bitcoin market was depressed during the whole 2018. Since the value of bitcoin was always increasing started from 2017, this led a group of investors to be bullish on the bitcoin market, but most of those investors tended to be disappointed. However, there was a signal of recovery in the Bitcoin market in the beginning of 2019 and showed a series of fluctuations again till the end of 2020 but increased suddenly in 2021 and reached to the highest peak between 2012 and 2021, which was over $60000. In terms of the extent to which the graph fits historical data set, it seems to be that ARIMA, and multi-linear regression model predict more accurately than SARIMA. The results of prediction by ARIMA and linear regression can better match the real historical price trend, while SARIMA showed an obvious deviation comparing with actual value (See Figures 3 and 4).
Figure 3: Test error comparison graph
Since the data set was split into training set and test set. The bar charts of test error and training error are shown separately. Firstly, in the terms of test error, the mean squared error of ARIMA, SARIMA, and regression model are about 1051326.47, 9003567, 1037426.20 respectively, which evaluates the accuracy and goodness of fit. It measures the average squared difference between the predicted values of a model and the actual observed values. Take MSE of ARIMA as an example, the MSE is 1051326.47, indicates that the predictions of ARIMA deviate from actual values by approximately 1051326.47 units on average and shows a signal of less accurate prediction, while the MSE of SARIMA is much higher than ARIMA and linear regression. In terms of mean absolute error, it also evaluates the average magnitude of errors but measures the average absolute difference. The MAE of SARIMA is also the highest in test error, which is about 1606.62. Compare with the MSE and MAE in the other two models, SARIMA shows a lack of capacity to capture the properties of Bitcoin prices, which are non-seasonality, and this also means that the graph cannot fit the historical data well.
Figure 4: Train error comparison graph
In the section of training error, the SARIMA also shows a worse predictive performance compare with ARIMA and linear regression. The MSE of SARIMA is about 511582.90, but the value of ARIMA and linear regression are 51220.86 and 46142.72, which is much higher than them and shows that this model is less precise in the prediction. In terms of MAE, three models show similar values of errors, but SARIMA still seems to predict less accurately in training set.
From both of Figure 3 and 4, SARIMA seems to be the least accurate model in the prediction of Bitcoin price, whereas ARIMA and linear regression show the similar abilities to forecast its price relatively more efficiently. While SARIMA is designed to capture the seasonality in the data, and the Bitcoin prices are less likely to exhibit strong seasonal patterns comparing with other types of time series data, such as monthly or quarterly data. In the comparison of ARIMA and linear regression, taking into account the properties of Bitcoin prices data, ARIMA is relatively more appropriate than linear regression. Since the relationships between Bitcoin price and its various factors are less likely to be strictly linear, which means that linear regression model tends to fail to capture complex nonlinear patterns.
6. Conclusion
To sum up, ARIMA and linear regression exhibit higher level of predictive performance than SARIMA after comparing the prediction graphs, training error and test error. Due to the non-seasonal characteristics of Bitcoin prices data, SARIMA is less likely to be ideal in the prediction of Bitcoin prices and ARIMA model is relatively appropriate in these three models. However, comparing with the accuracy provided by other similar research in the literature review, these three models are less accurate in the predictive results, which means that they are less advanced when applying in the prediction of complex price data, and they are supposed to be cooperated with more sophisticated learning models to process more complicated data.
References
[1]. Sin E, Wang L. (2017) Bitcoin price prediction using ensembles of neural networks. 13th International conference on natural computation, fuzzy systems and knowledge discovery, 666–671.
[2]. Nakamoto, S. (2008) Bitcoin: A Peer-to-Peer Electronic Cash System. White Paper. Retrieved from https://www.ussc.gov/sites/default/files/pdf/training/annual-national-training seminar/2018/Emerging_Tech_Bitcoin_ Crypto.pdf.
[3]. Morris, D. Z. (2021) A brief history of bitcoin bubbles, Yahoo! Yahoo! Retrieved from https://www.yahoo.com/lifestyle/brief-history-bitcoin-bubbles-184720389.html
[4]. Henrique, B. M., Sobreiro, V. A., and Kimura, H. (2019) Literature review: Machine learning techniques applied to financial market prediction. Expert Systems with Applications, 124, 226-251.
[5]. McNally, S., Roche, J., and Caton, S. (2018) Predicting the price of bitcoin using machine learning. In 2018 26th euromicro international conference on parallel, distributed and network-based processing, 339-343.
[6]. Azari (2019). Bitcoin Price Prediction: An ARIMA Approach, Retrieved from https://arxiv.org/pdf/1904.05315.pdf.
[7]. Munim, Z. H., Shakil, Mohammad H., and Alon, I. (2019) Next-day bitcoin price forecast. Journal of Risk and Financial Management, 12(2), 103.
[8]. Twarakavi, M., and Bansal, Y. (2020) Bitcoin price prediction: a comparative study. International Journal of Advanced Research in Computer Engineering & Technology, 9(5), 147–150.
[9]. Benzekri, M.K., Ozutler, H.S. (2021) On the predictability of Bitcoin price movements: a short-term price prediction with ARIMA. İktisat Politikası Araştırmaları Dergisi - Journal of Economic Policy Research, 8(2), 293-309.
[10]. Mittal, R., Arora, S., and Bhatia, M. P. S. (2018) Automated cryptocurrencies prices prediction using machine learning. Division of Computer Engineering, Netaji Subhas Institute of Technology, India, 8, 2229-6956.
[11]. Ho A, Vatambeti R, Ravichandran SK. (2021). Bitcoin Price Prediction Using Machine Learning and Artificial Neural Network Model. Indian Journal of Science and Technology, 14(27), 2300-2308.
[12]. Weiss, E. (2000) Forecasting commodity prices using ARIMA. Technical Analysis of Stocks and Commodities, 18(1), 18-19.
[13]. Box, G. E., Jenkins, G. M., Reinsel, G. C., and Ljung, G. M. (2015) Time series analysis: forecasting and control. John Wiley & Sons.
Cite this article
Zhu,J. (2023). Bitcoin Price Prediction: ARIMA & SARIMA vs Linear Regression. Advances in Economics, Management and Political Sciences,61,47-54.
Data availability
The datasets used and/or analyzed during the current study will be available from the authors upon reasonable request.
Disclaimer/Publisher's Note
The statements, opinions and data contained in all publications are solely those of the individual author(s) and contributor(s) and not of EWA Publishing and/or the editor(s). EWA Publishing and/or the editor(s) disclaim responsibility for any injury to people or property resulting from any ideas, methods, instructions or products referred to in the content.
About volume
Volume title: Proceedings of the 2nd International Conference on Financial Technology and Business Analysis
© 2024 by the author(s). Licensee EWA Publishing, Oxford, UK. This article is an open access article distributed under the terms and
conditions of the Creative Commons Attribution (CC BY) license. Authors who
publish this series agree to the following terms:
1. Authors retain copyright and grant the series right of first publication with the work simultaneously licensed under a Creative Commons
Attribution License that allows others to share the work with an acknowledgment of the work's authorship and initial publication in this
series.
2. Authors are able to enter into separate, additional contractual arrangements for the non-exclusive distribution of the series's published
version of the work (e.g., post it to an institutional repository or publish it in a book), with an acknowledgment of its initial
publication in this series.
3. Authors are permitted and encouraged to post their work online (e.g., in institutional repositories or on their website) prior to and
during the submission process, as it can lead to productive exchanges, as well as earlier and greater citation of published work (See
Open access policy for details).
References
[1]. Sin E, Wang L. (2017) Bitcoin price prediction using ensembles of neural networks. 13th International conference on natural computation, fuzzy systems and knowledge discovery, 666–671.
[2]. Nakamoto, S. (2008) Bitcoin: A Peer-to-Peer Electronic Cash System. White Paper. Retrieved from https://www.ussc.gov/sites/default/files/pdf/training/annual-national-training seminar/2018/Emerging_Tech_Bitcoin_ Crypto.pdf.
[3]. Morris, D. Z. (2021) A brief history of bitcoin bubbles, Yahoo! Yahoo! Retrieved from https://www.yahoo.com/lifestyle/brief-history-bitcoin-bubbles-184720389.html
[4]. Henrique, B. M., Sobreiro, V. A., and Kimura, H. (2019) Literature review: Machine learning techniques applied to financial market prediction. Expert Systems with Applications, 124, 226-251.
[5]. McNally, S., Roche, J., and Caton, S. (2018) Predicting the price of bitcoin using machine learning. In 2018 26th euromicro international conference on parallel, distributed and network-based processing, 339-343.
[6]. Azari (2019). Bitcoin Price Prediction: An ARIMA Approach, Retrieved from https://arxiv.org/pdf/1904.05315.pdf.
[7]. Munim, Z. H., Shakil, Mohammad H., and Alon, I. (2019) Next-day bitcoin price forecast. Journal of Risk and Financial Management, 12(2), 103.
[8]. Twarakavi, M., and Bansal, Y. (2020) Bitcoin price prediction: a comparative study. International Journal of Advanced Research in Computer Engineering & Technology, 9(5), 147–150.
[9]. Benzekri, M.K., Ozutler, H.S. (2021) On the predictability of Bitcoin price movements: a short-term price prediction with ARIMA. İktisat Politikası Araştırmaları Dergisi - Journal of Economic Policy Research, 8(2), 293-309.
[10]. Mittal, R., Arora, S., and Bhatia, M. P. S. (2018) Automated cryptocurrencies prices prediction using machine learning. Division of Computer Engineering, Netaji Subhas Institute of Technology, India, 8, 2229-6956.
[11]. Ho A, Vatambeti R, Ravichandran SK. (2021). Bitcoin Price Prediction Using Machine Learning and Artificial Neural Network Model. Indian Journal of Science and Technology, 14(27), 2300-2308.
[12]. Weiss, E. (2000) Forecasting commodity prices using ARIMA. Technical Analysis of Stocks and Commodities, 18(1), 18-19.
[13]. Box, G. E., Jenkins, G. M., Reinsel, G. C., and Ljung, G. M. (2015) Time series analysis: forecasting and control. John Wiley & Sons.