


1.Introduction
In recent years, with the rapid economic development of the country's capital market, various types of financial derivative portfolio products have been continuously produced. At the same time, with the rapid development of the Internet industry, trading methods have gradually diversified, making the entire capital market continues to innovate and optimize. At the same time, with the development of modern asset theory, a variety of asset portfolio strategies can be used by us. As an industry that has developed rapidly in recent years, the pharmaceutical industry has increased its proportion in people's lives year by year, and the public's attention to this industry has increased, which requires a new asset portfolio to correspond to it.
For the current china’s capital market, there are many investment companies. When these companies invest, due to the unequal resource information, they cannot obtain timely and efficient information. Secondly, in the process of investment, each company's The amount of disposable assets held is different from the future investment expectations, which also have an impact on investment choices, so selective investment is crucial [1]. In the current complex and unpredictable financial market, how to choose a suitable and stable investment portfolio to increase the rate of return, while facing the risks caused by relevant national policies and changes in the economic situation can be minimized through diversified investments to avoid and reduce losses. As for how to choose a stock portfolio, most companies currently do not have the ability to choose, so they need relevant financial companies to select and optimize. According to the different requirements and preferences of different companies, corresponding asset portfolio strategies are used for investment. According to modern asset portfolio theory, Markowitz portfolio theory and CPAM model, this paper selects stocks with large growth space and can provide investment allocation value to optimize the analysis of the pharmaceutical industry. At the same time, use python and Excel software to verify it with the knowledge of quantitative finance, use qualitative research and quantitative research methods, qualitative research summarizes and summarizes modern asset theory, summarizes the selection methods of existing research on stocks, and determines the construction of this article The data capacity lays the foundation for the next step of selecting and grouping stocks, thereby building an effective asset portfolio strategy for china's pharmaceutical industry. Quantitative research uses Markowitz's portfolio theory to construct models, calculate weights, and depict the results in the form of charts, and use historical data to verify the effectiveness of this strategy.
2.Literature Review
Based on the company's investment portfolio strategy for the pharmaceutical industry, this article summarizes the literature on investment strategies and concludes that the core of modern investment portfolio theory is asset allocation, which reduces risks through diversified investment methods to maintain the stability of interest rates. While ensuring maximum profitability, the establishment of modern asset portfolio theory is based on the law of price fluctuations and its corresponding description and analysis. The current investment portfolio strategies include manual selection and automated delivery, while automated investment - robo - advisory is still in the development stage, and most relevant research nowadays is more biased towards qualitative research. The current relevant quantitative research optimizes and makes suggestions on its current situation and can complete the optimization of the investment portfolio. However, its return rate has not increased significantly due to the improvement of its risk level, and its slow development is also caused by its poor performance [2]. Therefore, the current basic theory for optimizing investment strategies is provided by modern asset investment theory. During verification, sharpe theory, standard deviation, average rate of return and comprehensive income are used to further analyze and evaluate the rate of return.
2.1.Modern Portfolio Theory
Modern asset theory was proposed by American economist Harry M. Markowitz. In the study, the two mathematical concepts of mean and variance were used to calculate the returns of asset portfolios, and diversified investments were explained. The knowledge of probability theory and absorptive algebra was used to calculate different Correlation between stocks or securities.
The calculation of MPT mainly uses the mean-variance model to construct the asset portfolio model [3]. First, different investment assets are allocated according to their proportions. In the model, the expected rate of return is the rate of return of securities, and the standard deviation is the risk of securities. Then use variance and covariance to calculate the risk of the portfolio, and the calculated minimum variance is the optimal portfolio [4, 5]. The mean-variance model proves to us the investor's attitude towards risk and return: when the return is certain, investors tend to invest in portfolios with less risk [6]. Markowitz put forward the theory of asset portfolio and selection through the relationship between rate of return and risk, which laid the foundation for the establishment and improvement of Modern Portfolio Theory (MPT). This theory emphasizes the importance of diversified investments. Investors can reduce non-systematic risks through diversified investments [1]. At the same time, due to the different correlations between assets, when the impact between assets is small or there is a negative correlation, each asset can undercut each other or offset each other's movements. The theory also proposes the concept of efficient frontier, which shows that the expected return of a portfolio is determined by the standard deviation of risk. As shown in Figure 1:
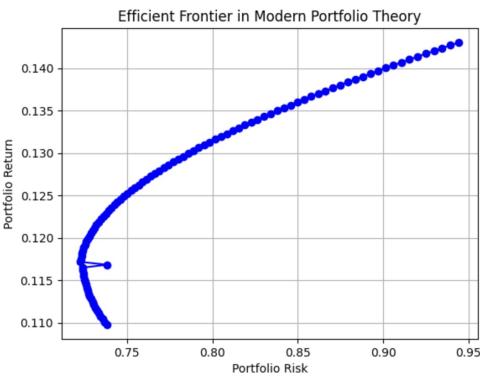
Figure 1: Efficient frontier in modern portfolio theory.
The efficient frontier shows that expectations are positively related to risk, with expectations increasing as risk increases and decreasing as risk decreases [7]. MPT constructs a theoretical framework aimed at balancing investment portfolios based on investment risk and expected rate of return, and conducts basic analysis and guidance on it.
2.2.Sharpe Ratio
Sharpe Ratio is an indicator tool used to measure the risk-return rate of an investment portfolio. It measures the return rate of the investment portfolio and the risk rate of obtaining the corresponding return rate in the form of standard deviation.
The Sharpe Ratio calculates the relationship between a portfolio's excess return (the difference between the actual return and the risk-free rate) and the portfolio's volatility, which is also the slope of the asset allocation line. The higher the value of Sharpe Ratio, the greater the excess return per unit of risk. Modern asset portfolio theory can be better applied through Sharpe Ratio. Sharpe Ratio is closely related to modern asset portfolio theory. When the asset allocation line is tangent to the efficient frontier, the maximum Sharpe Ratio is obtained. In this way, modern asset portfolio theory can be evaluated. Whether the balance between risk and return in asset theory is the optimal balance point, and evaluating the performance and risk of an asset portfolio to help investors determine how the portfolio performs at a given risk level, let investors can visually see the performance of the asset portfolio to adjust and optimize the asset portfolio [8].
2.3.CAPM Model
Capital Asset Pricing Model (CAPM) is a financial model used to evaluate portfolio returns and expected returns. It assumes that investors are rational when investing and hope to maximize portfolio returns while assuming certain risks.
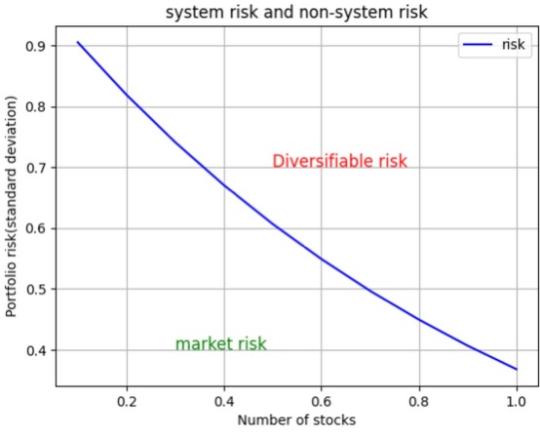
Figure 2: Systerm risk and non-system risk.
At the same time, it divides risks into systematic risks and non-systematic risks (see Figure 2). Risks that can be reduced through diversified investments are non-systematic risks, while risks that are widespread in the market and cannot be reduced through diversified investments are systemic risks. It proposes four assumptions, assuming that investors can form investment portfolios by purchasing risky assets and risk-free assets. The assumption of the market is that investors have no information gaps in the market and obtain the same information to diversify and reduce risks. Investors can also invest or borrow without limits. Based on the above assumptions, CAPM assumes that the relationship between investors' expectations and risk is a linear relationship, that is, the risk and return of capital are equivalent, and investors can appropriately choose to allocate risky assets and risk-free assets. The investment portfolio of assets can diversify and reduce unsystematic risk, leaving only systematic risk, thereby increasing the rate of return [9, 10].
3.Method
3.1.Data Collection and Screening
The data in this article comes from the CSMAR database, and the two-year data from June 2021 to June 2023 is selected for analysis. This article randomly selected four pharmaceutical companies (Fosun Pharmaceutical, Hairip, Kangli) from the pharmaceutical industry in the china’s A-share market. Monthly stock return data of ENBI and Hengrui Pharmaceuticals. These four companies are the largest in China and are mainly responsible for the research and development, production and sales of drugs. The selection of these companies can represent most pharmaceutical companies, ensuring the validity and reliability of the data.
3.2.Data Analysis
3.2.1.Calculation of Monthly Rate of Return
After the previous collection and selection of data, calculate the return rate of each stock in the second half of 2021 and the full year of 2022. Use this as historical stock data.
3.2.2.Calculate the Mean, Variance and Standard Deviation of Monthly Return
Calculate the average of the monthly returns of each asset through simple arithmetic. The formula is as follows:
\( M=\frac{\sum _{i=1}^{n}{X_{i}}}{n} \)(1)
Through the average calculation of income, people can clearly see the average income of each pharmaceutical company, and then continue to calculate the standard deviation of the monthly return based on the average. According to the modern asset portfolio theory, different groups are first used to calculate the proportion of the four groups of assets in the total investment, and the sum of the proportions of the four groups of assets is 1. According to the proportion of the three groups of assets, the rate of return on the total assets is calculated according to the proportion. The expected rate of return is obtained by adding the average return calculated above and the proportion of each group of assets. The variance and standard deviation can be brought into the calculation according to the formula.
(1)The portfolio of n assets:
\( \sum _{i=1}^{n}{w_{i}} \)(2)
(2) The return on the portfolio:
\( {r_{p}}\sum _{i=1}^{n}{w_{i}}{r_{i}} \)(3)
(3) The expected return on the portfolio:
\( {\overline{r}_{p}}=E[{r_{p}}]=\sum _{i=1}^{n}{w_{i}}{\bar{r}_{i}} \)(4)
(4) The variance of portfolio return:
\( σ_{p}^{2}=Var[{r_{p}}]=\sum _{i=1}^{n}\sum _{j=1}^{n}{w_{i}}{w_{j}}{σ_{ij}} \)(5)
(Where\( {σ_{ij}}=σ_{i}^{2} \))
(5) The volatility (STD) of portfolio return:
\( {σ_{p}}=\sqrt[]{Var[{γ_{p}}]} \)=\( \sqrt[]{σ_{p}^{2}} \)(6)
3.2.3.Calculate the Covariance of the Monthly Returns of the Four Stocks
Through the above operations, the variance, standard deviation, expected asset portfolio return and actual asset portfolio return of the asset portfolio are obtained. Then, based on the above results, calculate the monthly return covariance matrix of the four stocks.
3.2.4.Calculate Sharpe Ratio
This paper uses Sharpe's theory to conduct a preliminary examination of asset portfolios and incorporates the above data into calculations to evaluate whether the return rate and risk return of asset portfolios have reached a balance. The larger the value obtained, it means that the asset portfolio is under a certain risk. The better the return it can bring [6]. After processing the data with python and Excel, the function line composed of the maximum Sharpe Ratio obtained is the Optimal Portfolio Formation of the asset portfolio. The formula is as follows:
\( Sharpe Ratio=\frac{[E({R_{p}})-{R_{f}}]}{{σ_{p}}} \)(7)
(-Portfolio return, -Risk-free rate of return, -Standard deviation of the portfolio's returns)
Due to the lack of risk-free rate of return in the data, this article will introduce the one-year time savings deposit interest rate of 1.75% of the four major state-owned banks in 2023 as the risk-free rate of return. The average monthly time savings deposit interest rate is 0.145% [11]. When the sum of asset proportions is equal to 1, let the proportion of each stock be no less than 0. The maximum value of the Sharpe Ratio is calculated to obtain the optimal allocation line of the asset portfolio on the efficient frontier. The intersection of the optimal allocation line and the efficient frontier is the optimal asset portfolio point. After calculation, the proportion of each stock at the maximum Sharpe Ratio is obtained. Finally, the average market value of each stock from July 2021 to July 2022 is used to calculate the different proportions of each company, and these three combinations are compared with the respective returns of the four stocks and the market average return. Based on the CSI 500 2023 The monthly return rate in the first half of the year is the control group. Due to the lack of risk-free rate of return in the data, this article will introduce the one-year time savings deposit interest rate of 1.75% of the four major state-owned banks in 2023 as the risk-free rate of return. The average monthly time savings deposit interest rate is 0.145% [11]. When the sum of asset proportions is equal to 1, let the proportion of each stock be no less than 0. The maximum value of the Sharpe Ratio is calculated to obtain the optimal allocation line of the asset portfolio on the efficient frontier. The intersection of the optimal allocation line and the efficient frontier is the optimal asset portfolio point. After calculation, the proportion of each stock at the maximum Sharpe Ratio is obtained. Finally, the average market value of each stock from July 2021 to July 2022 is used to calculate the different proportions of each company, and these three combinations are compared with the respective returns of the four stocks and the market average return. Based on the CSI 500 2023, the monthly return rate in the first half of the year is the control group.
4.Results
Table 1: Monthly returns of 4 stocks.
|
Time |
2399 |
600196 |
600276 |
600572 |
|
07/21/21 |
-5.351% |
12.678% |
-22.307% |
-2.972% |
|
08/21/21 |
4.532% |
-25.737% |
-18.490% |
-3.542% |
|
09/21/21 |
-1.917% |
-19.089% |
10.552% |
0.957% |
|
10/21/21 |
-0.907% |
-4.497% |
-1.991% |
-2.899% |
|
11/21/21 |
4.082% |
11.333% |
1.871% |
2.421% |
|
12/21/22 |
6.649% |
-13.476% |
1.071% |
17.913% |
|
01/22/22 |
-9.953% |
-14.039% |
-21.377% |
-12.104% |
|
02/22/22 |
3.116% |
-0.306% |
-2.147% |
3.330% |
|
03/22/22 |
-8.218% |
22.935% |
-8.484% |
8.172% |
|
04/22/22 |
-22.382% |
-21.576% |
-22.233% |
-11.728% |
|
05/22/22 |
35.786% |
1.890% |
2.810% |
1.348% |
|
06/22/22 |
4.419% |
0.660% |
20.154% |
-1.122% |
|
07/22/22 |
-9.730% |
-0.432% |
-4.975% |
-3.445% |
|
08/22/22 |
-1.325% |
-8.408% |
-1.801% |
-4.053% |
|
09/22/22 |
-4.549% |
-31.142% |
1.261% |
-3.718% |
|
10/22/22 |
-5.536% |
11.099% |
13.567% |
5.646% |
|
11/22/22 |
-3.723% |
11.620% |
-0.925% |
12.544% |
|
12/22/22 |
-6.478% |
-5.144% |
-3.318% |
-0.422% |
Table 2: Mean and standard deviation of monthly returns.
|
2399 |
600196 |
600276 |
600572 |
|
|
mean |
-1.194% |
-3.979% |
-3.153% |
0.352% |
|
N-1 |
17 |
17 |
17 |
17 |
|
variance |
0.0134 |
0.0221 |
0.0144 |
0.0056 |
|
STD |
0.1156 |
0.1485 |
0.1200 |
0.0748 |
Table 3: Monthly return covariance matrix table.
|
2399 |
600196 |
600276 |
600572 |
|
|
2399 |
0.0134 |
0.0019 |
0.0054 |
0.0029 |
|
600196 |
0.0019 |
0.0221 |
0.0031 |
0.0049 |
|
600276 |
0.0054 |
0.0031 |
0.0144 |
0.0041 |
|
600572 |
0.0029 |
0.0049 |
0.0041 |
0.0056 |
Table 4: Market capitalization weight and equivalent weight.
|
2399 |
600196 |
600276 |
600572 |
|
|
Msmvosd |
16026541.9 |
70866162 |
245782957.6 |
12124388 |
|
Market share |
4.65% |
20.55% |
71.28% |
3.52% |
|
Equivalent proportion |
25% |
25% |
25% |
25% |
Table 1-3 shows the monthly returns to be calculated in the methodology, the mean, variance and standard deviation of each stock is calculated from the returns and finally the covariance of the four stocks is calculated based on the variance. Table 4 shows the different weights of the four stocks calculated from the market capitalization and the equivalent share.
Table 5: Maximum Sharpe Ratio weight.
|
2399 |
600196 |
600276 |
600572 |
|
|
Maximum Sharpe Ratio Weight Ratio |
-12.873% |
8.654% |
12.973% |
91.246% |
As can be seen from the calculation results in Table 5, through the Sharpe Ratio test results, at the optimal balance point of asset portfolio risk and return, the weight proportions of the four stocks are not satisfactory, and the weight proportion of Fosun Pharma (2399) is unreasonable, although the weight ratios sum to 1.
Use the data for the first six months of 2023 to calculate the monthly returns of the four stocks, and calculate the monthly returns of the three asset portfolios at the same time. Use the data of CSI 500 in the first half of 2023 as a comparison. Table 6 is as follows:
Table 6: Data of 4 stocks and their portfolio returns in the first half of 2023.
|
Time |
2399 |
600196 |
600276 |
600572 |
Market share |
Equivalent proportion |
Maximum Sharpe Ratio Combination |
CSI 500 |
|
01/23/23 |
7.237% |
-3.462% |
9.551% |
2.537% |
6.453% |
3.966% |
2.323% |
5.387% |
|
02/23/23 |
0.000% |
-0.941% |
3.056% |
8.041% |
2.249% |
2.539% |
7.652% |
0.735% |
|
03/23/23 |
0.000% |
-3.887% |
-1.563% |
13.550% |
-1.514% |
2.025% |
11.825% |
-0.206% |
|
04/23/23 |
-6.168% |
-2.130% |
13.615% |
16.303% |
9.512% |
5.405% |
17.252% |
1.540% |
|
05/23/23 |
-8.198% |
-1.640% |
-6.372% |
0.434% |
-5.278% |
-3.944% |
0.483% |
-3.572% |
|
06/23/23 |
-3.370% |
-0.898% |
5.159% |
-1.439% |
3.267% |
-0.137% |
-0.288% |
-0.078% |
Finally, the data was tested by calculating the four dimensions of return mean, standard deviation, Sharpe Ratio and total return of the four groups of asset portfolios. As shown in Table 7:
Table 7: Descriptive statistics of the four sets of data.
|
Market share |
Equivalent proportion |
Maximum Sharpe Ratio Combination |
CSI 500 |
||
|
Mean |
2.448% |
1.642% |
6.541% |
|
|
|
STD |
0.0533 |
0.0331 |
0.0700 |
0.0291 |
|
|
Sharpe Ratio |
0.4322 |
0.4519 |
0.9137 |
0.1682 |
|
|
Sum |
14.690% |
9.854% |
39.246% |
3.81% |
From Table 7, it can be seen that among the four sets of data, the one with the smallest standard deviation is the CSI 500, and among the three sets of asset portfolios, the one with the smallest standard deviation is the equivalent portfolio. From this, it can be concluded that when the four stocks have the same proportion, the higher the concentration of the data, the better the representativeness of the data, and the corresponding risk of the data is the smallest. That is to say, among these three investment portfolios, the most representative is the equal value portfolio, and the risk of the equal value portfolio is the lowest of. Assets combined according to market value ratio have the highest average return, and the highest total return in the first half of 2023 is the combination based on the maximum Sharpe Ratio. What ultimately determines the effectiveness of an asset portfolio is the Sharpe Ratio, which represents the return obtained under a certain risk. As shown in Table 6, it can be seen that the maximum Sharpe Ratio portfolio has the highest Sharpe Ratio. Under the same risk, the maximum The Sharpe Ratio portfolio can achieve the largest return, which is enough to prove the effectiveness of the maximum Sharpe Ratio portfolio strategy. From the perspective of overall return rate, the return rate of the three asset portfolios is higher than that of the CSI 500, which also shows that an appropriate asset portfolio can increase the return rate under the same risk.
5.Conclusion
Modern asset portfolio theory uses mathematical models to optimize asset allocation combinations, thereby allocating effective combinations and using the Sharpe Ratio to test the effectiveness. The overall rate of return can be improved through different proportions of asset allocation, and modern asset portfolio theory optimizing and perfecting the portfolio can lead to better investment results. The return obtained by a modern asset portfolio is the weighted average of the portfolio. Diversifying the investment portfolio can only reduce non-systematic risk, but systematic risk cannot be avoided. Portfolio return is positively related to risk. The risk of a portfolio is determined by the covariance, and the risk of each asset in the asset is determined by the variance. There are several conditions for the establishment of modern asset portfolio theory: First, it defaults to the fact that there is no information gap in the market, investors can obtain the same information at the same time, and investors are rational when investing. At the same time, the theory holds that investors think there is a positive relationship between risk and return, and investors make investment strategies based on risk and return when making decisions. The above situation does not exist in the normal market, which also leads to the unreasonable combination ratio of the maximum Sharpe Ratio in this article. At the same time, the data collected in this paper is not enough, the time is not enough, and the results can not fully prove the effectiveness of the theory. The test of the data is not rigorous, and only the variance, mean and Sharpe Ratio are used for verification. During verification, the CAPM model can be used to further test the obtained results, and the corresponding P value and T test value can be calculated for significance testing for further explanation.
References
[1]. Zeng Y.H., Guo M. (2022) Discussion on the Pros and Cons of Modern Asset Portfolio Selection Based on Case Analysis. Journal of Hubei University of Economics (Humanities and Social Sciences Edition), 19, 36-39.
[2]. Sun J.J. (2021) Research on Performance Comparison and Optimization of Four Intelligent Investment Advisory Portfolios. Nanjing Normal University.
[3]. Yang C.Y. (2022) Portfolio Optimization and Empirical Research Based on Deep Reinforcement Learning Method. Sichuan: Southwestern University of Finance and Economics.
[4]. Deng W.S. (2021) Opportunities, Challenges and Innovations of Bank Financial Management in the Wealth Dividend Era. Financial Accounting, 1, 13-22.
[5]. Chen H.M., Yu B., Zhou A. (2021) Experimental Design and R Software Application of Modern Asset Portfolio Theory. Journal of Heihe University, 12, 111-114.
[6]. Liu G.Q. (2022) Research on Investment Portfolio Optimization Strategy of Fund Sales Companies. Shandong University of Finance and Economics.
[7]. Xu S. (2019) Research on the Optimal Model of Investment Portfolio of Insurance Companies. Times Economics and Trade, 27, 49-50.
[8]. Zhou Y.Q., Wu D., Huang L., etc. (2019) Research on the Innovation and Application of Modern Asset Portfolio Theory in the Chinese Market. Financial Education Research, 32, 34-39.
[9]. Fan D.N. (2022) Empirical Research on Optimal Selection of Asset Portfolio and Market Portfolio Based on CAPM Model. Investment and Entrepreneurship, 33, 11-13.
[10]. Yao X.J. (2010) Review of Modern Asset Portfolio Theory Based on Index Model. Journal of Xi'an Petroleum University (Social Science Edition), 19, 38-42.
[11]. Li W. (2020) Research on the Effectiveness of Modern Asset Portfolio Theory in China's A-share Market. Times Finance, 31, 64-66+73.
Cite this article
Zhao,J. (2023). Empirical Research on Optimizing Company Investment Strategy Based on Asset Portfolio Strategy -Taking the Pharmaceutical Industry as an Example. Advances in Economics, Management and Political Sciences,62,145-153.
Data availability
The datasets used and/or analyzed during the current study will be available from the authors upon reasonable request.
Disclaimer/Publisher's Note
The statements, opinions and data contained in all publications are solely those of the individual author(s) and contributor(s) and not of EWA Publishing and/or the editor(s). EWA Publishing and/or the editor(s) disclaim responsibility for any injury to people or property resulting from any ideas, methods, instructions or products referred to in the content.
About volume
Volume title: Proceedings of the 2nd International Conference on Financial Technology and Business Analysis
© 2024 by the author(s). Licensee EWA Publishing, Oxford, UK. This article is an open access article distributed under the terms and
conditions of the Creative Commons Attribution (CC BY) license. Authors who
publish this series agree to the following terms:
1. Authors retain copyright and grant the series right of first publication with the work simultaneously licensed under a Creative Commons
Attribution License that allows others to share the work with an acknowledgment of the work's authorship and initial publication in this
series.
2. Authors are able to enter into separate, additional contractual arrangements for the non-exclusive distribution of the series's published
version of the work (e.g., post it to an institutional repository or publish it in a book), with an acknowledgment of its initial
publication in this series.
3. Authors are permitted and encouraged to post their work online (e.g., in institutional repositories or on their website) prior to and
during the submission process, as it can lead to productive exchanges, as well as earlier and greater citation of published work (See
Open access policy for details).
References
[1]. Zeng Y.H., Guo M. (2022) Discussion on the Pros and Cons of Modern Asset Portfolio Selection Based on Case Analysis. Journal of Hubei University of Economics (Humanities and Social Sciences Edition), 19, 36-39.
[2]. Sun J.J. (2021) Research on Performance Comparison and Optimization of Four Intelligent Investment Advisory Portfolios. Nanjing Normal University.
[3]. Yang C.Y. (2022) Portfolio Optimization and Empirical Research Based on Deep Reinforcement Learning Method. Sichuan: Southwestern University of Finance and Economics.
[4]. Deng W.S. (2021) Opportunities, Challenges and Innovations of Bank Financial Management in the Wealth Dividend Era. Financial Accounting, 1, 13-22.
[5]. Chen H.M., Yu B., Zhou A. (2021) Experimental Design and R Software Application of Modern Asset Portfolio Theory. Journal of Heihe University, 12, 111-114.
[6]. Liu G.Q. (2022) Research on Investment Portfolio Optimization Strategy of Fund Sales Companies. Shandong University of Finance and Economics.
[7]. Xu S. (2019) Research on the Optimal Model of Investment Portfolio of Insurance Companies. Times Economics and Trade, 27, 49-50.
[8]. Zhou Y.Q., Wu D., Huang L., etc. (2019) Research on the Innovation and Application of Modern Asset Portfolio Theory in the Chinese Market. Financial Education Research, 32, 34-39.
[9]. Fan D.N. (2022) Empirical Research on Optimal Selection of Asset Portfolio and Market Portfolio Based on CAPM Model. Investment and Entrepreneurship, 33, 11-13.
[10]. Yao X.J. (2010) Review of Modern Asset Portfolio Theory Based on Index Model. Journal of Xi'an Petroleum University (Social Science Edition), 19, 38-42.
[11]. Li W. (2020) Research on the Effectiveness of Modern Asset Portfolio Theory in China's A-share Market. Times Finance, 31, 64-66+73.