


1. Introduction
As one of the most essential components in automobiles and power plants, the performance of different engines is crucial. As a traditional power unit, the internal combustion engine (ICE) has significantly changed people’s lives over the past 200 years. Because of the pollution caused by conventional fossil fuels, people must invent new engines capable of cleaner energy sources. In recent years, electric vehicles (EVs) have gradually entered people’s vision, leading to a hybrid of electric and traditional power engines. In addition, plug-and-play and fuel cell engines are available as newer engines.
Spark Ignition (SI) and Compression Ignition (CI) engines are the mainstream of conventional ICEs. The core operating principle of a conventional ICE is to ignite the mixture of air and fuel in the cylinder, and the chemical energy in the fuel is converted into kinetic energy to propel the piston to do work. The main difference is that a SI engine uses a spark plug to ignite the fuel and generate combustion in the cylinder to do work, and a CI engine injects fuel to initiate this process. SI engines are usually cheaper, lighter, and quieter, while CI engines have a higher fuel efficiency.
EVs, or battery-powered electric vehicles (BEVs), are among the most effective ways to reduce pollutant emissions during transportation. Even considering the whole life cycle, including raw material production and manufacturing, EVs have less pollution than internal combustion engine vehicles (ICEVs) [1]. However, EVs still need improvement in terms of range. The concept of hybrid electric vehicles (HEVs) was proposed to extend the driving range of EVs. This type of engine combines an electric motor and an ICE. The electric motor can provide extra power, allowing the vehicle to have smaller ICE. Plug-in hybrid electric vehicles (PHEVs) are the extension of HEVs. This vehicle uses an ICE to power the electric motor, reducing gasoline use and getting a more extended driving range than HEVs.
As a new concept used in automobiles, the fuel cell generates electricity through chemical reactions of hydrogen fuel. Fuel cell electric vehicles (FCEVs) usually do not require additional ICEs to improve range. The fuel cell has relatively high efficiency and low pollution compared to ICE-based power sources. However, the fuel cells cannot appropriately respond to sudden changes in vehicle load demand, hindering practical applications [2].
2. Efficiency and Cost
2.1. Well-To-Wheel (WTW) Efficiency
The well-to-pump and tank-to-wheel efficiencies are the main factors of the total WTW efficiency. The well-to-pump efficiencies for gasoline and diesel fuels are about the same, with 82% for gasoline fuel and 88% for diesel fuel (Figure 1). CI engines are always considered the most efficient engine in traditional ICEs. The CI engines have a much higher tank-to-wheel efficiency than the SI engines. The product of these two efficiencies is the overall WTW efficiency, in which the highest total WTW efficiency of gasoline ICEVs can reach 27%, and diesel ICEVs can reach up to 37% [3].
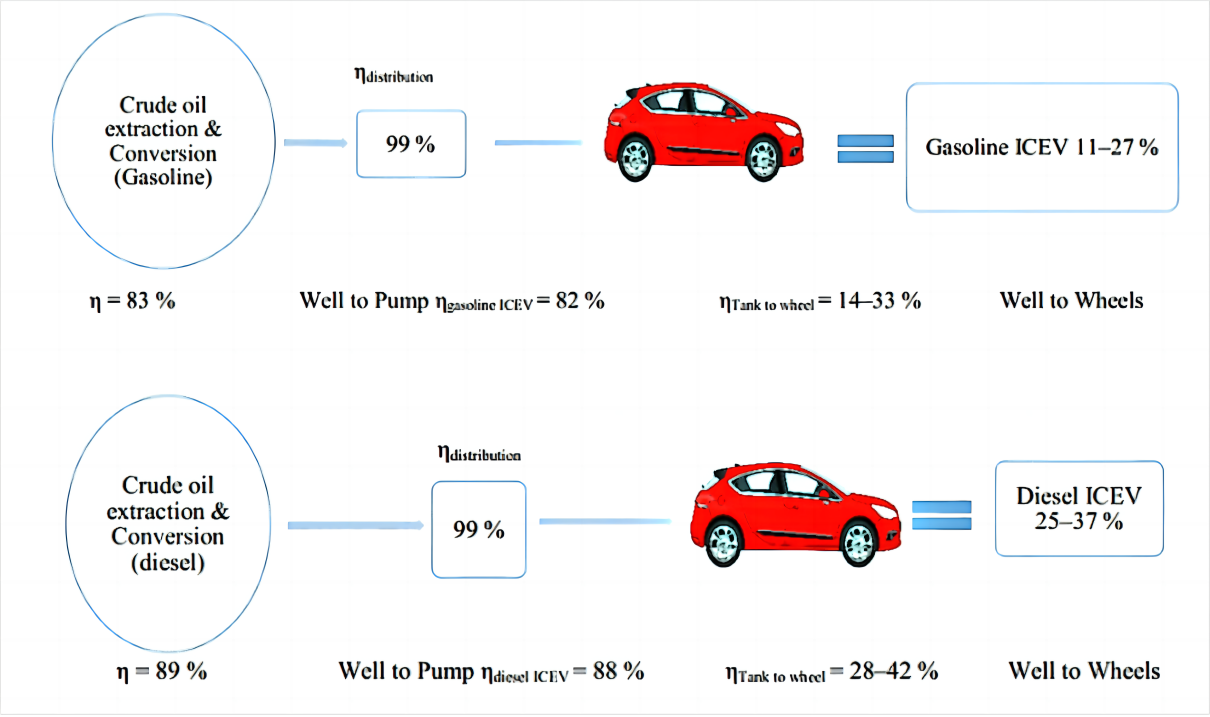
Figure 1: WTW efficiency of SI and CI vehicles [3].
EVs use electricity as their primary energy source, and power plants’ efficiency depends on the fuel type and technology used. The electricity is transmitted through the distribution grid and charging stations and reaches the electric vehicle. During this process, the power plant’s generation efficiency directly determines the EVs’ WTW efficiency. Generating electricity using natural gas has the highest power plant efficiency, forming the highest WTW efficiency, which ranges from 13% to 31% (Figure 2). The EVs supplied by coal-fired and diesel power plants have lower total WTW efficiencies, with top WTW efficiencies of 27% and 25%, respectively, as they have lower power plant efficiencies. It is interesting to notice that the lower limits of the efficiency range are very close. Some energy will also lose during the charging of the EVs [3].
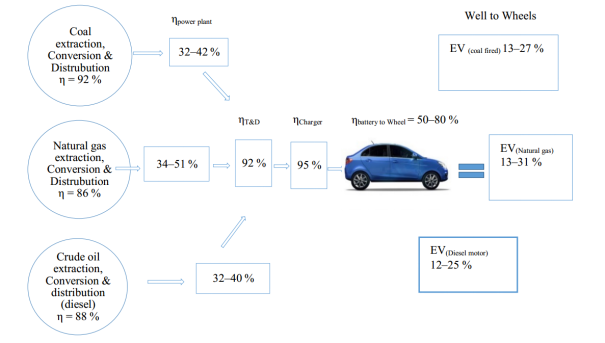
Figure 2: WTW efficiency of EVs powered by electricity generated by fossil fuels [3].
To improve the WTW efficiency of EVs, photovoltaic (PV) or wind farms can be used for electricity generation instead of fossil fuels. The overall WTW efficiency of EVs charged from PV or wind farms can reach up to 67%, with a minimum efficiency of 39%, which is still higher than the WTW efficiency using other technologies (Figure 3). The overall WTW efficiency for EVs combined with a PV roof system is the highest among all technologies, which ranges from 42% to 72% [3].
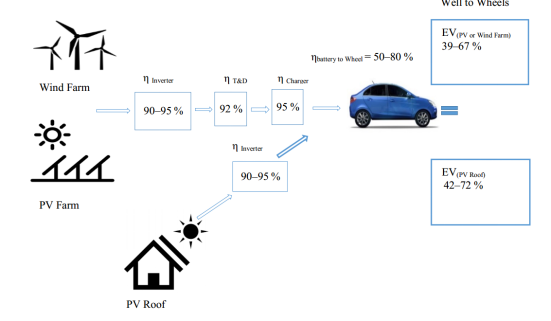
Figure 3: WTW efficiency of EVs powered by electricity generated by renewable energies [3].
The WTW efficiency of FCEVs is mainly determined by the hydrogen production method (Figure 4). Using natural gas for hydrogen production results in the highest overall WTW efficiency of about 38%, outperforming most conventional ICEVs and EVs that use electricity generated from fossil fuels. However, hydrogen production using coal or electrolyzed water failed to achieve high WTW efficiencies, about 24% and 16%, respectively, not as good as traditional ICEVs [4].
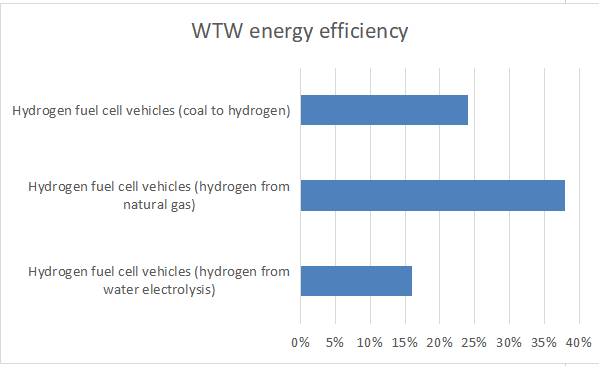
Figure 4: WTW efficiency for FCEVs [4].
2.2. Fuel Efficiency
Fuel efficiency, also known as fuel economy, refers to the measurement of the efficiency of a vehicle using fuel over a certain distance. The ratio of distance traveled to the amount of fuel consumed is usually the expression of fuel efficiency. Higher fuel efficiency means vehicles can travel longer distances with less fuel, indicating higher energy efficiency.
The driving distance of vehicles is related to the performance of the fuel efficiency of the engines, and miles per gallon (MPG) is one of the measures of fuel efficiency. In Maine, the proportion of vehicles with lower fuel efficiency (15 MPG or lower) is higher in rural areas at about 10.3% (Table 1). For urban areas, the proportion is only 4.6%. On the other hand, EVs and HEVs with higher fuel efficiency (40 MPG or higher) have higher ratios in urban areas at 2.2% against 1.3% in rural areas [5]. The average service life of rural vehicles is about two years, which supports the policy goal of increasing the proportion of newer and more fuel-efficient vehicles to reduce traffic carbon dioxide emissions.
Table 1: Fuel efficiency: high and low MPG vehicle counts and percentages in Maine [5].
Municipal Type | Avg MPG | Below 15 MPG (%) | Over 40 MPG (%) |
Rural | 21.3 | 10.3% | 1.3% |
Town | 22.7 | 6.2% | 2.1% |
Urban | 23.4 | 4.6% | 2.2% |
Maine | 22.2 | 7.1% | 1.5% |
Due to the high energy density of diesel, which is more than 10% higher than gasoline, the fuel efficiency of CI engines is often higher. At the same time, since CNG is characterized by low pumping losses, high resistance to detonation, and good idle stability, using new CNG fuels instead of traditional fuels can significantly reduce CO2 emissions and improve fuel efficiency [6].
2.3. Original Cost
The original price of EVs is much higher than traditional ICEVs of standard models (Table 2) [7]. The costs of electric motors are higher than traditional ICEs, since their higher investment costs, especially for fuel cells. A fuel cell with a gasoline onboard reformer can cost about 150% of an ICE [8].
Table 2. The price list of different versions of common models on the market [7].
Manufacturer | Model | Year | Type | Price (USD) |
KIA | Niro EV | 2020 | EV | 38500 |
Niro | 2020 | ICEV | 24590 | |
Volkswagen | ID.3 | 2020 | EV | 37321 |
Golf | 2020 | ICEV | 23195 | |
Nissan | Leaf Hatchback | 2020 | EV | 31600 |
Centra | 2020 | ICEV | 19090 | |
Chevrolet | Bolt | 2020 | EV | 37495 |
Spark | 2020 | ICEV | 18595 | |
Hyundai | IONIQ | 2020 | PHEV | 35763 |
I30 | 2020 | ICEV | 26605 |
2.4. Upkeep Cost
According to Anderson Economic Group (AEG), a consulting firm specializing in market and industry analysis, the final quarter of 2022 saw EV charging costs outpace the price to fuel comparable ICEVs per 100 miles of driving to the tune of an additional $0.31 for on-site/home charging and $3.00 to charge at fueling stations.
For daily operating costs, EVs only need to maintain the brakes. At the same time, traditional ICEVs require a range of consumption, including oil and automatic transmission fluid changes and maintenance of spark plugs and wires (Table 3). These extra costs make ICEVs typically have a higher upkeep cost [7]. Due to the high maintenance costs of ICEVs, the total cost can exceed that of EVs within five years, especially for EVs with shorter driving ranges. Notably, an EV with a driving range under 200 miles can bring the total cost of ownership below that of an equivalent ICEV in eight years or less [9].
Table 3: The everyday cost of electric and conventional vehicles [7].
Property | EVs Cost (USD) | ICEVs Cost (USD) |
Oil change | 0 | 600 |
Automatic transmission fluid | 0 | 70 |
Table 4: (continued).
Sparks, plugs and wires | 0 | 200 |
Muffler replacement | 0 | 150 |
Brakes maintenance | 200 | 400 |
Timing belt and water pump | 0 | 1000 |
Total | 200 | 2420 |
3. Emissions and Sustainability
3.1. WTW Emissions
The comparison between traditional engines and emerging alternatives necessitates a comprehensive assessment of their environmental impact. One crucial aspect to consider is the WTW emissions. Traditional engines, such as ICEs, heavily rely on fossil fuels and exhibit significant emissions throughout their entire lifecycle, from the extraction and production of fuels to their combustion in the engine. On the other hand, emerging alternatives like EVs or FCEVs often have lower well-to-wheel emissions due to using cleaner energy sources. The annual CO2 emission for a single gasoline vehicle can exceed ten kilopounds, while a typical HEV only produces around six kilopounds of CO2 emissions each year (Figure 5). For PHEVs and EVs, their CO2 emissions are even lower [10].
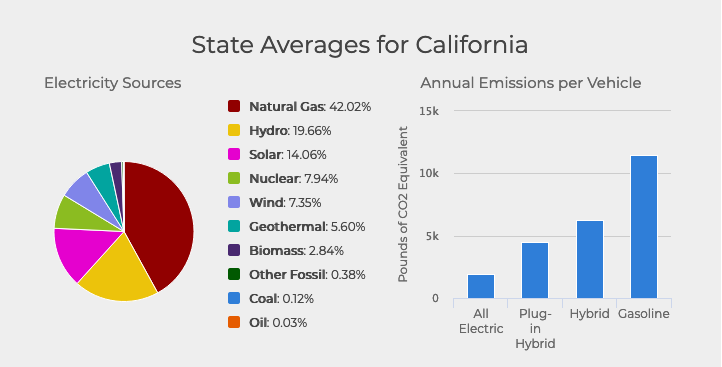
Figure 5: Energy sources and average annual emission for each vehicle in California [10].
3.2. Fuel Emissions
The fuel emissions for different engines are another crucial aspect of total emissions. Traditional ICEs mainly rely on fossil fuels and release pollutants such as CO2, NO, and particulate matter during their combustion stroke. These emissions have led to air pollution and climate change. In contrast, emerging alternatives such as EVs rely on electricity for operation, with zero exhaust emissions, while FCEVs only emit water vapor. By minimizing or eliminating fuel emissions to the greatest extent possible, these alternatives provide a promising solution for reducing the environmental damage caused by traditional engines. In Europe Unions, cars with traditional ICEs produce about 80% more CO2 emissions than EVs [11].
3.3. Sustainability
Sustainability also plays a crucial role in comparing traditional engines with emerging alternatives. The sustainability of transportation systems includes multiple aspects, including resource availability, energy efficiency, and waste management. Traditional engines rely on limited fossil fuel resources, which will face depletion over time and are associated with harmful mining practices. In contrast, emerging alternatives utilizing renewable energy sources such as solar or wind provide more sustainable solutions in terms of resource availability. In addition, emerging alternatives often have higher energy efficiency because they convert more energy into practical work and reduce overall energy waste. After traveling for 150,000 kilometers, EVs have 65% less environmental impact than conventional ICEVs, while after 300,000 kilometers, this ratio can rise to more than 80% [12].
4. Market Share
The market share of EVs has been growing constantly over the past decade (Figure 6). Especially after 2020, EV sales are snowballing. In 2012, the total sales of EVs worldwide were about 120 thousand, only 0.2% of all vehicles sold. In 2022, the total sales of EVs exceeded 10 million units worldwide, accounting for 14% of global sales. Of these, nearly three-quarters were BEVs. China, European Union, and the USA are the largest vehicle markets in the world, with China accounting for 29% of the local market with 5.9 million electric vehicle sales in 2022. The European Union and the United States sold 1.98 million and 0.99 million, respectively, accounting for 21% and 7.7% of the local market [13].
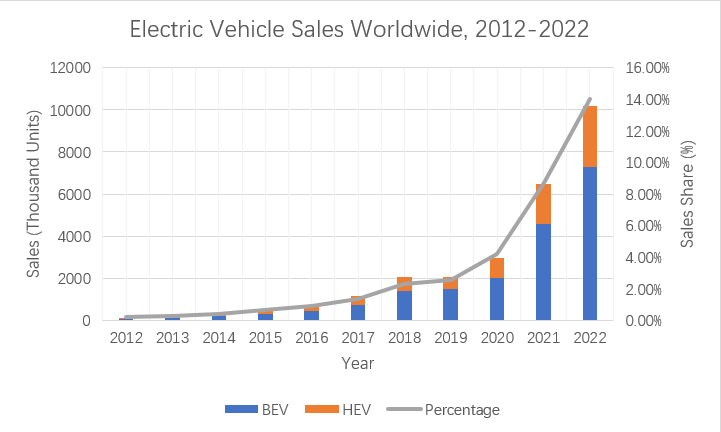
Figure 6: EV sales worldwide, 2012-2022 [13].
5. Conclusion
This article compared conventional SI and CI engines with emerging alternatives, including EVs, HEVs, FCEVs, and PHEVs, regarding efficiency, cost, emission, sustainability, and market share. Although these alternative engine vehicles have some limitations, such as higher original prices, limited range, and longer charging times, the new energy vehicles will perform better with technological development. In general, ICEVs have low efficiencies, both WTW and fuel efficiencies. The petroleum SI engine especially has very low tank-to-wheel efficiency, giving a total WTW efficiency of only 11-27%. Since EVs all have high battery-to-wheel efficiencies, the main difference in WTW efficiencies stems from the different electricity generation methods. Using PV or wind farms to generate electricity allows EVs to achieve the highest WTW efficiency. Often, one can buy an ICEV for less money. However, ICEVs usually require maintenance, such as oil and automatic transmission fluid changes and maintenance of spark plugs and wires, while EVs only require maintenance of the brake system. These additional expenses make the total cost of using ICEVs quickly exceed that of EVs.
Furthermore, the environmental impact of engines is also one of the criteria used to compare traditional engines with emerging alternatives. Conventional ICEs rely primarily on fossil fuels, which release pollutants such as CO2, NO, and particulate matter during combustion. This results in very high total WTW emissions from conventional ICEVs. On the other hand, EVs have virtually no fuel emissions, giving them extremely low WTW emissions, with even HEVs having about half the WTW emissions of conventional ICEVs.
Due to the benefits of EVs, they are gradually replacing ICEVs, and the growing market bears this out. EV sales have been increasing rapidly during the last decade. By 2022, the global sales share of EVs has already reached 14%. In China, the sales share of the local market has already close to 30%. However, EVs still need more development. Currently, EVs only have a customer base in some major cities worldwide. The need for supporting facilities such as charging ports makes most EVs unsuitable for smaller cities and rural areas. Also, because EVs still need time to develop and gain acceptance, research into new style ICEs should continue, as cleaner, more efficient engines (such as HCCI engines) are already available for residential use, which can reduce global vehicle emissions more quickly.
Author contribution
All the authors contributed equally, and their names were listed in alphabetical order.
References
[1]. Farhad F and Jung S 2023 Elsevier BV 390 136111
[2]. Hassan F 2018 Energy Conversion and Management 156 192
[3]. Albatayneh A, Assaf M, Alterman D and Jaradat M 2020 Environmental and Climate Technologies 24 669
[4]. Zhou S, Jiang Y, Chen Y and Huang C 2010 Journal of Transport Science and Engineering 26 65
[5]. Rubin J, Ballingall K, Brown E 2021 Maine Transportation & Equity (Orono: The University of Maine) 19
[6]. Han P, Zhang X, Zheng M and Tjong J 2023 Energy 263 125769
[7]. Research Gate. Maintenance cost comparison. August, 2020. Retrieved on July 10, 2023. Retrieved from: www.researchgate.net/figure/Maintenance-cost-comparison_tbl2_343402567
[8]. Mizsey P and Esmond N 2001 Elsevier BV 102 205
[9]. Liu Z, Song J, Kubal J, Susarla N, Knehr K, Islam E, Walters G and Ahmed S 2021 Energy Policy 158 112564
[10]. Binder D. Why Electric Vehicles Sometimes Have Higher Lifecycle CO2 Emissions than Gas-Electric Hybrids. November 14, 2021. Retrieved on July 14, 2023. Retrieved from: https://www.exploringtheproblemspace.com/new-blog/2021/11/14/a5l4qtqwgg5k5wetbn4143qclbewpi
[11]. Transport & Environment. Does an electric vehicle emit less than a petrol or diesel? April 21, 2020. Retrieved on July 14, 2023. Retrieved from: https://www.transportenvironment.org/discover/does-electric-vehicle-emit-less-petrol-or-diesel/
[12]. Parise M. Are Electric Vehicles Better for the Environment than Gas-Powered Ones? November 28, 2016. Retrieved on July 14, 2023. Retrieved from: https://www.danatm4.com/blog/electric-vehicles-better-environment-gas-powered-ones/
[13]. IEA. Global EV Data Explorer. April 26, 2023. Retrieved on July 9, 2023. Retrieved from: www.iea.org/data-and-statistics/data-tools/global-ev-data-explorer?gclid=EAIaIQobChMIvpK0tp6AgAMVNvbjBx0TrwCbEAAYAiAAEgIKR_D_BwE
Cite this article
Gu,C.S.J.;Xu,M.;Tan,X.;Zhao,Y. (2024). Comprehensive Comparison of Traditional Engines and Emerging Alternatives. Advances in Economics, Management and Political Sciences,72,6-13.
Data availability
The datasets used and/or analyzed during the current study will be available from the authors upon reasonable request.
Disclaimer/Publisher's Note
The statements, opinions and data contained in all publications are solely those of the individual author(s) and contributor(s) and not of EWA Publishing and/or the editor(s). EWA Publishing and/or the editor(s) disclaim responsibility for any injury to people or property resulting from any ideas, methods, instructions or products referred to in the content.
About volume
Volume title: Proceedings of the 2nd International Conference on Management Research and Economic Development
© 2024 by the author(s). Licensee EWA Publishing, Oxford, UK. This article is an open access article distributed under the terms and
conditions of the Creative Commons Attribution (CC BY) license. Authors who
publish this series agree to the following terms:
1. Authors retain copyright and grant the series right of first publication with the work simultaneously licensed under a Creative Commons
Attribution License that allows others to share the work with an acknowledgment of the work's authorship and initial publication in this
series.
2. Authors are able to enter into separate, additional contractual arrangements for the non-exclusive distribution of the series's published
version of the work (e.g., post it to an institutional repository or publish it in a book), with an acknowledgment of its initial
publication in this series.
3. Authors are permitted and encouraged to post their work online (e.g., in institutional repositories or on their website) prior to and
during the submission process, as it can lead to productive exchanges, as well as earlier and greater citation of published work (See
Open access policy for details).
References
[1]. Farhad F and Jung S 2023 Elsevier BV 390 136111
[2]. Hassan F 2018 Energy Conversion and Management 156 192
[3]. Albatayneh A, Assaf M, Alterman D and Jaradat M 2020 Environmental and Climate Technologies 24 669
[4]. Zhou S, Jiang Y, Chen Y and Huang C 2010 Journal of Transport Science and Engineering 26 65
[5]. Rubin J, Ballingall K, Brown E 2021 Maine Transportation & Equity (Orono: The University of Maine) 19
[6]. Han P, Zhang X, Zheng M and Tjong J 2023 Energy 263 125769
[7]. Research Gate. Maintenance cost comparison. August, 2020. Retrieved on July 10, 2023. Retrieved from: www.researchgate.net/figure/Maintenance-cost-comparison_tbl2_343402567
[8]. Mizsey P and Esmond N 2001 Elsevier BV 102 205
[9]. Liu Z, Song J, Kubal J, Susarla N, Knehr K, Islam E, Walters G and Ahmed S 2021 Energy Policy 158 112564
[10]. Binder D. Why Electric Vehicles Sometimes Have Higher Lifecycle CO2 Emissions than Gas-Electric Hybrids. November 14, 2021. Retrieved on July 14, 2023. Retrieved from: https://www.exploringtheproblemspace.com/new-blog/2021/11/14/a5l4qtqwgg5k5wetbn4143qclbewpi
[11]. Transport & Environment. Does an electric vehicle emit less than a petrol or diesel? April 21, 2020. Retrieved on July 14, 2023. Retrieved from: https://www.transportenvironment.org/discover/does-electric-vehicle-emit-less-petrol-or-diesel/
[12]. Parise M. Are Electric Vehicles Better for the Environment than Gas-Powered Ones? November 28, 2016. Retrieved on July 14, 2023. Retrieved from: https://www.danatm4.com/blog/electric-vehicles-better-environment-gas-powered-ones/
[13]. IEA. Global EV Data Explorer. April 26, 2023. Retrieved on July 9, 2023. Retrieved from: www.iea.org/data-and-statistics/data-tools/global-ev-data-explorer?gclid=EAIaIQobChMIvpK0tp6AgAMVNvbjBx0TrwCbEAAYAiAAEgIKR_D_BwE