


1. Introduction
Since 2019, the COVID-19 pandemic changed people’s life. Many activities normally carried out in person have changed to online in order to avoid intimate contact between people to avoid spread of virus. Online learning is one of the activities most impacted by the pandemic. The traditional way of school education was prohibited during the pandemic, and students and teachers changed their form of learning to online. More than 181 countries were affected by the epidemic and were forced to suspend their studies [1]. Except for Africa, the vast majority of regions adopted online teaching methods. The same goes for top universities. They also need to be familiar with this new environment online to provide the best education to their students [2].
As mentioned in the previous paragraph many daily activities are influenced by covid 19 pandemic, not only the form of education transforms to online, but the way people communicate with each other is also affected. Therefore, social media is considered an important space for people to communicate online during the pandemic. Nowadays, social media is defined as an internet-based channel that allows users to opportunistically express themselves in real-time or asynchronously with a wide and narrow audience, and gain value from user-generated content and perceived interactions with others [3]. As scholars have pointed out, social media platforms are often treated as a vast field of community gatherings, and social media is not composed of a series of complex and interconnected communities, which are composed of individuals with specific needs, motivations, and expectations [4]. As mentioned above, we can infer a large number of words that related to emotion are posted on social media.
During the 2019-2022 period when the world is affected by the pandemic, it has greatly affected people's learning methods and communication methods. People began to use social media more frequently, and online learning has become a mainstream learning style during the pandemic. In this regard, we want to study the reason behind people's attitude changes towards online learning during and after the pandemic. To find the answer to this question, we use the database of people's public posts on Twitter with the theme of "online learning" during 2020-4-29 and 2021-12-31. Furthermore, we will analyze, organize and mine the tweets of Twitter users under the theme of online learning during the pandemic and conduct sentiment analysis to test whether people's attitudes towards online learning during the epidemic have changed.
2. Literature Review
2.1. Emotion Change during the Pandemic
Studies have shown that people’s emotions can change significantly when dramatic changes happen in their daily lives such as the Covid-19 pandemic and those emotional changes could be triggered by restricted movements and social interactions [5]. For example, Canet-Juric, et al. [6] suggested that quarantine during the pandemic cause separations, financial difficulties would bring people negative feelings of uncertainty and boredom. They also found that people report higher depression and anxiety levels and lower enthusiasm and interest after experiencing 2-week quarantine. Moreover, when the duration of quarantine is prolonged, it would result in feelings of confusion and anger [7]. Gallant et al. [8] also showed that elder people’s attitudes towards vaccinations have been changed significantly across the pandemic in the UK. In one-year period, their complacency, mistrust of vaccines and concerns decreased while their sense of responsibility to take vaccines and worries about the future effects increased. Therefore, people’s emotions/attitudes in general or towards certain issues can be changed during the covid-19 pandemic overtime. Online learning as an outstanding form of learning that becomes more popularized during the pandemic, and it is reasonable to deduce that people’s emotion/attitudes towards it would change. This deduction is not only supported by the above examples of quarantine and vaccines, but also the a few longitudinal studies that show the increasing positivity towards online-learning [9].
2.2. Social Media Flatforms and Sentiment Analysis
Social media is defined as an internet-based channel that allows users to opportunistically express themselves in real-time or asynchronously with a wide and narrow audience, and gain value from user-generated content and perceived interactions with others [3]. During the covid-19 pandemic, messages, comments, updates and posts have been spread explosively on social platforms such as Twitter [10], which makes them important sources of information [11]. Emotion is regarded as an expression of people’s subjective feelings and thoughts. Sentiment analysis is also known as opinion mining, which focuses on emotions, subjective texts attitudes, opinions and appraisal [12]. Emotions are closely linked to sentiments in which the intensity of emotions influence how strong the opinions/sentiments are [12]. Therefore, sentiment analysis is frequently used to interpret Twitter users’ emotions/attitudes towards an issue by extracting their emotions from their texts, where people mostly profess their emotions through [13]. The explosive expressions of attitudes/emotions towards covid-19 pandemics on social media have become valuable social data, which provides researchers good opportunities to conduct sentiments analysis, to examine how people perceive or react to issues during pandemic [14,15].
2.3. Sentiment Analysis in Different Domains
Sentiment analysis have been applied in various domains in recent years, which includes environment, politics, technology and industry. For examples, Asur & Huberman [16] used a combination of tweet sentiment and volume to conclude the attentions to a certain topic to forecast box offices revenue for movies industry; For political application, Bermingham & Smeaton [17] used tweet volume together with positive and negative tweets to predict the election result. Sentiment analysis is frequently used in stock market, for example, sentiment analysis was used to find out the positive and negative public moods towards the stock market to make predictions about different stock market industries [18]. Apart from the domains mentioned above, sentiment analysis is also used in analyzing people’s emotions/attitudes towards online learning during the covid-19 pandemic. For example, Sahir et al. [19] used sentiment analysis to conclude the public opinions towards online-learning during covid-19 under the debate of preparation of technology in Indonesia. The results showed that negative sentiments dominant the public attitude towards online learning, which could provide related education departments with advisory information when implementing online learning. Hence, sentiment analysis is useful in various domains in terms of finding and monitoring opinions on different media and distilling that information, which provides more applicable information to assist decisions making [18].
2.4. The Current Study
Online learning refers to individuals receiving education online and having all access to materials through the computer. Similar words such as distance learning, E-learning, and computer-based training are all one form of online learning [20]. Since the explosion of covid-19 pandemic, over 181 countries have been affected and the switch from traditional ways of learning to online learning has affected 88% of the students [1]. While some students acknowledge the advantages of online such as no restrictions on locations and time and express their positive attitudes [21], some express their negative attitudes by emphasizing the negative effects such as technical issues and discouragement of socialization [22]. The prevalence of online learning during the covid-19 pandemic has placed itself to central debate. As a topic that has been widely discussed on social media platform during the pandemic, a rich data pool with different posts and texts towards this topic has been established. According to the previous discussions, it is reasonable to deduce that researchers could use sentiment analysis to extract people’s emotions/attitudes towards it from social media platforms such as Twitter. Additionally, as discussed at the beginning, people’s emotions/attitudes could change overtime during the pandemic, no matter it is the overall mental state or attitudes towards a certain issue. Therefore, although there are some studies investigating the emotions/attitudes towards online learning during this period, many of them have limited time span, which is hard to find out the changes across time [19, 23]. Hence, the currently study aims to conduct a 20-months longitudinal study with 3 time slots to examine whether there are any changes. The time slots chosen to grab the data are approximately where the confirmed cases and death rates at their first peaks, first troughs, and starts of their second peaks in the USA. The choice of time slots is sensitive as evidence shows that people’s negative emotions including fear and anxiety, can be triggered rapidly when they witness the increase in confirmed cases during the pandemic [24]. People also tended to be distressed when they witnessed that the death rate increased during the pandemic [25]. However, there are currently few evidence showing that how emotion at different stages of the pandemic would impact their emotions towards online learning in specific, which is the one of the gaps that the current study aims to fill.
3. Method
3.1. Study Design
This research using texts posted on twitter under the topic of "online learning" from 2020-4-29 to 2021-12-31 as qualitative data. Fig 1 and Fig 2 is shows the changing of infection and death rate in United States from 3 Jan 2020 to 9 August 2023. For an interactive version of data, click on this link: https://covid19.who.int/region/amro/country/us[26]
Machine driven classification of open-ended responses (MDCOR) and sentiment analysis are used in this research to analysis short text data from twitter users. The longitudinal data gathered from 2020-4-29 to 2021-12-31 were split into 3 waves based on the infection rate and death rate data of United States due to COVID-19. The first wave of data collection was placed on April 29th 2020 to January 11th 2021, which is from the first day this research to collect data during pandemic until the first peak of both the infection and death rate of COVID-19 in United States. The second wave of data collection was placed on January 12th 2021 to June 14th 2021, which is the downward infection and death trending start and reach the trough. The third wave of data collection was placed on June 15th 2021 to December 31st, which is the upward trending start of infection and death rate until the second peak. (United States of America: Who coronavirus disease (covid-19) dashboard with vaccination data). This research is using United States' covid-19 infection and death rate to divide the data into wave because most of users on twitter are from United states, especially under post on this topic is English based [27].
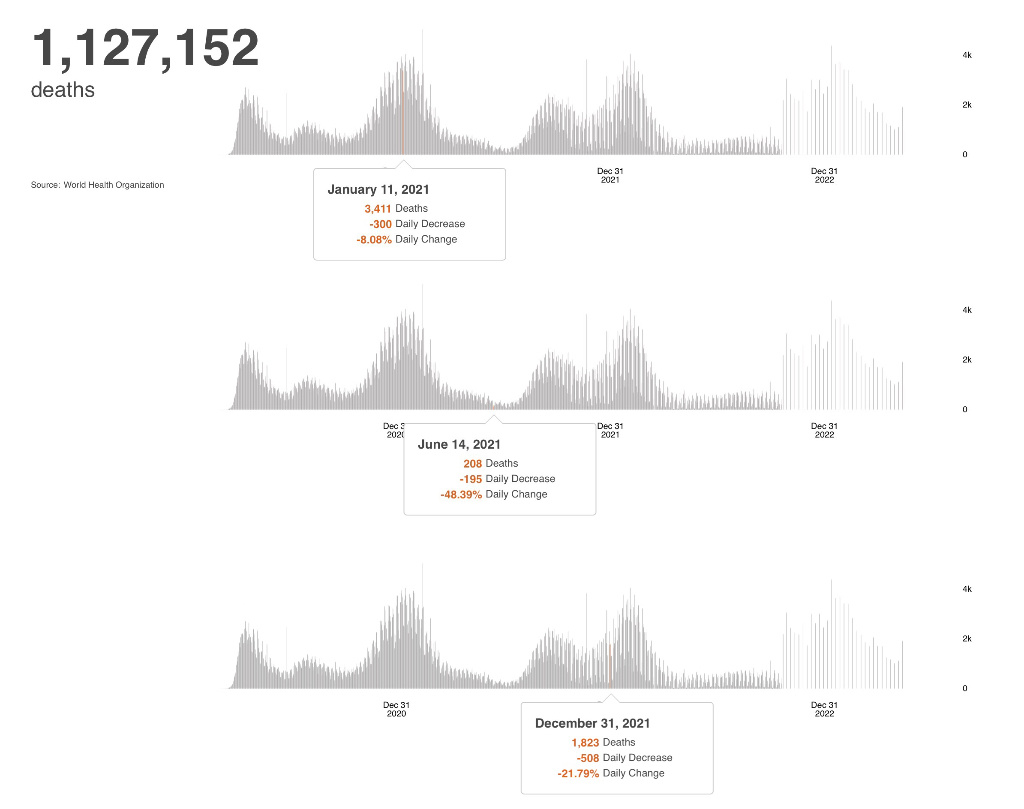
Figure 1: Key timespot of WHO Data of death rate during Covid-19 pandemic
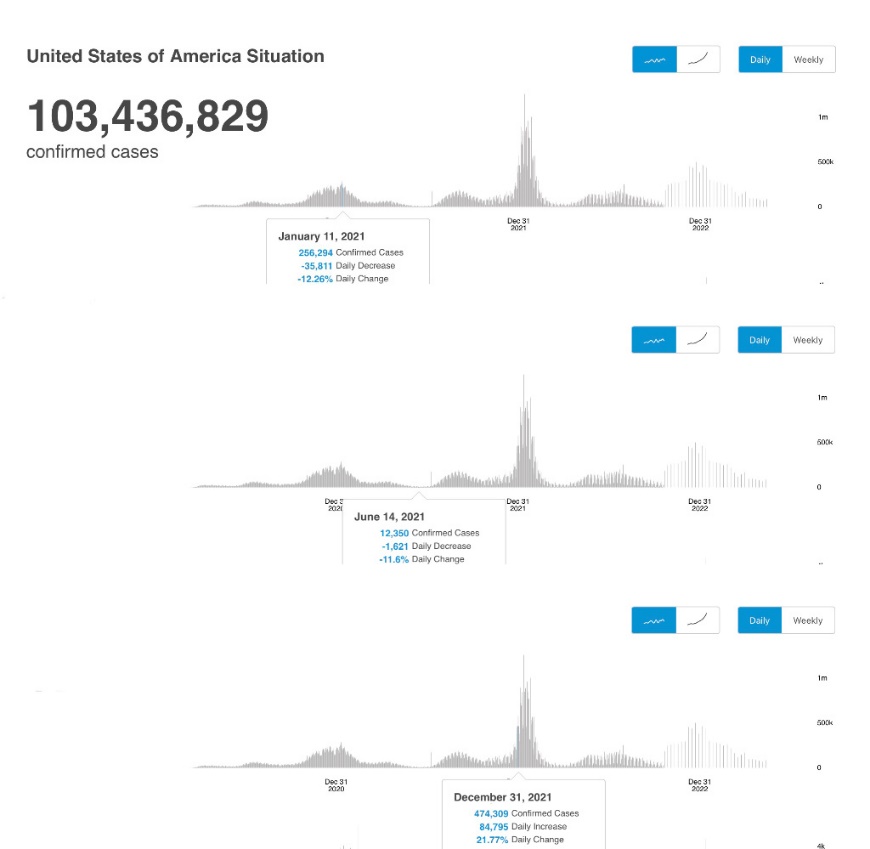
Figure 2: Key timespot of WHO Data of infection rate during Covid-19 pandemic
3.2. Academic Twitter
Twitter builds up an influential community for academic development in higher education [28]. Twitter provided free access of the data for researchers to conduct academic research (Twitter data for Academic Research | Twitter Developer platform). This research collect data from Twitter users public post from 4-29-2020 to 12-31-2021 under the topic "online learning".
Not only are Twitter users more interested in topic relevant to education topic, but also twitter is considered as an important platform of informal learning which is also considered as an important part of online learning [28]. Twitter is used as a platform of collecting data in this research because it can provide data more relevant to online learning and academic usage.
3.3. Sentiment Analysis
This research using sentiment analysis to analyze people's emotion, attitudes, and opinions toward online learning. Syuzhet R package is used to analysis the short text information collected from twitter. "The R package syuzhet has been designed to allow you to choose from four of these sentiment lexicons: Bing, Afinn, Stanford, and the NRC Word-Emotion Association Lexicon [29]. In this research, NRC Word-Emotion Association Lexicon is used for us to make connection between word and emotion. This lexicon includes 8 basic emotions proposed by Plutchik [30,31,32] which includes joy, sadness, anger, fear, disgust, surprise, trust and anticipation, and also positive and negative. This research will analysis these 10 categories of emotion by using text data published by individuals' on Twitter to see people's attitude toward online learning.
3.4. MDCOR
In order to analyse how the attitude towards E-Learning changes during and after the pandemic and the reasons behind it, the MDCOR — Machine Driven Classification of Open-ended Responses has been chosen as the most fitted. This method allows people to the maximum extent to the unresolved problem of how to turn off open-ended responses as rigorously and efficiently as possible. The MDCOR method provides a rigorous, user-friendly, no-code, and cost-free software application that implements texting mining and data organising within mixed equal-status text data [33]. In the topic that we are studying, about attitude towards change of online Learning, is that we need to analyse the open-ended text data from Twitter users and MDCOR can help organise vast quantities of information that has been collected. Meanwhile, MDCOR will value the data and MDCOR will outputs the Metrics Assessment and the Interactive Summaries. As a result, having a layout of the Metrics Assessment and the Interactive Summaries has made a set of fully classified databases. Throughout the Fully Classified Database, it turn out to be the Test of Group Code Association and the Code to Code Strength by Group. Therefore, the findings and the results part can rely on MDCOR’s final result in order to explore and examine how the attitude towards online Learning changes during and after the pandemic and the reasons behind it.
By considering two research questions – “What is the distribution of emotions regarding online learning on Twitter during the pandemic?” and “Does this distribution change when the analysis disaggregated during the pandemic?”, this method sheds light on the emotional attitude differences, highlighting the importance of the emotional attitude of E-Learning changed during and after the pandemic period. Although, the emotional attitude toward E-Learning changed - ……during and after the COVID-19 pandemic - and how the public has adapted to the specifics of the emotional attitude change in both questions, gives a perspective on how the technological advancement is being adapted to meet the public’s emotional changed during and after the pandemic period.
MDCOR was chosen as a main method of research because of its specificity and essentiality classification of open-ended responses. In the process that the Twitter users’s data has been collected, it is an unprocessed group of texts based on open-ended resources. Hence, this open-ended resource is Machine Driven Classification needed, based on MOCOR’s epistemology, this classification is based on Bayesian statistics and statistical physics, showing a full description of all the outputs resulting from its implementation [33]. The next step consists of the flow diagram implemented by MDCOR, making the natural text processing and text mining and normalisation with optional frequency words deleted for MDCOR to continue the processes [33]. Afterwards, the Metrics Assessments showed the identification of the optimal number of codes, showing the case that MDCOR will process the main outputs automatically. Aim to analyse the final MDCOR classification results, the main output is the test of independence needed, to continue the forward analysis. Thus, the outputs of MDCOR would be consequential whenever it is enriched by the voices of the participants.
4. Result
4.1. Sentiments Analysis
From 2020 April 29th to 2021 December 31st, there are 1437814 texts posted by twitter users under the topic of online learning. This research randomly selected 5000 texts from each of the wave as sample text for further sentiment analysis. All blank or unreadable texts are excluded from sample text. Fig.3, Fig.4, and Fig.5 are the histogram of sentiments analysis of each wave. Here is the interactive version of the graph, https://rpubs.com/RRiosssss/1070234,https://rpubs.com/RRiosssss/1070238,https://rpubs.com/RRiosssss/1070465
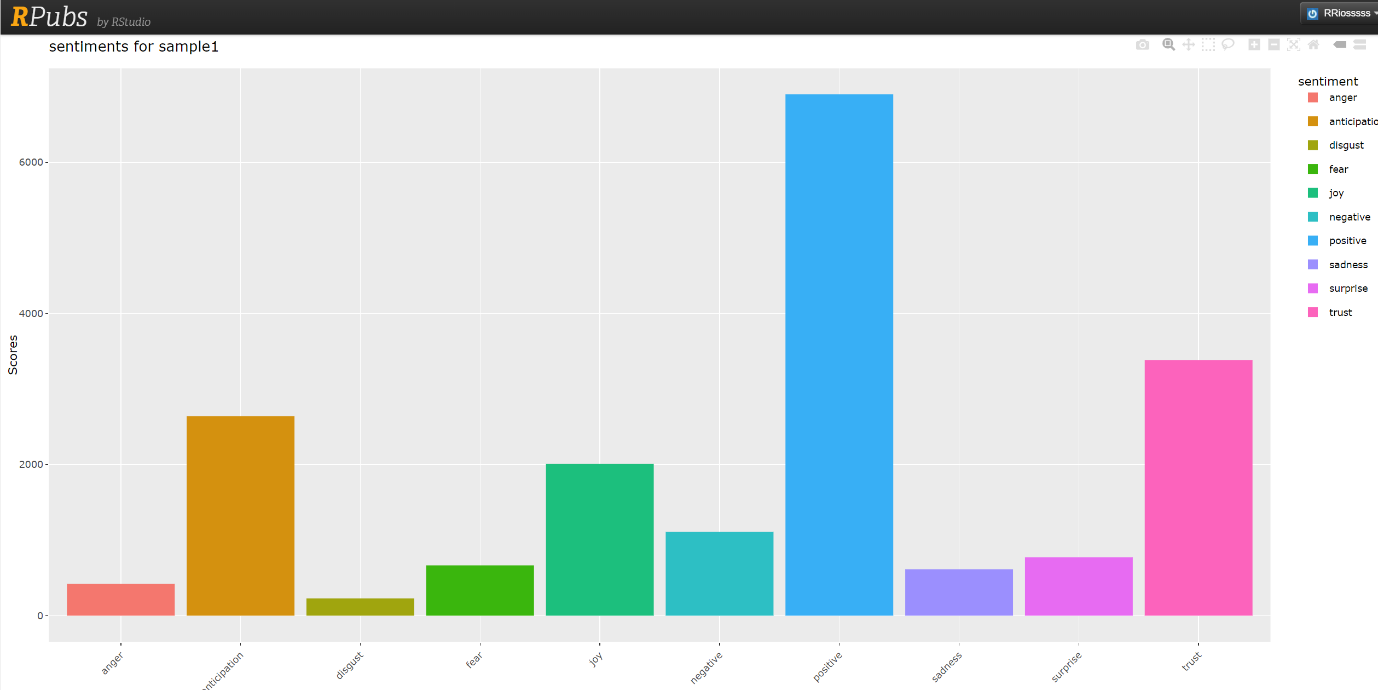
Figure 3: Wave 1 sentiment analysis result
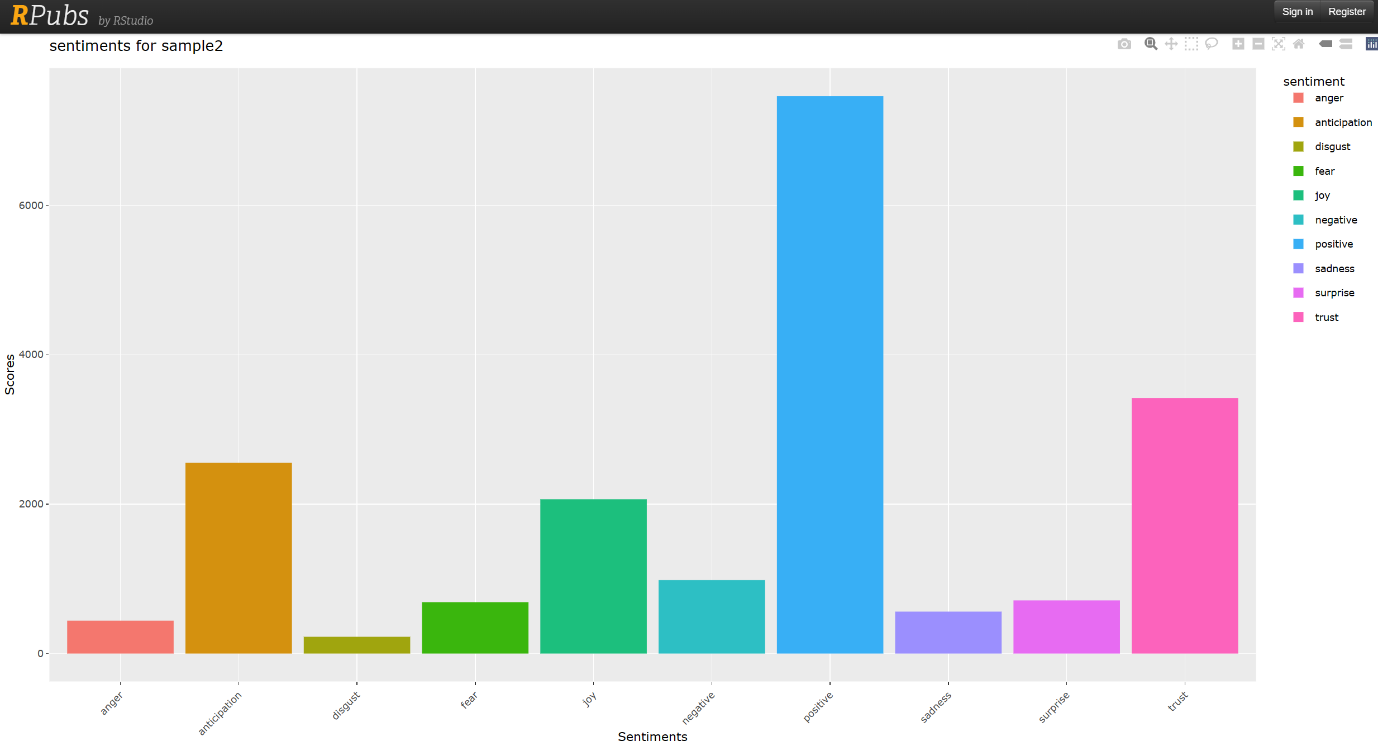
Figure 4: Wave 2 sentiment analysis result
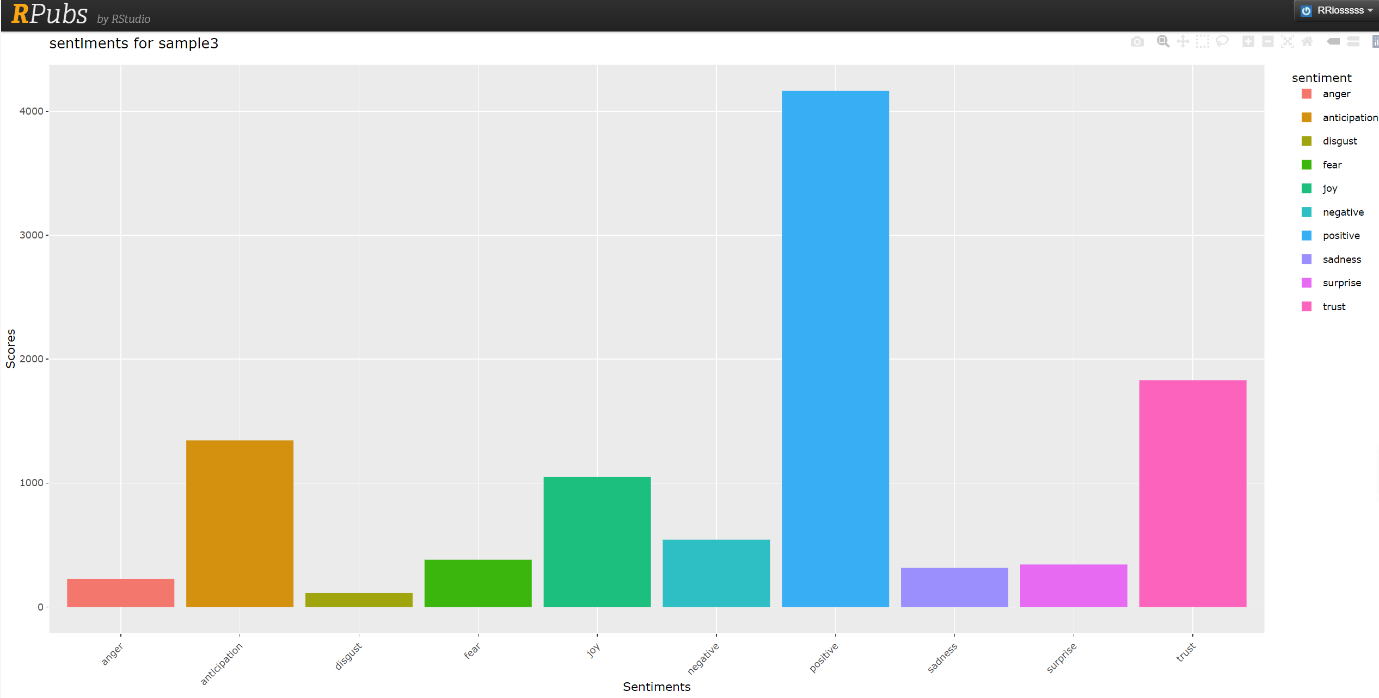
Figure 5: Wave 3 sentiment analysis result
The total score of sentiments from each wave is different from each other, so this research will calculate the ratio of each sentiment score in each of the wave in order to check if there is any variations of sentiment.
Table 1 is the aggregation table of 3 wave of sentiments.
Table 1: aggregation table of 3 wave of sentiments
Angry | Anticipation | Disgust | Fear | Joy | Sadness | Surprise | Trust | Positive | Negative | |
Wave1 | 2.24% | 14.10% | 1.22% | 3.55% | 10.40% | 3.27% | 4.11% | 18% | 36.80% | 6% |
Wave2 | 2.30% | 11.80% | 1.18% | 3.59% | 10.80% | 3% | 3.72% | 17.90% | 39% | 5.14% |
Wave3 | 2.19% | 7% | 13% | 1.10% | 3.70% | 3.10% | 3.22% | 17.70% | 40.40% | 5.27% |
Based on the ratio of each sentiment in wave, the table shows that there are more positive sentiment than negative sentiment. Also, trust occurs at a high frequency in every wave. Generally, there is not much change in sentiments between the three waves. The most obvious variation is the disgust. From wave 2 to wave 3, disgust suddenly increase from 1.18% of all sentiment to 13% which is a huge gap. At the same time, sample data shows less fear, less anticipation and less joy from wave 2 to wave 3.
4.2. Most Representative Result from MDCOR
MCCOR is used to analysis open-ended responses from random 5000 sample from each wave. After execution of MDCOR 3 times by using sample data from 3 waves, and decide the number of topic need to sperate, Fig 6 to Fig.12 are output of relevent terms and topic in each of the wave. Fig. 6 and Fig.7 are two separation of topic published by twitter users under online learning topic during wave 1. Fig. 8, Fig.9, and Fig 10 are 3 separation topic during wave 2. Fig 11 and Fig. 12 are 2 separation topic during wave 3.
For further understand what are the content under these topics, most representative open ended response are summarized by researchers. We found that during wave 1, the most representative content under the first topic is " Enter to win Dash and Dot robots and accessories wonderworkshop Inapp learntocode challenges provide hours of self-directed learning time ". The most representative content under the second topic is " online learning, educators, and learning process".
During the wave 2, the most representative content under the first topic is "udemy udemycourse udemyfree udemycoupon onlinecourses udemycoupons udemycourses programming". The most representative content under the second topic is " Great tutors for students". For the third topic, the most representative content is " Join Webinar of npcindia for Higher productivity and SelfImprovement npccertificate NPCINDIAGOV onlinelearning EnergyEfficiency environnement Agritech HRCommunity."
During the wave 3, the most representative content under the first topic is "Join Webinar of npcindia for Higher productivity and SelfImprovement npccertificate NPCINDIAGOV onlinelearning EnergyEfficiency environment Agritech HRCommunity". Under the second topic, the content is "Group educators, take home online course, free course."
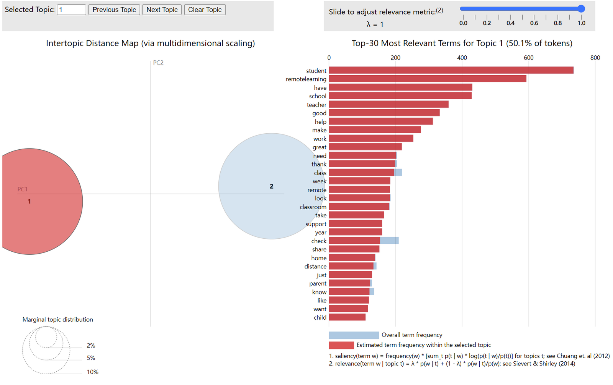
Figure 6: Topic 1 of most representative world wave 1
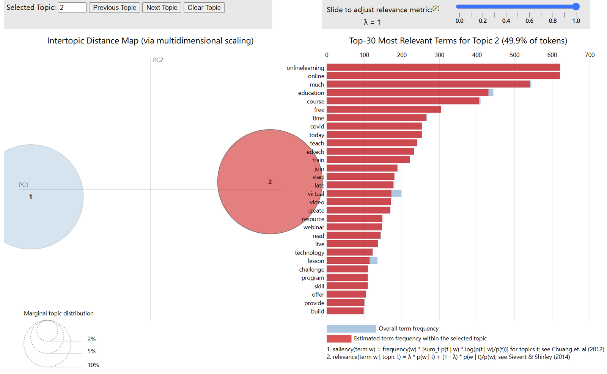
Figure 7: Topic 2 of most representative world wave 1
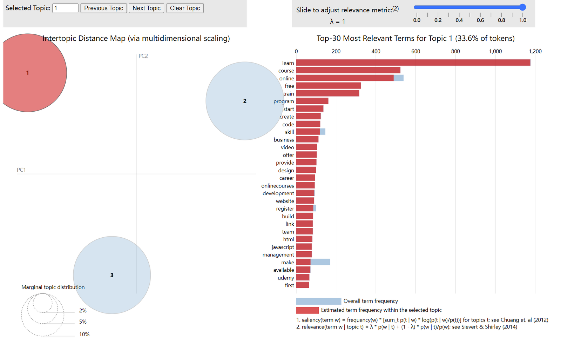
Figure 8: Topic 1 of most representative world wave 2
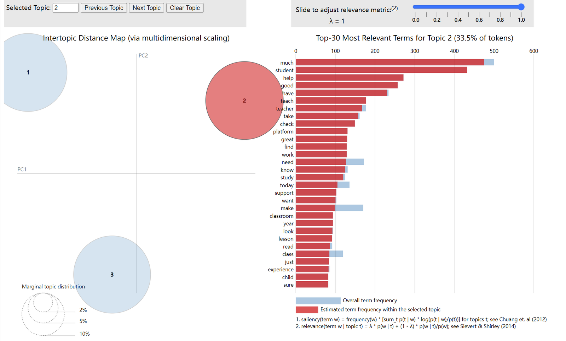
Figure 9: Topic 2 of most representative world wave 2
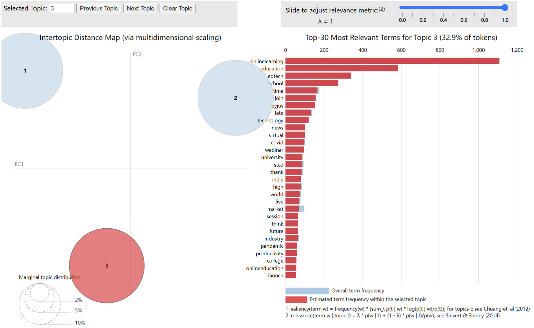
Figure 10: Topic 3 of most representative world wave 2
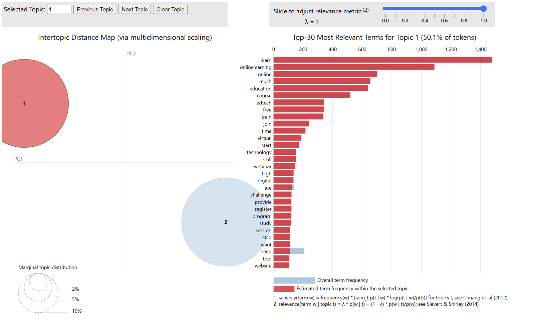
Figure 11: Topic 1 of most representative world wave 3
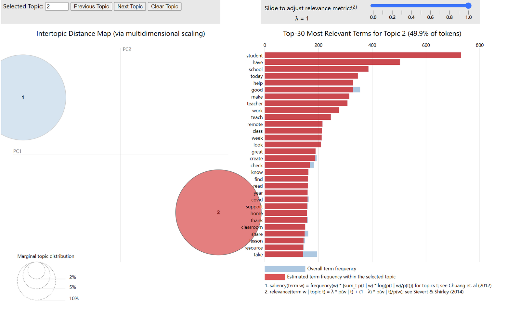
Figure 12: Topic 2 of most representative world wave 3
5. Discussion
Based on our finding from sentiment analysis, twitter users show more positive sentiment, and trust under the topic of online learning can help us to understand the situation faced by online learning. Online learning, at least from this research, is trustworthy and acceptable education format.
The sudden increase of the disgust sentiments potentially influenced by the sensitive timing related to the COVID-19. Since the wave 2 is the trough of the Covid-19 infection and death rate, but this trending start to change during wave 3. People have to face the pressure brought by increasing death and infection rate, stay at home again. This could be the potential of the emotional change between wave 2 and wave 3.
We are surprised by the most representative content produced by MDCOR under the topic of online learning by twitter users. Advertisements filled most of the posts under the topic of online learning. There are more ratio of people express their emotions about online learning, pandemic, and covid-19 during the first wave. However, during the second and third wave, more and more people start use social media as the best platform to post advertisements. These advertisements include personal tutor, free computer language course, self-learning topic. We found that people start to get used to the new form of education. Since during pandemic, many people are faced with job loss and lack of financial resources, and conducting online courses seems to be a way to make profit.
6. Conclusion
Before making conclusions from our findings, few limitations of this research must be raised. First, the data of this research only is a period during pandemic. We could not infer it can represent the people's attitude towards online learning for whole pandemic period. Second, this research only chooses 5000 sample posts from more than 1 million of total posts, so we may not conclude that it can represent the whole population who posts on twitter under the topic of online learning. Thirdly, the results of MDCOR shows large number of advertisements, we may miss opinion from other perspective of online learning other than advertisements.
In summary, this research can help to understand people's basic attitudes towards online learning are more positive. People shows more trust, anticipation, and joy under the online learning topic. Online learning is more accepted by everyone than we thought, and this new way of education may help more people even not in pandemic. At the same time, traditional classroom setting of education also needed, since we found people's attitude toward online learning change negatively between wave 2 and wave 3.
Moreover, online learning provides more opportunities to earn profit. Advertisements online are easier and less expensive. Online learning also lifts geographic barriers which allows more people to get engage in more resources.
References
[1]. Lynch, M. (2020). E-Learning During A Global Pandemic. Asian Journal of Distance Education, 15(1), 189-195. Retrieved from http://www.asianjde.com/ojs/index.php/AsianJDE/article/view/45
[2]. D. Nambiar (2020). The impact of online learning during COVID-19: students' and teachers’ perspective. International Journal of Indian Psychology, 8(2), 783-793. DIP:18.01.094/20200802, DOI:10.25215/0802.094
[3]. Carr, C. T., & Hayes, R. A. (2015). Social Media: Defining, developing, and divining. Atlantic Journal of Communication, 23(1), 46–65. https://doi.org/10.1080/15456870.2015.972282
[4]. Bruns, A., & Moe, H. (2014). Structural layers of communication on Twitter. Twitter and society [Digital formations, volume 89], 15-28.
[5]. Lades, L. K., Laffan, K., Daly, M., & Delaney, L. (2020). Daily emotional well‐being during the Covid‐19 pandemic. British Journal of Health Psychology, 25(4), 902–911. https://doi.org/10.1111/bjhp.12450
[6]. Canet-Juric, L., Andrés, M. L., del Valle, M., López-Morales, H., Poó, F., Galli, J. I., Yerro, M., & Urquijo, S. (2020). A longitudinal study on the emotional impact cause by the COVID-19 pandemic quarantine on general population. Frontiers in Psychology, 11. https://www.frontiersin.org/articles/10.3389/fpsyg.2020.565688/full
[7]. Brooks, S. K., Webster, R. K., Smith, L. E., Woodland, L., Wessely, S., Greenberg, N., & Rubin, G. J. (2020). The psychological impact of quarantine and how to reduce it: Rapid review of the evidence. SSRN Electronic Journal. https://doi.org/10.2139/ssrn.3532534[
[8]. Gallant, A. J., Nicholls, L. A., Rasmussen, S., Cogan, N., Young, D., & Williams, L. (2021). Changes in attitudes to vaccination as a result of the COVID-19 pandemic: A longitudinal study of older adults in the UK. PLOS ONE, 16(12). https://doi.org/10.1371/journal.pone.0261844
[9]. Kamal, M., Abo Omirah, M., Hussein, A., & Saeed, H. (2020). Assessment and characterisation of post‐covid‐19 manifestations. International Journal of Clinical Practice, 75(3). https://doi.org/10.1111/ijcp.13746
[10]. Naseem, S., Mohsin, M., Hui, W., Liyan, G., & Penglai, K. (2021). The investor psychology and stock market behavior during the initial era of COVID-19: A study of china, Japan, and the United States. Frontiers in Psychology, 12. https://doi.org/10.3389/fpsyg.2021.626934
[11]. H. Manguri, K., N. Ramadhan, R., & R. Mohammed Amin, P. (2020). Twitter sentiment analysis on worldwide COVID-19 outbreaks. Kurdistan Journal of Applied Research, 54–65. https://doi.org/10.24017/covid.8
[12]. Serrano-Guerrero, J., Olivas, J. A., Romero, F. P., & Herrera-Viedma, E. (2015). Sentiment analysis: A review and Comparative Analysis of Web Services. Information Sciences, 311, 18–38. https://doi.org/10.1016/j.ins.2015.03.040
[13]. Sailunaz, K., & Alhajj, R. (2019). Emotion and sentiment analysis from Twitter text. Journal of Computational Science, 36, 101003. https://doi.org/10.1016/j.jocs.2019.05.009
[14]. Nemes, L., & Kiss, A. (2020). Social media sentiment analysis based on covid-19. Journal of Information and Telecommunication, 5(1), 1–15. https://doi.org/10.1080/24751839.2020.1790793
[15]. Boon-Itt, S., & Skunkan, Y. (2020). Public Perception of the COVID-19 Pandemic on Twitter: Sentiment Analysis and Topic Modeling Study (Preprint). https://doi.org/10.2196/preprints.21978
[16]. Asur, S., & Huberman, B. A. (2010). Predicting the future with social media. 2010 IEEE/WIC/ACM International Conference on Web Intelligence and Intelligent Agent Technology. https://doi.org/10.1109/wi-iat.2010.63
[17]. Bermingham, A., & Smeaton, A. (2011). On using Twitter to monitor political sentiment and predict election ... https://aclanthology.org/W11-3702.pdf
[18]. Jin, Z., Yang, Y., & Liu, Y. (2019). Stock closing price prediction based on sentiment analysis and LSTM. Neural Computing and Applications, 32(13), 9713–9729. https://doi.org/10.1007/s00521-019-04504-2
[19]. Sahir, S. H., Ayu Ramadhana, R. S., Romadhon Marpaung, M. F., Munthe, S. R., & Watrianthos, R. (2021). Online learning sentiment analysis during the COVID-19 Indonesia pandemic using Twitter data. IOP Conference Series: Materials Science and Engineering, 1156(1), 012011. https://doi.org/10.1088/1757-899x/1156/1/012011
[20]. Carliner, S. (2004). An overview of online learning. HRD Press.
[21]. Putri, R. S., Purwanto, A., Pramono, R., Asbari, M., Wijayanti, L. M., & Hyun, C. C. (2020). Impact of the COVID-19 pandemic on online home learning: An explorative study of primary schools in Indonesia. International journal of advanced science and technology, 29(5), 4809-4818.
[22]. Mushtaha, E., Abu Dabous, S., Alsyouf, I., Ahmed, A., & Raafat Abdraboh, N. (2022). The challenges and opportunities of online learning and teaching at engineering and theoretical colleges during the pandemic. Ain Shams Engineering Journal, 13(6), 101770. https://doi.org/10.1016/j.asej.2022.101770
[23]. Althagafi, A., Althobaiti, G., Alhakami, H., & Alsubait, T. (2021). Arabic tweets sentiment analysis about online learning during COVID-19 in Saudi Arabia. International Journal of Advanced Computer Science and Applications, 12(3). https://doi.org/10.14569/ijacsa.2021.0120373
[24]. Bäuerle, A., Teufel, M., Musche, V., Weismüller, B., Kohler, H., Hetkamp, M., Dörrie, N., Schweda, A., & Skoda, E.-M. (2020). Increased generalized anxiety, depression and distress during the COVID-19 pandemic: A cross-sectional study in Germany. Journal of Public Health, 42(4), 672–678. https://doi.org/10.1093/pubmed/fdaa106
[25]. Porcelli, P. (2020). Fear, anxiety and health-related consequences after the COVID-19 epidemic. Clinical Neuropsychiatry, 17(2), 103. Https://doi.org/10.36131/CN20200215
[26]. World Health Organization. (n.d.). United States of America: Who coronavirus disease (covid-19) dashboard with vaccination data. World Health Organization. https://covid19.who.int/region/amro/country/us
[27]. Dixon, S. J. (2023). Countries with most X/twitter users 2023. Statista. https://www.statista.com/statistics/242606/number-of-active-twitter-users-in-selected-countries/
[28]. O’Keeffe, M. (2018). Academic twitter and professional learning: Myths and realities. International Journal for Academic Development, 24(1), 35–46. https://doi.org/10.1080/1360144x.2018.1520109
[29]. Isasi, J. (2021). Análisis de sentimientos en R con'syuzhet'. The Programming Historian en espanol.
[30]. Plutchik, R., & Ax, A. F. (1967). A critique of determinants of emotional state by Schachter and Singer (1962). Psychophysiology, 4(1), 79-82.
[31]. Plutchik, R. (1980). A general psychoevolutionary theory of emotion. In Theories of emotion (pp. 3-33). Academic press.
[32]. Plutchik, R. (1994). The psychology and biology of emotion. HarperCollins College Publishers.
[33]. González Canché, M. S. (2023). Machine Driven Classification of open-ended responses (MDCOR): An analytic framework and no-code, free software application to classify longitudinal and cross-sectional text responses in survey and Social Media Research. Expert Systems with Applications, 215, 119265. https://doi.org/10.1016/j.eswa.2022.119265
Cite this article
Zheng,Y.;Li,A.;Xu,C.;Ouyang,P.;Li,C. (2024). How Attitudes Toward Online Learning Changes During Pandemic, and Reasons Behind It. Lecture Notes in Education Psychology and Public Media,48,237-249.
Data availability
The datasets used and/or analyzed during the current study will be available from the authors upon reasonable request.
Disclaimer/Publisher's Note
The statements, opinions and data contained in all publications are solely those of the individual author(s) and contributor(s) and not of EWA Publishing and/or the editor(s). EWA Publishing and/or the editor(s) disclaim responsibility for any injury to people or property resulting from any ideas, methods, instructions or products referred to in the content.
About volume
Volume title: Proceedings of the 2nd International Conference on Interdisciplinary Humanities and Communication Studies
© 2024 by the author(s). Licensee EWA Publishing, Oxford, UK. This article is an open access article distributed under the terms and
conditions of the Creative Commons Attribution (CC BY) license. Authors who
publish this series agree to the following terms:
1. Authors retain copyright and grant the series right of first publication with the work simultaneously licensed under a Creative Commons
Attribution License that allows others to share the work with an acknowledgment of the work's authorship and initial publication in this
series.
2. Authors are able to enter into separate, additional contractual arrangements for the non-exclusive distribution of the series's published
version of the work (e.g., post it to an institutional repository or publish it in a book), with an acknowledgment of its initial
publication in this series.
3. Authors are permitted and encouraged to post their work online (e.g., in institutional repositories or on their website) prior to and
during the submission process, as it can lead to productive exchanges, as well as earlier and greater citation of published work (See
Open access policy for details).
References
[1]. Lynch, M. (2020). E-Learning During A Global Pandemic. Asian Journal of Distance Education, 15(1), 189-195. Retrieved from http://www.asianjde.com/ojs/index.php/AsianJDE/article/view/45
[2]. D. Nambiar (2020). The impact of online learning during COVID-19: students' and teachers’ perspective. International Journal of Indian Psychology, 8(2), 783-793. DIP:18.01.094/20200802, DOI:10.25215/0802.094
[3]. Carr, C. T., & Hayes, R. A. (2015). Social Media: Defining, developing, and divining. Atlantic Journal of Communication, 23(1), 46–65. https://doi.org/10.1080/15456870.2015.972282
[4]. Bruns, A., & Moe, H. (2014). Structural layers of communication on Twitter. Twitter and society [Digital formations, volume 89], 15-28.
[5]. Lades, L. K., Laffan, K., Daly, M., & Delaney, L. (2020). Daily emotional well‐being during the Covid‐19 pandemic. British Journal of Health Psychology, 25(4), 902–911. https://doi.org/10.1111/bjhp.12450
[6]. Canet-Juric, L., Andrés, M. L., del Valle, M., López-Morales, H., Poó, F., Galli, J. I., Yerro, M., & Urquijo, S. (2020). A longitudinal study on the emotional impact cause by the COVID-19 pandemic quarantine on general population. Frontiers in Psychology, 11. https://www.frontiersin.org/articles/10.3389/fpsyg.2020.565688/full
[7]. Brooks, S. K., Webster, R. K., Smith, L. E., Woodland, L., Wessely, S., Greenberg, N., & Rubin, G. J. (2020). The psychological impact of quarantine and how to reduce it: Rapid review of the evidence. SSRN Electronic Journal. https://doi.org/10.2139/ssrn.3532534[
[8]. Gallant, A. J., Nicholls, L. A., Rasmussen, S., Cogan, N., Young, D., & Williams, L. (2021). Changes in attitudes to vaccination as a result of the COVID-19 pandemic: A longitudinal study of older adults in the UK. PLOS ONE, 16(12). https://doi.org/10.1371/journal.pone.0261844
[9]. Kamal, M., Abo Omirah, M., Hussein, A., & Saeed, H. (2020). Assessment and characterisation of post‐covid‐19 manifestations. International Journal of Clinical Practice, 75(3). https://doi.org/10.1111/ijcp.13746
[10]. Naseem, S., Mohsin, M., Hui, W., Liyan, G., & Penglai, K. (2021). The investor psychology and stock market behavior during the initial era of COVID-19: A study of china, Japan, and the United States. Frontiers in Psychology, 12. https://doi.org/10.3389/fpsyg.2021.626934
[11]. H. Manguri, K., N. Ramadhan, R., & R. Mohammed Amin, P. (2020). Twitter sentiment analysis on worldwide COVID-19 outbreaks. Kurdistan Journal of Applied Research, 54–65. https://doi.org/10.24017/covid.8
[12]. Serrano-Guerrero, J., Olivas, J. A., Romero, F. P., & Herrera-Viedma, E. (2015). Sentiment analysis: A review and Comparative Analysis of Web Services. Information Sciences, 311, 18–38. https://doi.org/10.1016/j.ins.2015.03.040
[13]. Sailunaz, K., & Alhajj, R. (2019). Emotion and sentiment analysis from Twitter text. Journal of Computational Science, 36, 101003. https://doi.org/10.1016/j.jocs.2019.05.009
[14]. Nemes, L., & Kiss, A. (2020). Social media sentiment analysis based on covid-19. Journal of Information and Telecommunication, 5(1), 1–15. https://doi.org/10.1080/24751839.2020.1790793
[15]. Boon-Itt, S., & Skunkan, Y. (2020). Public Perception of the COVID-19 Pandemic on Twitter: Sentiment Analysis and Topic Modeling Study (Preprint). https://doi.org/10.2196/preprints.21978
[16]. Asur, S., & Huberman, B. A. (2010). Predicting the future with social media. 2010 IEEE/WIC/ACM International Conference on Web Intelligence and Intelligent Agent Technology. https://doi.org/10.1109/wi-iat.2010.63
[17]. Bermingham, A., & Smeaton, A. (2011). On using Twitter to monitor political sentiment and predict election ... https://aclanthology.org/W11-3702.pdf
[18]. Jin, Z., Yang, Y., & Liu, Y. (2019). Stock closing price prediction based on sentiment analysis and LSTM. Neural Computing and Applications, 32(13), 9713–9729. https://doi.org/10.1007/s00521-019-04504-2
[19]. Sahir, S. H., Ayu Ramadhana, R. S., Romadhon Marpaung, M. F., Munthe, S. R., & Watrianthos, R. (2021). Online learning sentiment analysis during the COVID-19 Indonesia pandemic using Twitter data. IOP Conference Series: Materials Science and Engineering, 1156(1), 012011. https://doi.org/10.1088/1757-899x/1156/1/012011
[20]. Carliner, S. (2004). An overview of online learning. HRD Press.
[21]. Putri, R. S., Purwanto, A., Pramono, R., Asbari, M., Wijayanti, L. M., & Hyun, C. C. (2020). Impact of the COVID-19 pandemic on online home learning: An explorative study of primary schools in Indonesia. International journal of advanced science and technology, 29(5), 4809-4818.
[22]. Mushtaha, E., Abu Dabous, S., Alsyouf, I., Ahmed, A., & Raafat Abdraboh, N. (2022). The challenges and opportunities of online learning and teaching at engineering and theoretical colleges during the pandemic. Ain Shams Engineering Journal, 13(6), 101770. https://doi.org/10.1016/j.asej.2022.101770
[23]. Althagafi, A., Althobaiti, G., Alhakami, H., & Alsubait, T. (2021). Arabic tweets sentiment analysis about online learning during COVID-19 in Saudi Arabia. International Journal of Advanced Computer Science and Applications, 12(3). https://doi.org/10.14569/ijacsa.2021.0120373
[24]. Bäuerle, A., Teufel, M., Musche, V., Weismüller, B., Kohler, H., Hetkamp, M., Dörrie, N., Schweda, A., & Skoda, E.-M. (2020). Increased generalized anxiety, depression and distress during the COVID-19 pandemic: A cross-sectional study in Germany. Journal of Public Health, 42(4), 672–678. https://doi.org/10.1093/pubmed/fdaa106
[25]. Porcelli, P. (2020). Fear, anxiety and health-related consequences after the COVID-19 epidemic. Clinical Neuropsychiatry, 17(2), 103. Https://doi.org/10.36131/CN20200215
[26]. World Health Organization. (n.d.). United States of America: Who coronavirus disease (covid-19) dashboard with vaccination data. World Health Organization. https://covid19.who.int/region/amro/country/us
[27]. Dixon, S. J. (2023). Countries with most X/twitter users 2023. Statista. https://www.statista.com/statistics/242606/number-of-active-twitter-users-in-selected-countries/
[28]. O’Keeffe, M. (2018). Academic twitter and professional learning: Myths and realities. International Journal for Academic Development, 24(1), 35–46. https://doi.org/10.1080/1360144x.2018.1520109
[29]. Isasi, J. (2021). Análisis de sentimientos en R con'syuzhet'. The Programming Historian en espanol.
[30]. Plutchik, R., & Ax, A. F. (1967). A critique of determinants of emotional state by Schachter and Singer (1962). Psychophysiology, 4(1), 79-82.
[31]. Plutchik, R. (1980). A general psychoevolutionary theory of emotion. In Theories of emotion (pp. 3-33). Academic press.
[32]. Plutchik, R. (1994). The psychology and biology of emotion. HarperCollins College Publishers.
[33]. González Canché, M. S. (2023). Machine Driven Classification of open-ended responses (MDCOR): An analytic framework and no-code, free software application to classify longitudinal and cross-sectional text responses in survey and Social Media Research. Expert Systems with Applications, 215, 119265. https://doi.org/10.1016/j.eswa.2022.119265