


1. Introduction
Amidst the awakening of health consciousness and the transformation of lifestyles. Chinese consumers’ demand for healthy beverages is burgeoning. In this context, wellness tea drinks, owing to their distinctive health properties and cultural allure, are swiftly emerging as a new darling in the market. This report endeavors to explore an in-depth the dynamic changes in the demand and consumptison patterns of health tea across provinces in China. Through a meticulous analysis of the sales volume, price, and consumption behaviors of health tea in varioust cities and store brands, this report reveals the market trends and prognosticates the trajectory of future development. In the wake of the resurgence of traditional Chinese medicine culture and the upgrading of national health demands, the health tea and beverage industry has been presented with unprecedented development opportunities. The support of national policies, consumers’ pursuit of healthy quality, and the popularity of the culture of wellness have jointly promoted the booming development of this industry. According to market research data, the scale of China’s wellness tea and beverage market size has shown significant growth over the past few years and is expected to exceed the 100 billion yuan mark by 2028. Such growth not only reflects the market potential, but also signals that the wellness tea and beverage industry will become an important growth point in the health consumption sector. This report will formulate a sales volume regression forecasting model by comprehensively analyzing sales volume data, price changes, and consumer behavior, , with the intention of furnishing decision-making support for industry participants and serving as a reference for policymakers. In the following chapters, this report will discuss in detail the market overview, consumption patterns, as well as the construction and application of the sales forecasting model of health tea drinks, in order to provide readers with a comprehensive perspective and insight into the deeper dynamics of this vibrant market.
2. Description of the consumption data of health tea
2.1. Data preprocessing
There are seven fields in the health tea sales data used in this analysis, and the specific field information is shown in Table1. As shown in Table1, this dataset has 3,641 samples, and the sales data of different health tea sold by different stores in different provinces were collected from Taobao.
Table 1: Field Description Table
Field Name | Field Content | Field Type |
Title | Nourishing Tea Infusion | Categorical |
Pre-Coupon Price | 19.9 | Continuous |
Post-Coupon Price | 13.43 | Continuous |
Province | Zhejiang | Categorical |
City | Hangzhou | Categorical |
Sales Volume | 10000 | Continuous |
Shop | Daily Special Sale Factory Store | Categorical |
During the data cleaning process, in the case of missing values for "pre-coupon price", this paper employs a filling strategy. Specifically, the missing “pre-coupon price” is filled with the corresponding product’s “post-coupon price”. This approach is based on the assumption that in the absence of a missing value for the “pre-coupon price”, the “post-coupon price” of the corresponding product is filled in. This approach is based on the assumption that when there is not enough information to determine the “pre-coupon price”, the “post-coupon price” can be used as a reasonable estimate. For the problem of inconsistent data types in the “sales” field, this paper uses Python tools to handle the problem by eliminating non-numeric text such as “people have seen” and converting numeric text such as”200,000 and converted the numeric text like “200000”to numeric data “200000”. In this way, all “sales” data was converted to continuous numeric variables, providing a consistent and clean database for subsequent data analysis and modeling. The result is a clean, consistent data set with no missing values in the “Pre-coupon” and “Post-coupon” fields, and all the data in the “Sales” field is in a All the data in the “Sales” field are in numerical form, which is convenient for statistical analysis and model training. Such data cleansing and preprocessing steps are essential for improving the accuracy and reliability of the model, as they ensure the quality and consistency of the data, allowing the model to learn and make predictions based on data that accurately reflect the actual situation.
2.2. Visualization of Sales
An analysis is conducted on the price kernel density comparison charts for the pre-coupon price and the post-coupon price of Nutritious Tea. From Figure1, it can be observed that most of the product prices are concentrated in the range of 0 - 50 yuan. In the range of 20 - 40, the pre-coupon price of the health tea is significantly higher than the post-coupon price, suggesting a stronger discount in this interval. In the range of 0 - 20, there are a number of products with a pre-coupon price lower than the post-coupon price, which may be anomalies and require attention. Next, a summary is made of the sales of wellness tea from different stores and a histogram of the sales of the stores located in the top 6 sales is plotted. As can be seen from the Figure 2, the top seller is AliHealth Pharmacy with 17,173,567, followed by Daily Sale Factory Store with 1,494,676.
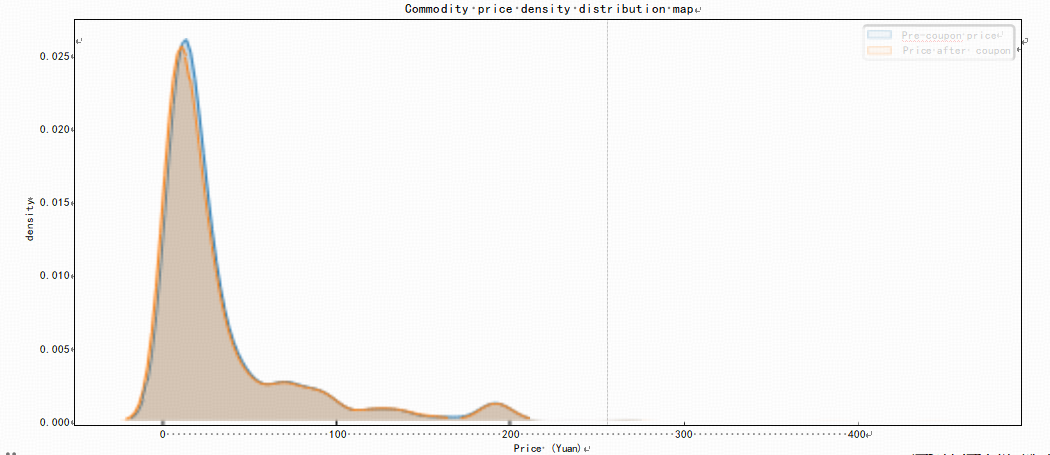
Figure 1: Commodity price kernel density maps
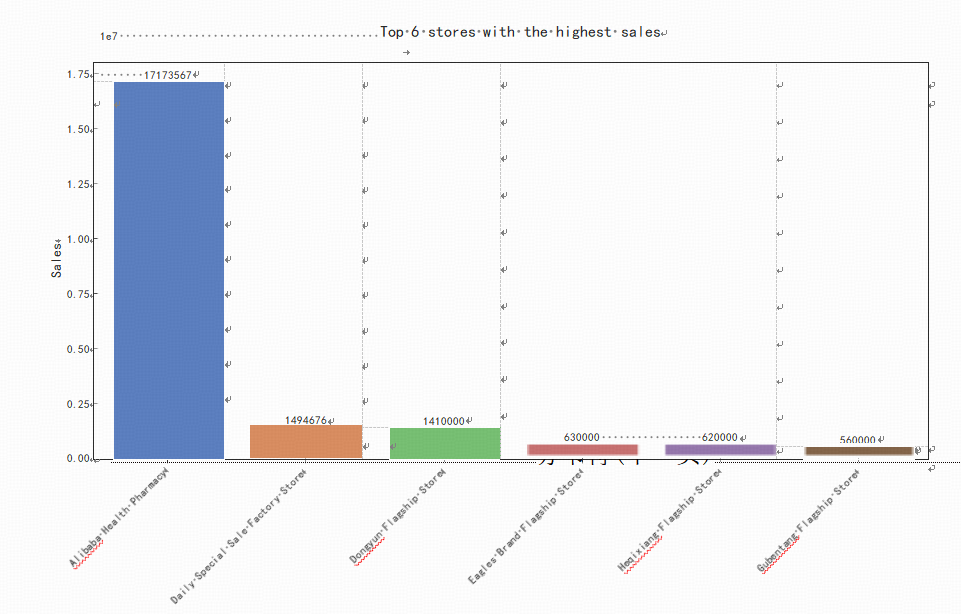
Figure 2: Top 6 stores with the most sales
2.3. Summary of statistical analysis of sales of health tea
In this section, there have explored the sales of health tea through visual analytics, and the following is a summary of the results:
The word cloud of product names shows that “health tea bags ”has the highest frequency of occurrence in product titles, which reveals that teabag products are popular in the market due to their convenience and easy brewing characteristics, and consumers have a greater demand for these products. Meanwhile, the high frequency of “Beijing Tongrentang”, a long-established brand, in the product title reflects consumers’ high recognition and trust in the brand, indicating that the brand effect of the long-established brand plays an important role in the health tea market. In summary, health tea bag products are favored by the market because of their convenience, and long-established brands such as Beijing Tongrentang occupy a place in the market by virtue of their brand effect. Price concessions are an important factor influencing consumers’ purchasing decisions, especially in the price range of 20-40 yuan, and merchants increase sales by providing coupons, etc. The stores with the leading sales volume are mostly large pharmacies and factory stores, which may be be related to their extensive product lines, brand reputation and price advantages
3. Healthy Tea Sales Return Forecast
3.1. Introduction to linear regression theory
Regression analysis, as a prominent statistical method, is primarily employed to estimate the relationships among variables. In the domain of sales volume forecasting, our attention is centered on the influence exerted by several independent variables, such as price, promotional activities, and seasonal factors, upon the dependent variable of sales volume. Through the construction of regression models, we can not only fathom the interconnections among these variables but also prognosticate future sales trends. There exists a diverse range of regression models. The linear regression model presupposes a linear relationship between the independent variables and the dependent variable [1]. The multiple linear regression model is utilized to appraise the combined impact of multiple factors on sales volume [2]. Lasso regression, on the other hand, curtails model complexity by incorporating penalty terms for variable selection and regularization, thereby enhancing the predictive accuracy and generalization capacity of the model [3]. During the process of model construction and evaluation, an appropriate regression model is selected based on historical data, and its parameters are estimated. Subsequently, statistical indicators such as R-squared, adjusted R-squared, F-statistic, and t-test are employed to assess the goodness of fit of the model as well as the significance of each independent variable, ensuring the validity and dependability of the model [4].
3.2. Sales Forecast Modeling
Prior to the sales prediction, the per capita GPD data of each city was incorporated into original dataset, and several novel features were appended. The new features encompassed per capita GDP (in yuan), geographic region (categorized as East China, South China) and discount margin (calculated as pre-coupon price minus post- coupon price. The intention behind these additions was to enhance the precision of the model's predictions and to discern the influence on user consumption [5]. In the realm of sales prediction, a diverse array of regression models was employed, namely ordinary linear regression, Lasso regression, Ridge regression, random forest regression, and gradient boosted tree regression. The characteristics of these regression methods are briefly described here: Ordinary linear regression is one of the most basic regression models for situations where there is a linear relationship between variables. Its mathematical expression is y = β0 + β1x1 +β2x2 + · · · + βnxn + ∈, where β is the coefficient, x is the independent variable, y is the dependent variable, and ∈ is the error term. Lasso regression By introducing the L1 regularization term, Lasso regression is able to perform feature selection and compress some unimportant feature coefficients to zero, thus improving the interpretability of the model [6]. Ridge regression differs from Lasso regression in that Ridge regression reduces the complexity of the model through the L2 regularization term, and is suitable for the case where there is multicollinearity between features [7]. Random forest regression is an integrated learning method that improves model stability and accuracy by constructing multiple decision trees and synthesizing their predictions [8]. Gradient Boosting Regressor (GBR) progressively improves the performance of the model by iteratively training the decision tree, with each step optimizing on the previous step [9]. This paper used each of these five models to make predictions, and the output histogram of R2 values for the five models is shown in Figure 3:
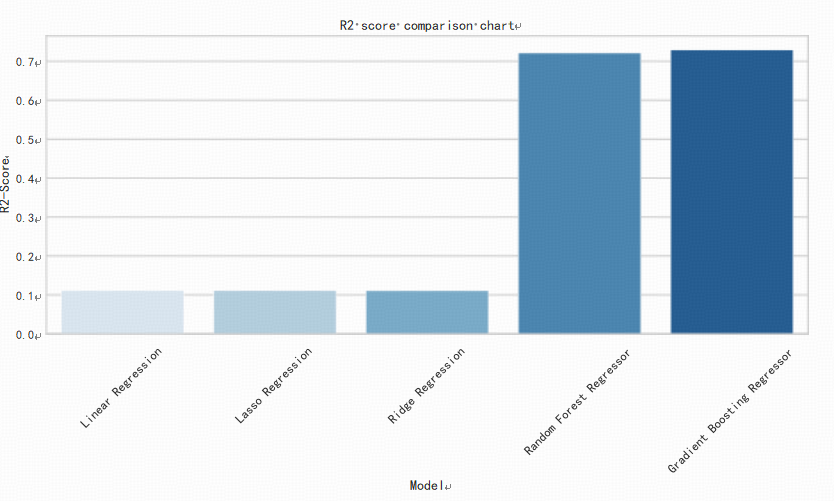
Figure 3: Model R2 Comparison Plot
As can be seen from Figure 3, the Gradient Boosted Tree and Random Forest regression models have higher prediction accuracies of more than 0.7, while the ordinary linear regression model predicts very low R2 values. Then this obtained the Mean Absolute Error (MAE), Mean Square Error (MSE) for each model, as shown in Table 2:
Table 2: Model Evaluation Metrics
Model | MSE | R2 | MAE |
Linear Regression | 6.854618e+08 | 0.110233 | 11221.783369 |
Lasso Regression | 6.854657e+08 | 0.110228 | 11221.817042 |
Ridge Regression | 6.856549e+08 | 0.109982 | 11231.336882 |
Random Forest Regressor | 2.152022e+08 | 0.720656 | 4525.142344 |
Gradient Boosting Regressor | 2.089770e+08 | 0.728736 | 5264.387263 |
The formulae for the R2, MSE and MAE indicators are shown below:
\( \begin{cases}\begin{matrix}{R^{2}}=1-\frac{S{S_{residual}}}{S{S_{total}}}=1-\frac{\sum _{i}^{}{({\hat{y}^{(i)}}-{y^{(i)}})^{2}}}{\sum _{i}^{}{(\overline{y}-{y^{(i)}})^{2}}} & ({R^{2}}≤1) \\ MSE=\frac{1}{m}\sum _{i=1}^{m}{({y_{i}}-{\hat{y}_{i}})^{2}} & \\ MAE=\frac{1}{m}\sum _{i=1}^{m}|{y_{i}}-{\hat{y}_{i}}| & \\ \end{matrix}\end{cases} \)
It can be observed that the Gradient Boosting Tree model demonstrates a relatively good performance, with an R2 value of 0.728, a Mean Squared Error (MSE) of 2.089, and a Mean Absolute Error (MAE) of 5264. .Next, we use the Gradient Boosting Tree model for modeling, and this output the feature importance to analyze the extent of the influence of different features on the sales of health tea [10]. As depicted in Figure 4, the pre-coupon price that has the highest degree of influence on the commodity, which indicates that the original price of the commodity has a significant impact on the consumer’s purchasing decision. Price is often the most direct and important consideration for consumers when contemplating the purchase of a commodity. A high price may hinder purchase intention, while a reasonable pricing strategy can attract more consumers. Next in line is the post-coupon price, which represents the price that consumers actually pay after applying a coupon. The importance of this factor suggests that promotions and discounts have a direct positive impact on sales. Consumers show a higher willingness to buy goods that they can get a good deal on, therefore, coupons and discounts are effective sales promotion tools. Geographic regions, especially provinces in South China, ranked third in terms of their influence on sales. This may reflect the influence of geographic culture, consumption habits, or economic level on consumer purchasing behavior. South China may possess specific market needs or consumer preferences that require further market segmentation and targeted marketing strategies. The influence of GDP per capita is the lowest, which may suggest that macroeconomic indicators have less direct influence on individual buying behavior in the current data analysis. This might be due to the fact that consumers' purchasing decisions are driven more by direct factors such as price and promotions rather than macroeconomic conditions.
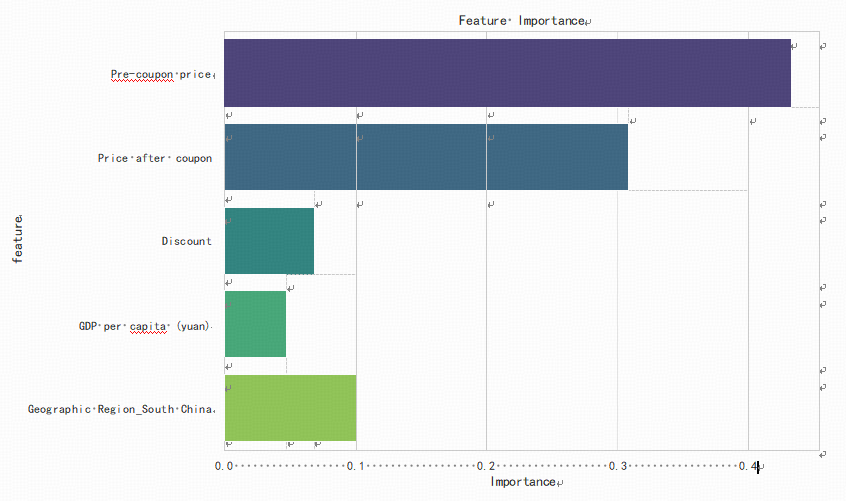
Figure 4: Features Importance
3.3. Summary of the analysis of factors influencing the purchase of health tea
Through a comprehensive analysis of the significance of various characteristics, it has been determined that the price factor, specifically the pre-coupon price and post-coupon price, emerges as the most crucial determinant influencing sales volume. In addition, geographic differences also have an impact on sales, which suggests that we must consider geographic characteristics and consumer preferences when formulating marketing strategies. Although macroeconomic indicators such as per capita GDP have a relatively small impact on sales, this implies that consumers’ purchasing decisions are more influenced by micro-level factors. Collectively, these findings suggest that firms should place particular emphasis on pricing strategies and promotional activities in order to increase sales, and adjust their marketing strategies according to geographical differences. At the same time, despite the relatively low influence of macroeconomic factors, companies need to keep an eye on economic trends in order to be able to respond in a timely manner when the market undergoes changes.
4. Conclusion
This paper analyzes sales data from the Chinese wellness tea market, revealing that price factors—especially pre- and post-coupon prices—and promotional activities significantly impact sales volume. Enterprises are advised to frequently offer discounts, particularly in the RMB 20-40 price range, to boost consumer purchases. Geographic differences, notably in South China, should influence marketing strategies, encouraging localized and differentiated approaches. Although GDP per capita has a minor effect on sales, monitoring economic trends remains important. Companies should leverage data analysis for decision-making, optimizing sales forecasting models to enhance inventory and supply chain efficiency. Further research into consumer behavior is essential for better meeting market demand. Policy support and market regulation are also crucial for industry health. The study’s limitations include its focus on Taobao data, which may not fully represent the broader market, and prediction accuracy constrained by data quality and feature engineering. Future research aims to expand data sources, deepen feature engineering, explore additional influencing factors, and improve model generalization to provide more accurate insights for sustainable industry growth.
References
[1]. Montgomery D C, Peck E A, Vining G G. Introduction to linear regression analysis[M]. John Wiley & Sons, 2021.
[2]. Tranmer M, Elliot M. Multiple linear regression[J]. The Cathie Marsh Centre for Census and Survey Research (CCSR), 2008, 5(5):1-5.
[3]. Zhang L, WeiX, LuJ, et al. Lasso regression: From explanation to prediction[J]. Advances in Psychological Science, 2020, 28(10):1777.
[4]. Marill K A. Advanced statistics: linear regression, part ii: multiple linear regression[J]. Academic emergency medicine, 2004, 11(1):94-102.
[5]. Dong G, Liu H. Feature engineering for machine learning and data analytics[M]. CRC press, 2018.
[6]. Ranstam J, Cook J A. Lasso regression[J]. Journal of British Surgery, 2018, 105(10): 1348-1348.
[7]. ArashiM, RoozbehM, HamzahN A, et al. Ridge regression and its applications in genetic studies[J]. Plos one, 2021, 16(4):e0245376.
[8]. Segal M R. Machine learning benchmarks and random forest regression[J]. 2004.
[9]. Prettenhofer P, Louppe G. Gradient boosted regression trees in scikit-learn[C]//PyData 2014. 2014.
[10]. Zien A, Krämer N, Sonnenburg S, et al. The feature importance ranking measure[C]// Machine Learning and Knowledge Discovery in Databases: European Conference, ECML PKDD 2009, Bled, Slovenia, September 7-11, 2009, Proceedings, Part II 20. Springer, 2009: 694-709.
Cite this article
Ding,Y. (2025). To Study the Dynamics of Demand and Consumption Patterns of Wellness Tea in Different Provinces of China. Lecture Notes in Education Psychology and Public Media,81,79-85.
Data availability
The datasets used and/or analyzed during the current study will be available from the authors upon reasonable request.
Disclaimer/Publisher's Note
The statements, opinions and data contained in all publications are solely those of the individual author(s) and contributor(s) and not of EWA Publishing and/or the editor(s). EWA Publishing and/or the editor(s) disclaim responsibility for any injury to people or property resulting from any ideas, methods, instructions or products referred to in the content.
About volume
Volume title: Proceedings of the 3rd International Conference on Social Psychology and Humanity Studies
© 2024 by the author(s). Licensee EWA Publishing, Oxford, UK. This article is an open access article distributed under the terms and
conditions of the Creative Commons Attribution (CC BY) license. Authors who
publish this series agree to the following terms:
1. Authors retain copyright and grant the series right of first publication with the work simultaneously licensed under a Creative Commons
Attribution License that allows others to share the work with an acknowledgment of the work's authorship and initial publication in this
series.
2. Authors are able to enter into separate, additional contractual arrangements for the non-exclusive distribution of the series's published
version of the work (e.g., post it to an institutional repository or publish it in a book), with an acknowledgment of its initial
publication in this series.
3. Authors are permitted and encouraged to post their work online (e.g., in institutional repositories or on their website) prior to and
during the submission process, as it can lead to productive exchanges, as well as earlier and greater citation of published work (See
Open access policy for details).
References
[1]. Montgomery D C, Peck E A, Vining G G. Introduction to linear regression analysis[M]. John Wiley & Sons, 2021.
[2]. Tranmer M, Elliot M. Multiple linear regression[J]. The Cathie Marsh Centre for Census and Survey Research (CCSR), 2008, 5(5):1-5.
[3]. Zhang L, WeiX, LuJ, et al. Lasso regression: From explanation to prediction[J]. Advances in Psychological Science, 2020, 28(10):1777.
[4]. Marill K A. Advanced statistics: linear regression, part ii: multiple linear regression[J]. Academic emergency medicine, 2004, 11(1):94-102.
[5]. Dong G, Liu H. Feature engineering for machine learning and data analytics[M]. CRC press, 2018.
[6]. Ranstam J, Cook J A. Lasso regression[J]. Journal of British Surgery, 2018, 105(10): 1348-1348.
[7]. ArashiM, RoozbehM, HamzahN A, et al. Ridge regression and its applications in genetic studies[J]. Plos one, 2021, 16(4):e0245376.
[8]. Segal M R. Machine learning benchmarks and random forest regression[J]. 2004.
[9]. Prettenhofer P, Louppe G. Gradient boosted regression trees in scikit-learn[C]//PyData 2014. 2014.
[10]. Zien A, Krämer N, Sonnenburg S, et al. The feature importance ranking measure[C]// Machine Learning and Knowledge Discovery in Databases: European Conference, ECML PKDD 2009, Bled, Slovenia, September 7-11, 2009, Proceedings, Part II 20. Springer, 2009: 694-709.