


1. Introduction
The global economic landscape is experiencing unprecedented changes, with rapid advancements in economy and technology leading to frequent fluctuations in the housing price index. Several factors, including regional demand variations and policy differences, contribute to the unpredictability of these fluctuations. A stable price index environment is crucial for the health of the market economy, making it vital to comprehend the trends and determinants of price index volatility to make informed decisions. This knowledge is increasingly sought after across various sectors.
Given that real estate plays a fundamental role in economic growth, shifts in the real estate value index significantly impact the national economy and reflect on living standards. Research by He et al. highlighted that workforce costs, interest rates, and geographic locations substantially influence China’s real estate market prices [1]. Furthermore, Zhao et al. noted that local regulations affect real estate values, suggesting the need for local governments to adopt appropriate and scientific approaches to real estate management [2]. Real estate prices are also influenced by other factors, as shown by Markus Baldauf et al., who demonstrated how housing prices vary in response to climate risks. They linked pricing to predictions of individual home flooding risks and climate change sentiments, revealing varied opinions on climate change’s long-term effects on housing prices [3]. The aim of exploring the relationship between these diverse variables and prices is to enhance the accuracy and logical consistency of price forecasts.
In their research, numerous scholars employ different models to predict prices. Pai et al. compared four machine learning models-least squares support vector regression (LSSVR), classification and regression tree (CART), general regression neural network (GRNN), and back propagation neural network (BPNN)-for forecasting real estate prices, finding that LSSVR had the lowest mean absolute percentage error (MAPE), making it a promising forecasting technique [4]. Mawuli et al. introduced a logical smooth transition autoregressive fractional integration process for modeling and forecasting US house price volatility, showing that incorporating Markov switched multifractal (MSM) and the FIGARCH framework could enhance predictive accuracy [5].
Additionally, some researchers focus on analyzing large datasets to forecast real estate values. Archana et al. collected extensive data, including home sales from 2006 to 2010 in Ames, Iowa, to develop models for predicting home final sale prices [6, 7]. Similarly, Wang et al. applied a housing characteristic price model in Shenzhen, using 100 housing samples to prove the model’s effectiveness, providing valuable insights for developers, consumers, and policy assessment [8].
This article aims to analyze the factors influencing the real estate price index using multiple linear regression models, offering recommendations for investors and government decision-making based on the findings. The growing interest in housing price index data among scholars underlines the importance of such studies in addressing current challenges in real estate markets.
2. Methodology
2.1. Data source
The data is taken from Factors influencing US houses from Kaggle. This data is a US housing price index calculated in US dollars, with a total of 241 observations from January 2003 to December 2022.
2.2. Variable selection
House price indexes are the result of changes in national economic development and government intervention, reflecting the overall trend of national development and being influenced by government and major economic events [9, 10]. The variables are listed in Table 1. The occurrence of major events is irregular and unpredictable, therefore, changes in prices can be very frequent, and difficult to determine the magnitude of the changes, as illustrated in Figure 1.
Table 1. List of variables.
Variable | Logogram | Meaning |
housing subsidies | \( {x_{1}} \) | The housing subsidy from government |
GDP | \( {x_{2}} \) | Gross National Product |
house for_sale_or_sold | \( {x_{3}} \) | The number of discounted rooms |
Unemployment Rate | \( {x_{4}} \) | National unemployment rate |
Income | \( {x_{5}} \) | National income of individuals |
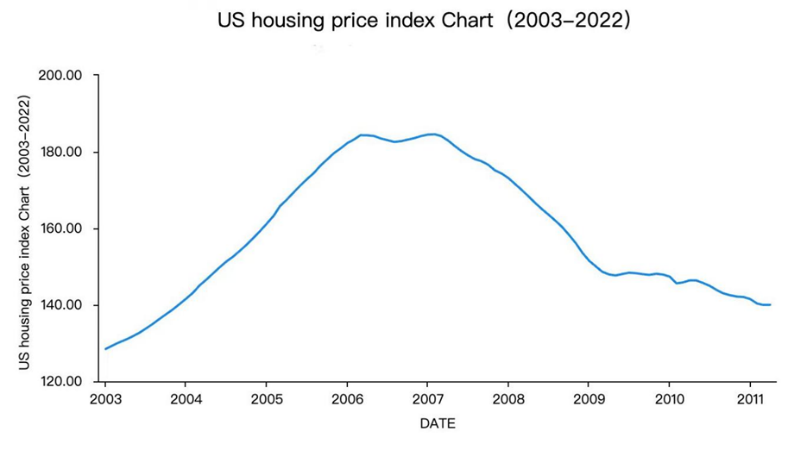
Figure 1. The trend of housing price index.
From Figure 1, it can be concluded that from January 2003 to March 2007, house price index had entered an upward phase, and then experienced a decrease trend from April 2007 to February 2012. It has almost fallen to a level as low as nine years ago. This can be seen as a microcosm of the 2007 subprime mortgage crisis. Afterward, the house price index showed a stable upward trend until August 2022. From August 2022 to December 2022, the house price index showed a stable downward trend.
3. Results and discussion
3.1. Data processing
We obtained a US housing price index dataset from Kaggle from January 2003 to December 2022, which includes fields such as housing subsidies, building_permits, const_priceIndex, GDP, house for_sale_or_sold, income, interest_rate, total_houses, and housing price index. To ensure that all features are on the same scale, we standardized the housing area. We have also integrated other data from real estate companies, such as total_const_spending, urban_population, unemployment_rate, and so on, to enrich our dataset and include more detailed housing information. We then conducted a consistency check to ensure that the relationship between housing price index and housing area is reasonable. Finally, we will store the processed data in an Excel file for further analysis and modeling purposes.
3.2. Correlation analysis
The analysis in this paper shows that there are many factors Influencing Housing Price index. As the table 2 shows:
Table 2. Correlation results.
Variable | Coefficient | p-value |
Income | 0.830** | <0.01 |
Housing Subsidies | 0.956** | <0.01 |
Unemployment Rate | 0.047 | >0.05 |
House for Sale or Sold | 0.478** | <0.01 |
The analysis of the Pearson correlation coefficient between various factors and housing prices reveals significant relationships. Specifically, a correlation analysis was used to study the connection between DATE and five variables: income, housing subsidies, unemployment rate, houses for sale or sold, and total houses. Income and DATE have a strong positive correlation of 0.830, signifying a substantial positive relationship. Housing subsidies and DATE are even more closely linked, with a correlation coefficient of 0.956, pointing to a significant positive relationship.
There’s an insignificant correlation between the unemployment rate and DATE, with a coefficient of 0.047 and a p-value of 0.656, indicating no meaningful relationship. The relationship between houses for sale or sold and DATE is moderately positive, with a correlation coefficient of 0.478.
The total number of houses and DATE have a very strong positive correlation, with a coefficient of 0.967, suggesting a significant positive correlation. In summary, the analysis highlights the strong positive correlations between DATE and income, housing subsidies, houses for sale or sold, and total houses, with the unemployment rate showing no significant correlation.
3.3. Multiple linear regression
From all the above, what affect the housing prices are comprehensive. People nowadays are longing for a perfect house from many different angles. After analyzing the Pearson correlation matrix of various factors, multiple regression analysis was conducted (Table 3). The general mathematical model for multiple linear regression is:
\( E(Y)={β_{0}}+{β_{1}}{x_{1}}+{β_{2}}{x_{2}}+⋯+{β_{13}}{x_{12}}+e \ \ \ (1) \)
In the above formula: \( {β_{0}} \) is a constant term, and \( e \) is a residual term.
Table 3. Linear model results.
Variable | Coefficient | Standard Error | Beta | t-value | p-value |
Constant | 5.169 | 33.411 | - | 0.155 | 0.877 |
Income | 0.290 | 1.071 | 0.343 | 0.271 | 0.786 |
Housing Subsidies | 2.392 | 0.042 | 0.465 | 56.971 | 0.001** |
House for Sale or Sold | 0.249 | 0.988 | 0.760 | 0.252 | 0.801 |
Unemployment Rate | -6.771 | 0.133 | -0.072 | -7.848 | 0.000** |
GDP | 0.075 | 0.004 | 0.627 | 18.369 | 0.001** |
In the presented model, the linear regression analysis formula includes independent variables such as housing_subsidies, house-for-sale-or_sold, unemployment-rate, const_price Index, and GDP, with home_price Index serving as the dependent variable. The model equation is expressed as follows:
\( hom{e_{pric{e_{index}}}}=-159.390 + 2.392*housin{g_{subsidies}}+…+ 0.016*GDP \ \ \ (2) \)
The R2 value of 0.879 indicates that approximately 87.9% of the variation in home_price Index can be explained by the factors of housing_subsidies, house-for-sale-or_sold, unemployment_rate, const_price Index, and GDP. An F-test on the model reveals that it passes successfully (F=137.018, p=0.000<0.05), suggesting that at least one of the factors among housing_subsidies, house-for-sale-or_sold, unemployment-rate, const_price Index, and GDP significantly influences home_price Index.
Furthermore, a test for multicollinearity in the model reveals that a VIF value exceeding 10 indicates collinearity issues. To address this, Ridge regression or stepwise regression can be employed, and close examination of highly correlated independent variables is recommended for elimination and reanalysis.
The detailed analysis on the impact of various factors on the home_price Index reveals significant findings. Housing subsidies possess a noticeable positive effect on the home_price Index with a regression coefficient of 2.392, verified by significant statistics (t=2.234, p=0.028). Similarly, the number of houses for sale or already sold significantly enhances the home_price Index, as demonstrated by its regression coefficient of 0.249 and strong statistical support (t=5.959, p<0.01). GDP also significantly boosts the home_price Index, with a regression coefficient of 0.016, further supported by solid statistics (t=4.579, p<0.01). On the contrary, the unemployment rate adversely affects the home_price Index, indicated by a regression coefficient of -6.771 and equally significant statistics (t=-6.856, p<0.01). The construction price index, however, shows no significant correlation with the home_price Index, as its effects are statistically insignificant (regression coefficient of 0.075, t=0.563, p=0.575). In summary, housing subsidies, the house-for-sale_or_sold status, and GDP positively influence the home_price Index, whereas the unemployment rate negatively impacts it. Nonetheless, the construction price index appears to have no significant effect.
4. Conclusion
The study selected 241 samples from the dataset from January 2003 to December 2022, including 5 variables. Its method (multiple linear regression analysis) is accurate, effective, and comprehensive. This is because it conducts multiple factor analysis and obtains the Pearson correlation coefficients for each variable.
In the analysis phase, this article uses a multiple linear regression model to identify possible relationships between variables and housing prices. To gain more information, this study considered exploratory factors and added interaction terms with coefficients to the equation. Therefore, the factors that have a positive impact on housing prices are income, housing subsidies, houses for sale or sale, and total houses. The unemployment rate has little to do with US housing prices. From these factors, income, housing subsidies, houses for sale or sale, and total houses are the main factors.
Through research, people can have a reference for their dream house from different perspectives, thus having an overall determination of housing price budget. However, there are still some shortcomings, such as the inability to find causal relationships between variables, relatively small sample sizes, and the fact that the data is not the latest version. To improve this, search for new data and use the control variable method to identify possible causal relationships between housing prices and factors. The reference factors provided in this article will have different impacts due to regional changes and personal preferences, and specific analysis is needed in real situations.
Authors Contribution
All the authors contributed equally and their names were listed in alphabetical order.
References
[1]. He H M, et al. 2021 Data Analysis on the Influencing Factors of the Real Estate Price. Artificial Intelligence Evolution, 2(2), 52-66.
[2]. Zhao S, Li W, Zhao K and Zhang P 2021 Change Characteristics and Multilevel Influencing Factors of Real Estate Inventory-Case Studies from 35 Key Cities in China. Land, 10, 928.
[3]. Baldauf M, et al. 2020 Does Climate Change Affect Real Estate Prices? Only If You Believe In It. The Review of Financial Studies, 33(3), 1256-1295.
[4]. Segnon M, Gupta R, Lesame K, et al. 2021 High-Frequency Volatility Forecasting of US Housing Markets. Journal of Real Estate Finance and Economics, 62, 283-317.
[5]. Singh A, Sharma A and Dubey G 2020 Big data analytics predicting real estate prices. International Journal of Systems Assurance Engineering and Management, 11, 208-219.
[6]. Lisheng S, Yu D, Xiaoyan Y, et al. 2018 Research on Influencing Factors of Commodity Housing Price Based on Hedonic Price Model-Taking Yinchuan as An Example. Journal of Ningxia University (Natural Science Edition).
[7]. Dong W, et al. 2008 An External Influencing Factors Analysis and Experiential Research of Housing Price in Shenzhen. In International conference on construction & real estate management.
[8]. Sun D 2000 Selection of the Linear Regression Model According to the Parameter Estimation. Wuhan University Journal of Natural Sciences, 5(4), 400-405.
[9]. Gao Y, et al. 2022 Spatial Differentiation of Housing Prices in Shanghai’s Tourism Accommodation Industry and Its Influencing Factors. Geographic Science, 42(8), 11.
[10]. Wang C Y and Zhang Z Y 2023 The Impact of Urban Public Service Configuration on Housing Prices: A Case Study of Chongqing. Journal of Chongqing Jiaotong University (Social Science Edition), 23(6), 58-67.
Cite this article
Yu,J.;Zhan,M. (2024). Research on factors influencing housing price index-take the USA as an example. Theoretical and Natural Science,38,101-105.
Data availability
The datasets used and/or analyzed during the current study will be available from the authors upon reasonable request.
Disclaimer/Publisher's Note
The statements, opinions and data contained in all publications are solely those of the individual author(s) and contributor(s) and not of EWA Publishing and/or the editor(s). EWA Publishing and/or the editor(s) disclaim responsibility for any injury to people or property resulting from any ideas, methods, instructions or products referred to in the content.
About volume
Volume title: Proceedings of the 2nd International Conference on Mathematical Physics and Computational Simulation
© 2024 by the author(s). Licensee EWA Publishing, Oxford, UK. This article is an open access article distributed under the terms and
conditions of the Creative Commons Attribution (CC BY) license. Authors who
publish this series agree to the following terms:
1. Authors retain copyright and grant the series right of first publication with the work simultaneously licensed under a Creative Commons
Attribution License that allows others to share the work with an acknowledgment of the work's authorship and initial publication in this
series.
2. Authors are able to enter into separate, additional contractual arrangements for the non-exclusive distribution of the series's published
version of the work (e.g., post it to an institutional repository or publish it in a book), with an acknowledgment of its initial
publication in this series.
3. Authors are permitted and encouraged to post their work online (e.g., in institutional repositories or on their website) prior to and
during the submission process, as it can lead to productive exchanges, as well as earlier and greater citation of published work (See
Open access policy for details).
References
[1]. He H M, et al. 2021 Data Analysis on the Influencing Factors of the Real Estate Price. Artificial Intelligence Evolution, 2(2), 52-66.
[2]. Zhao S, Li W, Zhao K and Zhang P 2021 Change Characteristics and Multilevel Influencing Factors of Real Estate Inventory-Case Studies from 35 Key Cities in China. Land, 10, 928.
[3]. Baldauf M, et al. 2020 Does Climate Change Affect Real Estate Prices? Only If You Believe In It. The Review of Financial Studies, 33(3), 1256-1295.
[4]. Segnon M, Gupta R, Lesame K, et al. 2021 High-Frequency Volatility Forecasting of US Housing Markets. Journal of Real Estate Finance and Economics, 62, 283-317.
[5]. Singh A, Sharma A and Dubey G 2020 Big data analytics predicting real estate prices. International Journal of Systems Assurance Engineering and Management, 11, 208-219.
[6]. Lisheng S, Yu D, Xiaoyan Y, et al. 2018 Research on Influencing Factors of Commodity Housing Price Based on Hedonic Price Model-Taking Yinchuan as An Example. Journal of Ningxia University (Natural Science Edition).
[7]. Dong W, et al. 2008 An External Influencing Factors Analysis and Experiential Research of Housing Price in Shenzhen. In International conference on construction & real estate management.
[8]. Sun D 2000 Selection of the Linear Regression Model According to the Parameter Estimation. Wuhan University Journal of Natural Sciences, 5(4), 400-405.
[9]. Gao Y, et al. 2022 Spatial Differentiation of Housing Prices in Shanghai’s Tourism Accommodation Industry and Its Influencing Factors. Geographic Science, 42(8), 11.
[10]. Wang C Y and Zhang Z Y 2023 The Impact of Urban Public Service Configuration on Housing Prices: A Case Study of Chongqing. Journal of Chongqing Jiaotong University (Social Science Edition), 23(6), 58-67.