1. Introduction
In the study of the influencing factors of housing prices, scholars have proposed a variety of theoretical models and empirical analysis methods. The purpose of this literature review is to discuss the research results on commodity prices, especially the influencing factors of housing prices, at home and abroad in recent years. The research of domestic and foreign scholars on the influencing factors of housing prices mainly focuses on the following aspects:
First of all, in the relationship between supply and demand, from the perspective of demand, the influencing factors of housing prices mainly include GDP, residents’ income level, population, etc. Adams established an error correction model and concluded that long-term interest rates, GDP, and housing construction costs all have a significant effect on real estate prices, and long-term interest rates have a negative impact on housing prices, while construction costs and GDP have a positive impact on real estate prices [1]. Holly found that house price changes coincided with household income, and that when household income increased by 1%, house prices rose by the same proportion [2]. Some scholars have also studied the impact of income distribution on housing prices, and believe that the widening income distribution gap is an important reason for the rise in housing prices [3]. Maennig conducted a study of the real estate market in Germany from a demographic perspective and concluded that the impact of population increases and decreases on housing prices is not completely significant, and that when the population increases, housing prices are not affected, and when the population decreases, housing prices are pulled down [4]. From the perspective of supply, land price, real estate construction cost, and real estate investment are several major factors affecting housing prices, and land prices are considered to be the key influencing factors for housing prices [5, 6]. Saiz and Rubin used elasticity theory to study the relationship between land supply and housing prices, arguing that the inelasticity of land supply is the key factor causing housing prices to rise [7, 8].
For example, Chen et al. pointed out that there is a significant relationship between local economic indicators such as regional GDP, regional per capita income, real estate investment scale and development activity, and local housing prices. In addition, factors such as land prices, construction costs. By reducing the supply of housing, which would raise rents and ultimately drive up house prices, higher construction costs would, on average, have a 0.6% long-term impact on house prices, according to research by Zeno and Roland using 30 years of data from 15 countries [9]. Scholar Zhao established a panel data model to reflect the impact of regional housing prices at different consumption levels, in addition to construction costs. The results indicated that land prices only significantly affected housing prices in areas with higher consumption levels [10].
In general, the influencing factors of housing prices are a multi-dimensional and complex economic phenomenon, involving multiple levels such as economy, society, and policy. In China’s specific socio-economic environment, panel data analysis of each provincial unit can reveal the close relationship between housing prices and regional economic development, financial conditions, and government policies. Through these studies, people can not only better understand the internal mechanism of housing price changes, but also provide theoretical basis and practical guidance for the government to regulate the real estate market and prevent price bubbles.
2. Methodology
2.1. Data sources and description
In this paper, provincial panel data of 31 provinces, municipalities and autonomous regions (excluding Hong Kong, Macao and Taiwan) from 2014 to 2022 are selected as research samples, and the data mainly come from the National Bureau of Statistics. The sales PRICE of commercial housing in each region is selected as the explained variable and expressed by price. Gross regional product (GDP), construction AREA of real estate development enterprises and investment amount of real estate development are taken as explanatory variables, expressed by GDP, area and INVEST respectively.
2.2. Indicator selection and description
The data used include the following parts (Table 1): (1) the sales price of commercial housing in the region; (2) Gross regional product; (3) the construction area of the real estate development enterprise; (4) Investment in real estate development, etc. The data dimension covers the provincial administrative units of 31 provinces, cities and autonomous regions (excluding Hong Kong, Macao and Taiwan) in China from 2014 to 2022.
Table 1. Indicator selection and description.
Variable Name | Data Source | Description |
Sales price of regional commercial housing | National Bureau of Statistics, regional data | This variable represents the average sales price of commercial housing in the region. The data is obtained from the National Bureau of Statistics, specifically from the fixed asset investment and the average sales price of real estate by use in the index module. |
Gross regional Product | National Bureau of Statistics, regional data | This variable represents the total economic output of the region. The data is derived from the National Bureau of Statistics, specifically from the indicator module of the gross regional product in the national economic accounts of the annual data of the provinces. |
Construction housing area of real estate development enterprises | National Bureau of Statistics, regional data | This variable represents the total construction area of housing by real estate development enterprises in the region. The data is sourced from the National Bureau of Statistics, specifically from the provincial annual data of fixed asset investment and real estate in the real estate development enterprises housing construction area and the index module of fraud. |
Real estate development investment | National Bureau of Statistics, regional data | This variable represents the total investment in real estate development in the region. The data is obtained from the National Bureau of Statistics, specifically from the provincial annual data of fixed asset investment and the index module of real estate development enterprises completed investment by purpose. |
2.3. Method introduction
Panel data analysis is used to explore the impact of gross regional product, construction area of real estate development enterprises and real estate development investment on housing prices. The model design is as follows:
\( {price_{it}}={β_{0}}+{β_{1}}*{gdp_{it}}+{β_{2}}*{area_{it}}+{β_{3}}*{invest_{it}}+{ε_{it}} \ \ \ (1) \)
where  \( {price_{it}} \) is the housing price of the i province and autonomous region in the t year, \( {gdp_{it}} \) is the gross regional product of the i province and autonomous region in the t year, \( {area_{it}} \) is the construction area of real estate development enterprises in the i province and autonomous region in the t year, \( {invest_{it}} \) is the investment amount of real estate development in the i province and autonomous region in the t year.
3. Results and discussion
3.1. Descriptive analysis
From the average point of view, the average sales price of commercial housing has risen year by year from 6,585.9 yuan/square meter in 2014 to 10,707.9 yuan/square meter in 2022. This shows that in the past nine years, the average sales price of commercial housing in China has shown an overall upward trend. The standard deviation can be used to observe price fluctuations. It gradually increased from 3,474.9 in 2014 to 8,369.6 in 2022, indicating that price differentials and volatility ranges have increased over time (Table 2).
Table 2. Table of descriptive statistics.
year | count | mean | std | min | 25% | 50% | 75% | max |
2022 | 31 | 10707.9 | 8369.6 | 5473.0 | 6542.5 | 7637.0 | 10327.5 | 40302 |
2021 | 31 | 10984.7 | 8147.2 | 5740.0 | 6614.5 | 7885.0 | 10756.0 | 40526 |
2020 | 31 | 10759.3 | 7391.1 | 5807.0 | 6848.5 | 8173.0 | 10588.0 | 37665 |
2019 | 31 | 10187.9 | 6835.6 | 5685.0 | 6700.5 | 7643.0 | 9880.0 | 35905 |
2018 | 31 | 9563.8 | 6344.7 | 5043.6 | 6315.3 | 7201.6 | 9542.2 | 34143 |
2017 | 31 | 8536.4 | 5891.9 | 4544.0 | 5771.5 | 6375.0 | 8435.0 | 32140 |
2016 | 31 | 7672.0 | 5410.4 | 4241.0 | 5156.5 | 5485.0 | 7764.5 | 27497 |
2015 | 31 | 6984.4 | 4352.7 | 4111.0 | 4891.5 | 5457.0 | 6609.5 | 22633 |
2014 | 31 | 6585.9 | 3474.9 | 4117.0 | 4794.0 | 5288.0 | 6390.0 | 18833 |
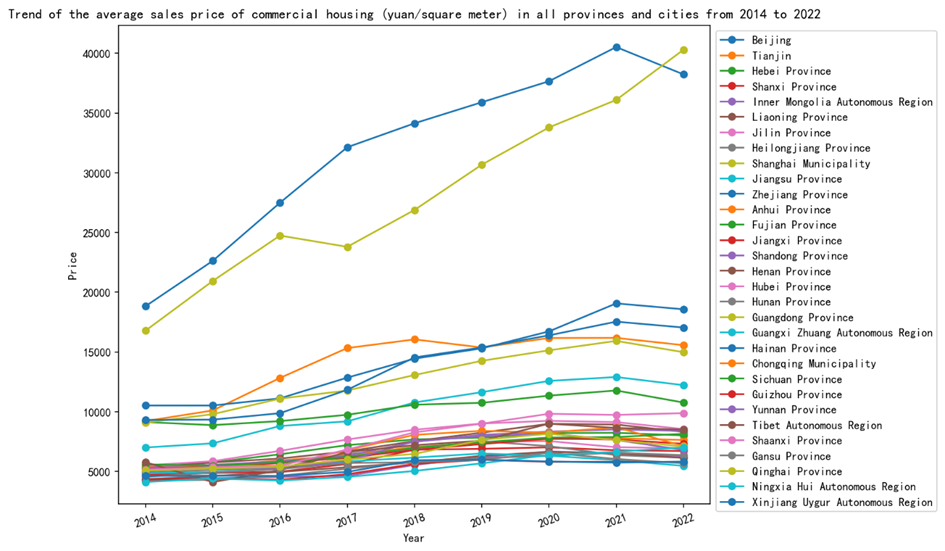
Figure 1. Trend of the average sales price of commercial housing (yuan/square meter) in all provinces and cities from 2014 to 2022.
It was observed that the minimum value increased from 4,117 yuan/square meter in 2014 to 5,473 yuan/square meter in 2022, while the maximum value increased significantly from 18,833 yuan/square meter to 40,302 yuan/square meter (Figure 1). This change reflects the overall price improvement of the market, but also indicates a significant increase in the price of the high-end property market. The increase in the first quartile (25 per cent) and third quartile (75 per cent) shows that both the lower and upper end of the price distribution are rising, but the upper end is growing faster, which may mean that higher priced properties are growing faster than lower priced properties. The median has steadily increased from 5,288 yuan/m2 in 2014 to 7,637 yuan/m2 in 2022 (Table 3).
Table 3. Table of descriptive statistics.
year | count | mean | std | min | 25% | 50% | 75% | max |
2022 | 31 | 29164.3 | 21460.7 | 697.6 | 12800.8 | 25350.5 | 36643.1 | 88662.7 |
2021 | 31 | 31464.1 | 23168.7 | 945.4 | 13626.4 | 26893.2 | 40201.1 | 94247.5 |
2020 | 31 | 29895.5 | 22461.2 | 945.3 | 13129.6 | 25801.3 | 38088.4 | 91642.4 |
2019 | 31 | 28832.9 | 21278.8 | 764.2 | 12459.4 | 26314.1 | 37092.7 | 86824.9 |
2018 | 31 | 26525.8 | 19664.2 | 358.6 | 11827.1 | 21953.3 | 34303.8 | 79935.1 |
2017 | 31 | 25209.2 | 17957.3 | 229.9 | 11742.3 | 21085.4 | 31815.4 | 72492.1 |
2016 | 31 | 24483.1 | 16755.5 | 348.8 | 11664.0 | 20593.2 | 30770.5 | 64233.8 |
2015 | 31 | 23732.0 | 15699.9 | 380.6 | 11988.4 | 20722.2 | 30663.0 | 58118.4 |
2014 | 31 | 23434.9 | 15299.7 | 273.2 | 12800.5 | 19466.1 | 32553.8 | 57637.7 |
3.2. Construction Statistics of Real Estate Development
Observing the average value, it can be seen that the construction area fluctuates year by year from the average value of 23,434.91 in 2014 to the average value of 29,164.25 in 2022, indicating that the overall construction area shows an increasing trend, although this increase does not occur continuously every year (Figure 2). Through the observation of standard deviation, from 15299.75 in 2014 to 21460.71 in 2022, it shows that the fluctuation range of construction housing area is increasing on the whole, which indicates that the difference of construction area between different regions is expanding year by year.
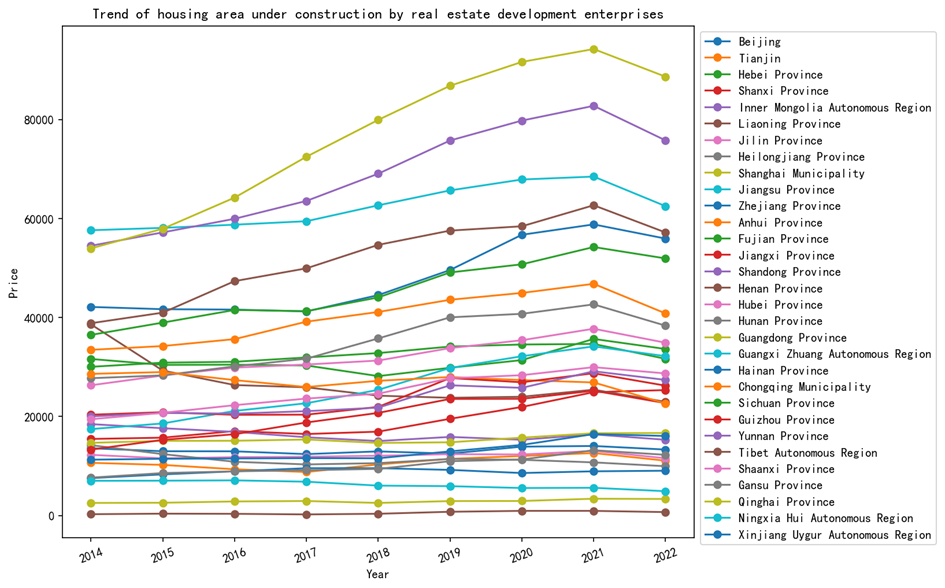
Figure 2. Trend of housing area under construction by real estate development enterprises
The minimum value increased from 273.17 in 2014 to 697.56 in 2022, while the maximum value increased significantly from 57,637.72 in 2014 to 88,662.69 in 2022, indicating that the maximum project size under construction increased significantly during this period, while the minimum project size also increased (Table 4). Changes in the quartile reveal changes in the data distribution. As can be seen from the data, whether it is 25%, 50% (median), or 75% quantile, there is a trend of overall growth, although this growth is not uniform. This means that not only the largest construction projects, but also the construction area of small and medium-sized projects is increasing (Figure 3).
Table 4. Table of descriptive statistics.
year | count | mean | std | min | 25% | 50% | 75% | max |
2022 | 31 | 29164.3 | 21460.7 | 697.6 | 12800.8 | 25350.5 | 36643.1 | 88662.7 |
2021 | 31 | 31464.1 | 23168.7 | 945.4 | 13626.4 | 26893.2 | 40201.1 | 94247.5 |
2020 | 31 | 29895.5 | 22461.2 | 945.3 | 13129.6 | 25801.3 | 38088.4 | 91642.4 |
2019 | 31 | 28832.9 | 21278.8 | 764.2 | 12459.4 | 26314.1 | 37092.7 | 86824.9 |
2018 | 31 | 26525.8 | 19664.2 | 358.6 | 11827.1 | 21953.3 | 34303.8 | 79935.1 |
2017 | 31 | 25209.2 | 17957.3 | 229.9 | 11742.3 | 21085.4 | 31815.4 | 72492.1 |
2016 | 31 | 24483.1 | 16755.5 | 348.8 | 11664.0 | 20593.2 | 30770.5 | 64233.8 |
2015 | 31 | 23732.0 | 15699.9 | 380.6 | 11988.4 | 20722.2 | 30663.0 | 58118.4 |
2014 | 31 | 23434.9 | 15299.7 | 273.2 | 12800.5 | 19466.1 | 32553.8 | 57637.7 |
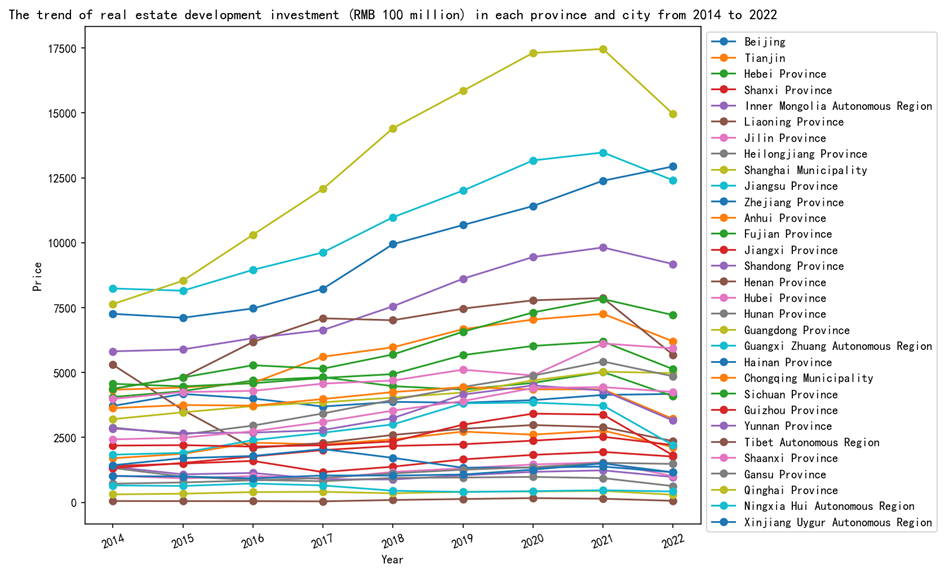
Figure 3. The trend of real estate development investment (RMB 100 million) in each province and city from 2014 to 2022
3.3. Descriptive statistics of Housing Sales Price
From 2014 to 2022, the mean and median (50% digits) of real estate development investment showed an increasing trend, although the growth was not uniform (Figure 4). This may indicate an increase in overall housing market investment activity during this period. The standard deviation of investment between years also changes, which indicates that the volatility of real estate development investment also changes with the year. In particular, both the mean and standard deviation increased significantly between 2018 and 2022, suggesting that volatility in market investment activity could increase during this period.
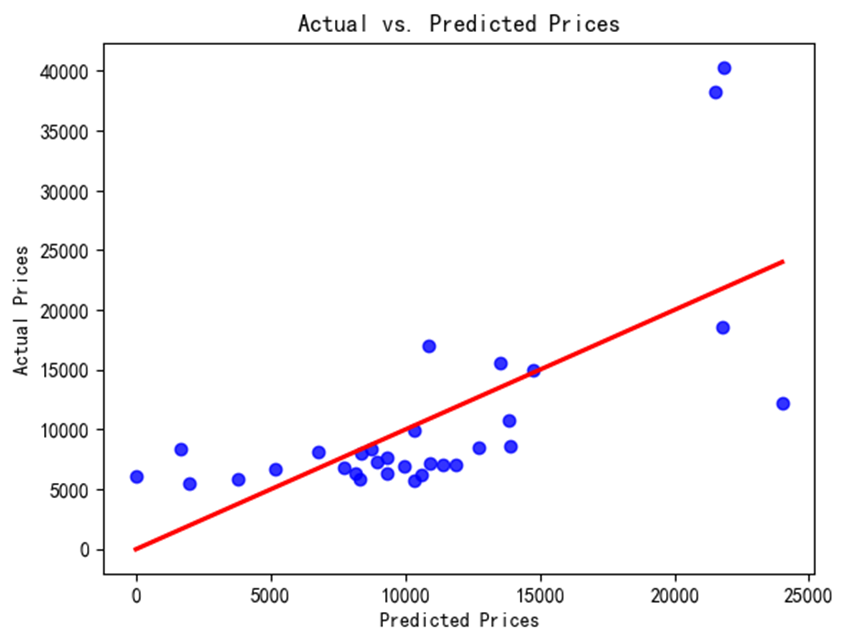
Figure 4. Figure of actual price versus predicted price.
3.4. Regression Analysis
The linear regression model has an R² value of 0.475, which means that about 47.5% of the price variation can be explained by the independent variables included in the model. This indicates that the independent variable explains the price of the dependent variable to a moderate degree, and also suggests that a significant part of the price change is not captured by the model. The adjusted R² value is slightly lower than R² at 0.416, reflecting an appropriate adjustment in the model’s explanatory power, taking into account the number of variables used in the model. As can be seen from Figure 4, the predicted house prices based on these indicators have a certain correlation with the actual prices. It can also be seen from Figure 5 that the prediction residual value remains in a small should interval, and the applicability of the regression model can also be seen (Table 5).
Table 5. Table of Regression analysis.
coef | Std err | t | P>|t| | [0.025 | 0.975] | |
const | 1.265e+04 | 2044.018 | 6.187 | 0.000 | 8452.859 | 1.68e+04 |
gdp | 0.1753 | 0.155 | 1.132 | 0.047 | -0.142 | 0.493 |
area | -0.6403 | 0.142 | -4.501 | 0.000 | -0.932 | -0.348 |
invest | 2.4167 | 1.147 | 2.107 | 0.045 | 0.063 | 4.770 |
In terms of coefficients, the constant term (12650) reflects the anticipated price baseline when all independent variables are zero. The GDP coefficient is 0.1753, which means that for every unit increase in GDP, the predicted price rises by 0.1753 units on average, assuming all other variables remain constant. However, the P-value for this coefficient is 0.047, which is greater than the conventional threshold of 0.05, indicating that GDP has a significant impact on prices at a 95% confidence level. The area coefficient is -0.6403, showing that the anticipated price reduces by 0.6403 units on average for each unit increase in area, and the P value is substantially less than 0.05, indicating a significant negative association between area and price. The coefficient of investment is 2.4167, showing that for each unit of investment increase, the price increases by an average of 2.4167 units, and its P value is 0.045, which is less than 0.05, confirming that investment has a significant positive impact on prices (Figure 5).
From a statistically significant point of view, the P-values of all variables are significantly below the standard threshold of 0.05, confirming that the relationship between these variables and prices is not due to random chance. In summary, the model demonstrates a positive correlation between GDP and investment and prices, and a negative correlation between area and prices.
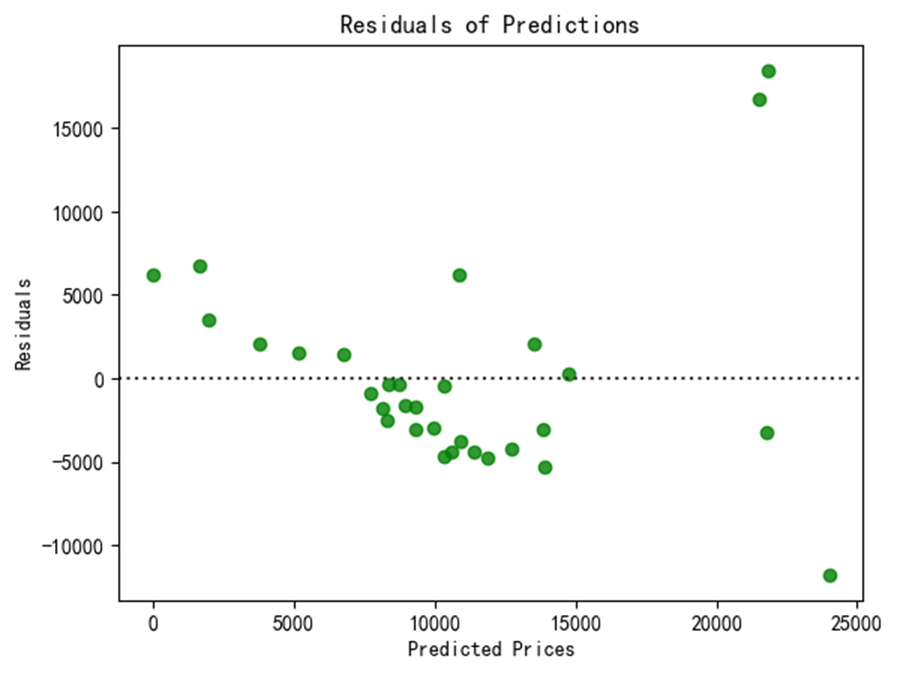
Figure 5. Residual of Predicted.
4. Conclusion
Following data analysis, the following findings are made: The variables such gross regional product, the construction area of real estate development firms, and the investment amount of real estate development are all factors affecting the housing price, as can be seen from the estimated results of the regression model. The one that most significantly affects the price of homes among them is the investment made in real estate development. Furthermore, the housing price is positively correlated with the gross regional product and the real estate development investment amount, while the housing price is negatively correlated with the construction area of real estate development enterprises, according to the coefficient of variables (Coef.).
References
[1]. Adams Z and Fuss R 2010 Macroeconomic determinants of international housing markets. Journal of Housing Economics, 19(1), 38-50.
[2]. Holly S, Pesaran M H and Yamagata T 2010 A spatio-temporal model of house prices in the USA. Journal of Econometrics, 158(1), 160-173.
[3]. Quigley J M and Raphael S 2004 Is housing unaffordable? Why isn’t it more affordable? Journal of Economic Perspectives, 18(1), 191-214.
[4]. Maennig W and Dust L 2008 Shrinking and growing metropolitan areas asymmetric real estate price reactions? The case of German single-family houses. Regional Science and Urban Economics, 38(1), 63-69.
[5]. Liu Z, Wang P and Zha T 2013 Land-price dynamics and macroeconomic fluctuations. Econometrica, 81(3), 1147-1184.
[6]. Nichols J B, Oliner S D and Mulhall M R 2013 Swings in commercial and residential land prices in the United States. Journal of Urban Economics, 73(1), 57-76.
[7]. Saiz A 2010 The geographic determinants of housing supply. The Quarterly Journal of Economics, 125(3), 1253-1296.
[8]. Rubin Z and Felsenstein D 2017 Supply side constraints in the Israeli housing market-The impact of state owned land. Land Use Policy, 65, 266-276.
[9]. Zeno A and Roland F 2009 Macroeconomic determinants of international housing markets. Journal of Housing Economics, 19(1), 1-13.
[10]. Zhao M Y 2019 Regional analysis of housing price influencing factors. Journal of North China University of Science and Technology (Social Science Edition), 19(04), 37-41.
Cite this article
Dou,Y. (2024). Utilizing 31 Chinese province panel data models to investigate the factors influencing house prices. Theoretical and Natural Science,39,121-128.
Data availability
The datasets used and/or analyzed during the current study will be available from the authors upon reasonable request.
Disclaimer/Publisher's Note
The statements, opinions and data contained in all publications are solely those of the individual author(s) and contributor(s) and not of EWA Publishing and/or the editor(s). EWA Publishing and/or the editor(s) disclaim responsibility for any injury to people or property resulting from any ideas, methods, instructions or products referred to in the content.
About volume
Volume title: Proceedings of the 2nd International Conference on Mathematical Physics and Computational Simulation
© 2024 by the author(s). Licensee EWA Publishing, Oxford, UK. This article is an open access article distributed under the terms and
conditions of the Creative Commons Attribution (CC BY) license. Authors who
publish this series agree to the following terms:
1. Authors retain copyright and grant the series right of first publication with the work simultaneously licensed under a Creative Commons
Attribution License that allows others to share the work with an acknowledgment of the work's authorship and initial publication in this
series.
2. Authors are able to enter into separate, additional contractual arrangements for the non-exclusive distribution of the series's published
version of the work (e.g., post it to an institutional repository or publish it in a book), with an acknowledgment of its initial
publication in this series.
3. Authors are permitted and encouraged to post their work online (e.g., in institutional repositories or on their website) prior to and
during the submission process, as it can lead to productive exchanges, as well as earlier and greater citation of published work (See
Open access policy for details).
References
[1]. Adams Z and Fuss R 2010 Macroeconomic determinants of international housing markets. Journal of Housing Economics, 19(1), 38-50.
[2]. Holly S, Pesaran M H and Yamagata T 2010 A spatio-temporal model of house prices in the USA. Journal of Econometrics, 158(1), 160-173.
[3]. Quigley J M and Raphael S 2004 Is housing unaffordable? Why isn’t it more affordable? Journal of Economic Perspectives, 18(1), 191-214.
[4]. Maennig W and Dust L 2008 Shrinking and growing metropolitan areas asymmetric real estate price reactions? The case of German single-family houses. Regional Science and Urban Economics, 38(1), 63-69.
[5]. Liu Z, Wang P and Zha T 2013 Land-price dynamics and macroeconomic fluctuations. Econometrica, 81(3), 1147-1184.
[6]. Nichols J B, Oliner S D and Mulhall M R 2013 Swings in commercial and residential land prices in the United States. Journal of Urban Economics, 73(1), 57-76.
[7]. Saiz A 2010 The geographic determinants of housing supply. The Quarterly Journal of Economics, 125(3), 1253-1296.
[8]. Rubin Z and Felsenstein D 2017 Supply side constraints in the Israeli housing market-The impact of state owned land. Land Use Policy, 65, 266-276.
[9]. Zeno A and Roland F 2009 Macroeconomic determinants of international housing markets. Journal of Housing Economics, 19(1), 1-13.
[10]. Zhao M Y 2019 Regional analysis of housing price influencing factors. Journal of North China University of Science and Technology (Social Science Edition), 19(04), 37-41.


