


1. Research Background and Problem Restatement
1.1. Research Background
With the rapid development of information technology, major platforms utilize intelligent recommendation algorithms to accurately cater to user preferences by pushing similar information and introducing users with similar interests. This gradually leads to the emergence of the "Screaming Effect" and the "Echo Chamber Effect." Users are attracted to sensational and exaggerated information, and the range of information they receive becomes increasingly confined to familiar and interesting fields. The long-term existence of this effect is likely to foster the creation of "Information Cocoon".
"Information Cocoon" refers to the process in information dissemination where individuals tend to choose content that aligns with their preferences while ignoring or being skeptical of information that does not match their interests, gradually losing the opportunity to engage with diverse information and forming a closed information circle. The rise of digital media has led to information overload, and personalized information push further compresses individuals' activity scope within cultural spaces, reinforcing the trend toward the formation of "Information Cocoon." This phenomenon weakens users' critical thinking abilities, affects their judgment of information authenticity, and poses potential negative impacts on public opinion guidance and the healthy development of society.
2. Problem Analysis and Symbol Explanation
2.1. Analysis of Problem One
Problem One: Download relevant data from social media to analyze and describe the direction and influencing factors of topic fermentation. The final viewpoints of the topics may either converge or polarize.
This will involve downloading data on two popular topics, using the LDA model to analyze their thematic ideas and dissemination paths, and conducting correlation analysis through factors such as forwarding volume and likes to explore the dissemination trends and influencing factors of different topics.
2.2. Symbol Explanation
Table 1. Symbol Explanation
No. | Symbol | Variable Explanation |
1 | \( I=\lbrace {i_{i}},{i_{2}},⋯,{i_{t}}\rbrace \) | \( {i_{t}} \) represents the state at time \( t \) |
2 | \( {o_{t}} \) | Observed value at time \( t \) |
3 | \( status:(B,M,E,S) \) | \( B、M、E、S \) :start, middle, end, single word |
4 | \( {I_{t}} \) | HMM's observation sequence |
5 | \( {I_{t}} \) | HMM's state sequence |
6 | \( {I_{t}} \) | HMM's state transition matrix |
7 | \( {I_{t}} \) | HMM's probability output matrix |
8 | \( {I_{t}} \) | HMM's initial probability distribution |
9 | \( {I_{t}} \) | Perplexity |
3. Modeling and Solution for Problem One
According to the 49th "Statistical Report on Internet Development in China" published by the China Internet Network Information Center (CNNIC) in 2022, as of December 2021, the number of online news users in China reached 771 million, an increase of 28.35 million compared to December 2020, accounting for 74.7% of the total internet users. The report indicates that CCTV News continuously published live videos and news content on platforms such as Bilibili and Weibo, with relevant video views exceeding 200,000 each. Furthermore, in the context of the pandemic's normalization, the "Weibo + Tourism" development model has also achieved notable results. The number of users broadcasting on Weibo tourism increased by 110% in 2021 compared to 2020, with broadcast sessions rising by 143% and viewership increasing by 1968%[4].
As a comprehensive social platform with significant influence in China, users—including ordinary users, opinion leaders, media, and government entities—create information on this platform, disseminate it, and subsequently trigger public opinion events[5]. Due to the virtual nature of cyberspace and behaviors such as the misinterpretation of information by some netizens, failure to guide and manage the direction of public opinion in a timely manner can lead to substantial social harm. Therefore, this paper selects Weibo, the mainstream platform for public opinion, to study the mechanisms of online public opinion information dissemination and its influencing factors, providing a reference for government control of public sentiment.
3.1. Topic Data Crawling
The dissemination and fermentation of topic information require a certain amount of time. As time passes, the continuous exposure of event details, some media reporting from a non-neutral perspective to attract user attention, and changes in social values can all influence the direction of public opinion, leading to either a consensus or polarization among netizens regarding the event. Therefore, this paper chooses to crawl data on two topics: "COVID-19" and "IG Esports Club," representing unified and polarized opinions, respectively.
3.1.1. Data Time Confirmation
The data collection period referenced the Baidu Index, with the active period of the "IG Esports Club" starting in July 2020 and ending in October 2020. The "COVID-19" topic gained significant attention from netizens from January 2020 to April 2020.
3.1.2. Data Preprocessing
(1) Chinese Word Segmentation
First, regular expressions are used for rough segmentation of sentences. Next, each sentence is constructed into a directed acyclic graph (DAG), and dynamic programming is employed to find the maximum probability path, resulting in the maximum segmentation combination based on word frequency. For each character in the sentence, if it can form a word with an adjacent character (where the word is in the prefix dictionary) or is a non-continuous single character, all composed words are saved. For out-of-vocabulary words (continuous single characters not found in the prefix dictionary), a Hidden Markov Model (HMM) is constructed, and the Viterbi algorithm is used for segmentation.
The Hidden Markov Model (HMM) text segmentation is based on the following three assumptions, as illustrated in Figure 1.
First, in the Hidden Markov Model, the state at time ttt only depends on the state at the previous time t−1t-1t−1, that is, \( P({X_{i}}|{X_{1}},⋯,{X_{i}})=P({X_{i}}|{X_{i-1}}) \) [7] .
Second, the state independence assumption posits that the output value at a given moment depends only on the current state, and the states at different moments and their corresponding outputs are independent of each other, that is \( P({O_{1}},⋯,{O_{T}}|{X_{1}},⋯,{X_{T}})=\prod _{t=1}^{T}P({O_{t}}|{X_{t}}) \) .
Third, the stationarity assumption states that the predicted state of a word is independent of its position in the sentence, that is \( ∀i,j,P({X_{i+1}}|{X_{i}})=P({X_{j+1}}|{X_{j}}) \) .
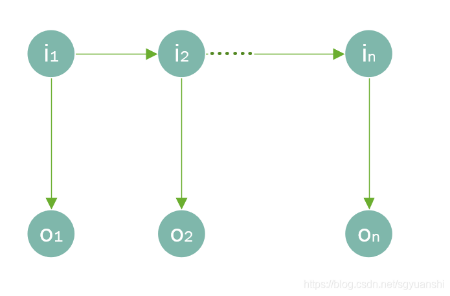
Figure 1. Illustration of the Assumptions
The joint probability distribution of the HMM is given by:
\( P({o_{1}},{i_{1}},⋯,{o_{t}},{i_{t}})=P({i_{1}})P({o_{1}}|{i_{1}})\prod _{i=2}^{t}P({i_{i}}|{i_{i-1}})P({o_{i}}|{i_{i}}) \)
where \( I=\lbrace {i_{i}},{i_{2}},⋯,{i_{t}}\rbrace \) represents the state variables and \( {i_{t}} \) is the state at time \( t \) , assumed to be unobservable. \( O=\lbrace {o_{i}},{o_{2}},⋯,{o_{t}}\rbrace \) represents the observation variables, and \( {o_{t}} \) is the observed values at time \( t \) .
In text segmentation, the state values of each word are combined as \( status:(B,M,E,S) \) , \( B、M、E、S \) representing the beginning, middle, end, and individual words, respectively. All Chinese characters form the observation value set. When an input sentence is provided, the observation value set is transformed into an observation sequence, ultimately outputting the state values. The output state values correspond to the sequence with the highest probability of transitioning from the starting word \( B \) to the ending word \( E \) [8].
The HMM can be represented by five basic elements, including two state sets and three probability matrices:
Observation sequence: O
State sequence: S
State transition matrix: A
Probability output matrix: B
Initial probability distribution: PI (the probability that the first character of the sentence belongs to one of the four states{B,E,M,S});
Thus, the segmentation problem is transformed into finding the state value sequence S that maximizes the probability given the parameters \( (O,PI,A,B) \) :
\( argmax{}P({S_{1}},{S_{2}},⋯,{S_{n}}|{O_{1}},{O_{2}},⋯,{O_{n}},PI,A,B) \)
Based on the aforementioned three assumptions, the formula can be simplified to:
\( argmax{}P({O_{1}}|{S_{1}},PI,A,B)×⋯×P({O_{n}}|{S_{n}},PI,A,B)×⋯×P({S_{n}}|{S_{n-1}}) \)
This problem is then transformed into a dynamic programming problem, using the Viterbi algorithm to find the maximum probability path that generates the observation set.
(2) Text Denoising
Text denoising involves removing punctuation, stop words, URLs, and other unnecessary tags to simplify the output text for classifiers and improve classification accuracy[9]. The specific operations are detailed in Table 2.
Table 2. Text Denoising Process
Step | Object | Processing Method |
Remove Punctuation | Non-space, non-Chinese characters | Replace with spaces, merge consecutive spaces |
Remove Stop Words | Stop words | Delete words found in the stop word library. The stop word library is compiled by deduplicating and merging the "Sichuan University Machine Intelligence Laboratory Stop Word Library," "Harbin Institute of Technology NLP Stop Word Library," and "Baidu NLP Stop Word Library." |
Remove URLs | http, https, etc. | Replace URLs with spaces after regex matching |
Remove Unnecessary Tags | Special text for certain functions | Use regex for matching and removal |
Therefore, this paper collects relevant data for the aforementioned time period. Taking "COVID-19" as an example, after obtaining the data, we first preprocess the text by filtering irrelevant characters, removing stop words, and performing segmentation, followed by keyword extraction.
In the early stages of the pandemic, the focus of discussions centered around "Wuhan," "seafood market," and "unknown causes," indicating that people mainly discussed the location and causes of the event with fewer personal opinions expressed. By January 2020, the focus shifted primarily to "fighting the pandemic," and in March 2020, it turned to "asymptomatic infections" and reports from "CNN journalists," reflecting the pandemic's spread overseas. By April of the same year, discussions began to include topics such as "vaccine development." This shows that as time progresses, people's focus on the topic continues to evolve.
3.1.3. Indicator Extraction
Based on communication theory, Harold Lasswell proposed the "5W" model in his paper "The Structure and Function of Social Communication": Who → Says What → In Which Channel → To Whom → With What Effect[10]. The "5W" model describes the path and effects of information dissemination. Therefore, this paper refers to Lasswell's "5W" model to preprocess the data and extract relevant indicators. Specifically, we select "Weibo Level" and "User Name" as indicators for publisher attributes, use the number of posts as the measure of information dissemination volume, and employ the number of retweets and comments to assess dissemination effects. The specific indicator measurements are shown in Table 3.
Table 3. Topic Crawler Indicator Extraction
Indicator | Description |
Weibo Level | User attribute metric from Weibo profile information |
User Name | |
Weibo Content | Textual, extracting opinion themes |
Release Time | Statistical results from data collection |
Retweet Count | Statistical results from data collection, measuring user dissemination effect |
Comment Count | |
Like Count |
Based on the above approach and requirements, we crawled data on the topics of "IG eSports Club" and "COVID-19," while using the LDA topic model to explore the development processes of the two topics, specifically whether they ultimately lead to a unified viewpoint or polarization.
3.2. Research on Topic Dissemination Mechanism Based on LDA Model
This paper aims to use the LDA model to determine the number of topics at different time periods. If the number of topics decreases and the sample size of each topic increases, this indicates that public opinions among netizens are gradually unifying. Conversely, if the number of topics increases, opinions are becoming more polarized. The LDA model utilizes a three-layer topological structure of text-topic-words, where feature words combine to form latent topics according to certain probabilities, and topics combine to form documents based on certain probabilities[11].
Let \( θ \) represent the text-topic distribution and \( β \) represent the topic-word distribution, from which we can derive the generation probability of feature words in the text. The higher the probability, the more the feature word reflects the main information of the text. Therefore, we define the probability value as SI (Semantic Influence).
For any document d, assuming its topic distribution is \( {θ_{d}} \) and for any topic k, let the corresponding feature word distribution be \( {β_{k}} \) , both topics and feature words follow a Dirichlet distribution, represented as:
\( {θ_{d}}=Dirichlet(\vec{α}) \)
\( {φ_{k}}=Dirichlet(\vec{β}) \)
where \( α \) is the K-dimensional hyperparameter variable in the distribution, and K represents the number of topics. \( β \) is the V-dimensional hyperparameter variable in the distribution. V represents the number of words. The probabilistic graphical model of LDA is shown in Figure 2.
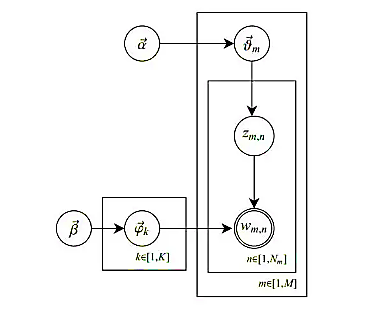
Figure 2. Probabilistic Graph Representation of the LDA Model
Let \( SI(w|d) \) represent the semantic influence of the word w in document d:
\( SI(w|d)=\sum _{j=1}^{k}(θ_{z=j}^{d}×φ_{w}^{z=j}) \)
The probability of the word w in topic z is \( φ_{w}^{z=j} \) , representing the importance of w within topic z. Meanwhile, the probability of the word w in document d is \( θ_{z=j}^{d} \) . The higher the probability, the more significant the topic z is in document d. For the LDA model, we use the Gibbs sampling algorithm for parameter estimation, ultimately obtaining the text-topic and topic-word distribution vectors along with the SI:
\( θ_{z=j}^{d}=\frac{{B_{1}}(d,j)+α}{\sum _{i=1}^{K}{B_{1}}(d,i)+K×α} \)
\( φ_{w}^{z=j}=\frac{{B_{2}}(w,j)+β}{\sum _{i=1}^{N}{B_{2}}(i,j)+N×β} \)
\( SI(w|d)=\sum _{j=1}^{K}(\frac{{B_{1}}(d,j)+α}{\sum _{i=1}^{K}{B_{1}}(d,i)+K×α}×\frac{{B_{2}}(w,j)+β}{\sum _{i=1}^{N}{B_{2}}(i,j)+N×β}) \)
where \( \sum _{i=1}^{K}{B_{1}}(d,i) \) represents the total number of feature words contained in all topics in document d, and
\( \sum _{i=1}^{N}{B_{2}}(i,j) \) represents the total number of feature words in the latent topic j. Finally, we compute the cosine similarity of the vectors to determine the similarity of the texts; when the cosine value exceeds a threshold, the texts are considered to belong to the same topic; otherwise, they are viewed as belonging to different topics.
It is important to note that the LDA model requires us to manually set the number of topics, and the model's accuracy varies with different topic counts. Currently, there are two main criteria for judging whether the LDA model is reasonable: coherence and perplexity. As the number of topics in the LDA model increases, the perplexity decreases. However, when the number of topics is excessively high, the generated model often overfits. Thus, we need to combine coherence to make a judgment. In other words, when we have an approximate range for the number of topics from perplexity, we can use coherence to select a more suitable number from that range.
The perplexity is defined as:
\( perplexity (S)=p{({w_{1}},{w_{2}},L,{w_{n}})^{-\frac{1}{n}}} \)
\( =\sqrt[n]{\frac{1}{p({w_{1}},{w_{2}},L,{w_{n}})}} \)
\( =\sqrt[n]{\prod _{i=1}^{n}\frac{1}{p({w_{i}}|{w_{1}},L,{w_{i-1}})}} \)
In which \( S \) represents a sentence, decomposed into words \( {w_{1}},{w_{2}},⋯,{w_{n}} \) . \( p \) indicates the probability of word occurrence.
A lower perplexity score obtained from the test set indicates a better performance of the language model. As can be seen from the above formula, perplexity is actually the geometric mean of the probabilities of each word, and thus can be understood as the average branching factor, which refers to the average number of word choices available when the model predicts the next word.
Using a monthly period, we apply both perplexity and coherence to determine the optimal number of topics for the LDA model, which in turn helps us gauge the direction of public opinion.
Generally, the number of LDA topics should not be excessive; therefore, we can approximate that the optimal number for the "IG eSports Club" topic from July to October are: 4, 5, 4, and 1. This suggests that the opinions regarding the "IG eSports Club" topic are gradually unifying.
Similarly, we can derive the topic coherence curve for the "COVID-19" discussion. The results indicate that, as time progresses, opinions primarily become polarized.
The optimal LDA values for January, February, March, and April are 5, 7, 7, and 2, respectively. Ultimately, the focus of the COVID-19 topic centers on confirmed cases, self-isolation, and protection measures.
3.3. Factors Influencing Topic Dissemination
3.3.1. The Impact of Publishers on Dissemination Effects
The first emphasis of the 5W model is the question of "who." Some studies focus on analyzing the influence of factors such as publishers and opinion leaders on dissemination effects. This paper takes the publisher's Weibo level as the research object, which includes five titles: Yellow V, Gold V, Blue V, Ordinary Users, and Weibo Influencers[12]. Meanwhile, the effects of dissemination are measured by the number of retweets and likes on Weibo. Therefore, we propose the following hypotheses:
H1: The type of publisher affects the dissemination effect.
H2: The type of publisher does not affect the dissemination effect.
A correlation analysis between the publisher's Weibo level and the dissemination effect is presented in Table 4.
Table 4. Kendall's W Analysis Results
Name | Average Rank | Median | Kendall's W Coefficient | X² | 𝑝 |
Weibo Level | 1.018 | 2 | 0.955 | 926.163 | 0.000*** |
Weibo Retweets | 2.023 | 3 | |||
Weibo Likes | 2.96 | 13 |
Note: ***, **, and * represent significance levels of 1%, 5%, and 10%, respectively.
As can be seen, there is a positive correlation between the publisher's Weibo level and the topic dissemination effect, indicating that a higher Weibo level leads to better dissemination effects for the published information. This suggests that on the Weibo platform, if an opinion leader has more followers and a wider range of influence, the likelihood of promoting the dissemination of information increases. Therefore, the attributes of Weibo publishers directly influence the dissemination effects of public opinion events [13]. Weibo accounts with many followers and attention possess higher dissemination potential, resulting in more effective audience engagement.
3.3.2. The Impact of Information Release Quantity on Dissemination Effects
The null hypothesis is H3: The quantity of information dissemination has a promoting effect on dissemination effects.
The alternative hypothesis is H4: The quantity of information dissemination does not have a promoting effect on dissemination effects.
Table 5. Correlation Analysis of Total Weibo Releases and Total Retweets and Comments
- | Total Weibo Releases | Total Retweets and Comments | |
Total Weibo Releases | Pearson Correlation | 1 | –.380** |
Significance (two-tailed) | - | .001 | |
N | 14 | 14 | |
Note: ** indicates a significant correlation at the 0.01 level (two-tailed)
The results indicate that the Pearson coefficient between total Weibo releases and total retweets and comments is –0.380, p = 0.001 < 0.01. This reflects a significant negative correlation between the quantity of information released by the Weibo account and the total number of user retweets and comments. It suggests that the number of information releases on Weibo negatively impacts the behavior of retweeting and commenting[14]. In other words, Weibo accounts that release fewer pieces of information tend to have a higher total number of retweets and comments, while accounts with a larger volume of releases tend to have fewer retweets and comments overall.
3.3.3. The Impact of Time Factors on Dissemination Effects
The null hypothesis is H5: Dissemination effects are significantly influenced by the time of Weibo post release.
The alternative hypothesis is H6: Dissemination effects are not significantly influenced by the time of Weibo post release.
Table 6. Correlation Analysis Between Weibo Release Time and Dissemination Effects
- | Daily Accumulated Retweets and Comments | Daily Total Retweets and Comments | Release Time | |
Daily Accumulated Retweets and Comments | Pearson Correlation | 1 | - | - |
Significance (two-tailed) | - | - | - | |
Daily Total Retweets and Comments | Pearson Correlation | –0.466 | 1 | - |
Significance (two-tailed) | 0.093 | - | - | |
Release Time | Pearson Correlation | .943** | –0.366** | 1 |
Significance (two-tailed) | .000 | .001 | - | |
- | N | 14 | 14 | 14 |
The above results show that the Pearson correlation coefficient between the first release time on Weibo and the daily accumulated retweets and comments is 0.943, p = 0.000 < 0.05, which is significant. In contrast, the Pearson correlation coefficient between release time and the daily total retweets and comments is –0.366, p = 0.001 < 0.01, and also significant. Therefore, it can be concluded that the timing of information released on Weibo has a significant impact on dissemination effects. Specifically, it has a significant negative impact on the daily total retweets and comments, while exhibiting a significant strong positive impact on the daily accumulated retweets and comments[15]. This indicates that as events progress, the fervor of dissemination on Weibo diminishes, leading to a gradual decrease in daily dissemination volume.
4. Advantages and Disadvantages of the Model and Future Prospects
4.1. Advantages and Disadvantages
4.1.1. Advantages
(1) The study selects a time period for topic fermentation based on the Baidu Popularity Index. Some topics may exhibit multiple peak characteristics and have longer discussion periods. Due to length constraints, this paper focuses on the first period.
(2) The use of perplexity and coherence to determine the optimal number of topics in the LDA model is relatively objective.
(3) The Analytic Hierarchy Process integrates both subjective and objective approaches, avoiding the non-objectivity of purely subjective models while alleviating the problem of objective models being overly dependent on data and detached from reality.
4.1.2. Disadvantages
(1) Due to the large workload, the analysis does not cover the entire process of topic fermentation.
(2) As LDA is part of the bag-of-words model, it does not consider the relationships between words, which has a certain impact on the model's accuracy.
5. Conclusion and Future Prospects
With the widespread use of the internet, the speed of information dissemination has accelerated, leading to a mix of true and false information that can easily skew events away from their original reality. The LDA topic model has been widely applied in the study of Weibo topics; however, being based on the bag-of-words model, its performance is influenced by text length and does not account for the relationships between words. With advancements in deep learning, the word2vec model has demonstrated strong capabilities in text topic extraction. By representing words in vector form, it measures the similarity between words and better captures their associations, thereby addressing the limitations of the LDA model.
The evolution of events and hotspots typically follows a certain lifecycle. International scholars such as B.T. Burkholder have proposed a three-stage model, while Robert H. expanded this into a four-stage model. Domestic scholars like Ma Jianhua argue that the evolution of sudden events includes the latency period, outbreak period, spread period, and recovery period, while Jia Yamin proposed four stages based on specific cases: initiation, outbreak, decline, and calming. Additionally, online public opinion events often exhibit unimodal, bimodal, or multimodal progression, depending on the number of peaks in public opinion.
Future research will expand the temporal dimension of data collection and integrate models like word2vec to deeply analyze the changes in themes during different evolutionary stages of public opinion events, thereby providing a more comprehensive understanding of the dissemination patterns of online topics.
References
[1]. Chen, Y. (2022). The "partitioning" of concepts: Intra-group segregation in contemporary China's internet space. Sociological Research, 37(04), 117-135+228.
[2]. Yang, L. (2022). Effective measures for strengthening political supervision in state-owned enterprises. Enterprise Party Building, (07), 12-13.
[3]. Sun, A. (2022). Research on new media communication in the context of big data algorithms. Network Security and Informatization, (07), 9-11.
[4]. Zhang, T. (2022). Legal regulation of algorithms. In Shanghai Law Research (Vol. 5, pp. 238-248). Proceedings of the 2022 World Artificial Intelligence Conference Legal Forum. DOI: 10.26914/c.cnkihy.2022.014731.
[5]. Wan, H., & Zhang, Y. (2021). Group variable selection and AdaBoost ensemble pruning based on MCP penalty. Computer Systems Applications, 30(11), 281-288. DOI: 10.15888/j.cnki.csa.008124.
[6]. Lu, Y., & Wang, W. (2011). Variable selection in financial distress prediction: An SVM approach based on average influence value. Systems Engineering, 29(08), 73-78.
[7]. Wei, S., Xue, Y., & Chen, C. (2005). Improvement of variable selection methods in financial distress prediction models. Statistics and Decision, (08), 17-19.
[8]. Ouyang, J. (2022). Research on online diagnosis of complex circuit faults based on PCA-LDA algorithm. Computer Measurement and Control, 1-11. Retrieved August 6, 2022.
[9]. Wu, Z., Lan, T., Wang, M., Pu, M., Zhang, Y., Liu, Z., & He, Y. (2022). Network news topic detection based on shared nearest neighbors and Markov clustering. Data Analysis and Knowledge Discovery, 1-15. Retrieved August 6, 2022.
[10]. Li, M., Sun, C., Liu, Y., & Chen, X. (2022). Research on enterprise R&D strategies based on thematic analysis of invention patents: A case study of Huawei. Soft Science, 1-15. Retrieved August 6, 2022.
[11]. Xu, Y. (2020). Research on the echo chamber effect in public opinion evolution (Master's thesis). Huazhong University of Science and Technology. DOI: 10.27157/d.cnki.ghzku.2020.005264.
[12]. Li, W., & Peng, J. (2019). Experimental analysis of the echo chamber effect in information dissemination on social network platforms. Modern Communication (Journal of Communication University of China), 41(04), 142-149.
[13]. Wang, D. (2018). Exploring the impact of the "echo chamber effect" on communication. Communication and Copyright, (10), 13-14+17. DOI: 10.16852/j.cnki.45-1390/g2.2018.10.005.
[14]. Ding, S. (2018). Research on the echo chamber effect in university students' use of Weibo (Master's thesis). Chang'an University.
[15]. Dong, G., & Li, J. (2017). The echo chamber effect of the comment mechanism on WeChat public accounts: A case study of "The Beijing News Comment". Youth Journalist, (30), 47-49. DOI: 10.15997/j.cnki.qnjz.2017.30.021.
Cite this article
Si,Y.;Jiang,C.;Wei,X.;Fang,S.;Li,Y.;Hu,Y. (2024). Analysis of the Correlation of Topic Feature Changes Based on the LDA Model. Theoretical and Natural Science,53,73-82.
Data availability
The datasets used and/or analyzed during the current study will be available from the authors upon reasonable request.
Disclaimer/Publisher's Note
The statements, opinions and data contained in all publications are solely those of the individual author(s) and contributor(s) and not of EWA Publishing and/or the editor(s). EWA Publishing and/or the editor(s) disclaim responsibility for any injury to people or property resulting from any ideas, methods, instructions or products referred to in the content.
About volume
Volume title: Proceedings of the 2nd International Conference on Applied Physics and Mathematical Modeling
© 2024 by the author(s). Licensee EWA Publishing, Oxford, UK. This article is an open access article distributed under the terms and
conditions of the Creative Commons Attribution (CC BY) license. Authors who
publish this series agree to the following terms:
1. Authors retain copyright and grant the series right of first publication with the work simultaneously licensed under a Creative Commons
Attribution License that allows others to share the work with an acknowledgment of the work's authorship and initial publication in this
series.
2. Authors are able to enter into separate, additional contractual arrangements for the non-exclusive distribution of the series's published
version of the work (e.g., post it to an institutional repository or publish it in a book), with an acknowledgment of its initial
publication in this series.
3. Authors are permitted and encouraged to post their work online (e.g., in institutional repositories or on their website) prior to and
during the submission process, as it can lead to productive exchanges, as well as earlier and greater citation of published work (See
Open access policy for details).
References
[1]. Chen, Y. (2022). The "partitioning" of concepts: Intra-group segregation in contemporary China's internet space. Sociological Research, 37(04), 117-135+228.
[2]. Yang, L. (2022). Effective measures for strengthening political supervision in state-owned enterprises. Enterprise Party Building, (07), 12-13.
[3]. Sun, A. (2022). Research on new media communication in the context of big data algorithms. Network Security and Informatization, (07), 9-11.
[4]. Zhang, T. (2022). Legal regulation of algorithms. In Shanghai Law Research (Vol. 5, pp. 238-248). Proceedings of the 2022 World Artificial Intelligence Conference Legal Forum. DOI: 10.26914/c.cnkihy.2022.014731.
[5]. Wan, H., & Zhang, Y. (2021). Group variable selection and AdaBoost ensemble pruning based on MCP penalty. Computer Systems Applications, 30(11), 281-288. DOI: 10.15888/j.cnki.csa.008124.
[6]. Lu, Y., & Wang, W. (2011). Variable selection in financial distress prediction: An SVM approach based on average influence value. Systems Engineering, 29(08), 73-78.
[7]. Wei, S., Xue, Y., & Chen, C. (2005). Improvement of variable selection methods in financial distress prediction models. Statistics and Decision, (08), 17-19.
[8]. Ouyang, J. (2022). Research on online diagnosis of complex circuit faults based on PCA-LDA algorithm. Computer Measurement and Control, 1-11. Retrieved August 6, 2022.
[9]. Wu, Z., Lan, T., Wang, M., Pu, M., Zhang, Y., Liu, Z., & He, Y. (2022). Network news topic detection based on shared nearest neighbors and Markov clustering. Data Analysis and Knowledge Discovery, 1-15. Retrieved August 6, 2022.
[10]. Li, M., Sun, C., Liu, Y., & Chen, X. (2022). Research on enterprise R&D strategies based on thematic analysis of invention patents: A case study of Huawei. Soft Science, 1-15. Retrieved August 6, 2022.
[11]. Xu, Y. (2020). Research on the echo chamber effect in public opinion evolution (Master's thesis). Huazhong University of Science and Technology. DOI: 10.27157/d.cnki.ghzku.2020.005264.
[12]. Li, W., & Peng, J. (2019). Experimental analysis of the echo chamber effect in information dissemination on social network platforms. Modern Communication (Journal of Communication University of China), 41(04), 142-149.
[13]. Wang, D. (2018). Exploring the impact of the "echo chamber effect" on communication. Communication and Copyright, (10), 13-14+17. DOI: 10.16852/j.cnki.45-1390/g2.2018.10.005.
[14]. Ding, S. (2018). Research on the echo chamber effect in university students' use of Weibo (Master's thesis). Chang'an University.
[15]. Dong, G., & Li, J. (2017). The echo chamber effect of the comment mechanism on WeChat public accounts: A case study of "The Beijing News Comment". Youth Journalist, (30), 47-49. DOI: 10.15997/j.cnki.qnjz.2017.30.021.