


1. Introduction
Particle production has been studied in various ways to comprehend strong interaction in high-energy atomic nuclei. The quantum chromodynamics (QCD) theory, which is about the strong interactions among subatomic particles, predicts a phase transition between hadronic and deconfined matter at high temperatures.[1] Ultra-relativistic collisions of heavy nuclei can be used to conduct experimental studies of strongly interacting matter under such severe circumstances. Attention to this field increasingly aroused in November 2010, when the Large Hadron Collider (LHC) at CERN created the first Pb-Pb nuclear collisions at a centre-of-mass energy of 2.76 TeV per nucleon pair.[2]
Crucial characteristics of the matter formed in these collisions are the multiplicity of charged particles produced in the central rapidity region.[3] This document puts detection techniques into practice, including the “tracklet method,” and presents an analysis on the relationship between centrality dependence of charged-particle multiplicity density and the number of particles produced, as well as phenomenological models that explain measurements and trends that are found.
|
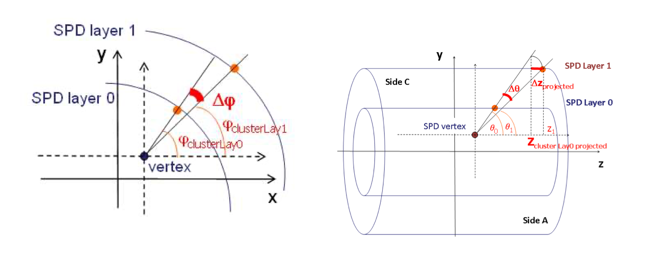
Figure 1. Cross sections of The pixel detector based tracklet reconstruction algorithm in ALICE. |
2. Background theory
2.1. Pseudorapidity and Azimuthal Angle
Particle collisions happen in the primary vertex of a pixel detector with multiple layers. In our study, the tracklet method is applied to obtain the data created by two reconstructed hit combinations in consecutive layers. In accelerator physics, we must distinguish between invariant quantities concerning the rest frames and those with transformation properties that are practical for analysis and simple to handle. By mathematical calculation, the difference between the rapidities of two particles is invariant concerning Lorentz boosts along the beam direction.[4] Since rapidity is difficult to measure for high-energy particles, we use the concept of pseudo– rapidity η – a widely used spatial coordinate that describes how a particle’s angle with the beam axis is determined. It can be mathematically defined as
\( η=-ln{tan{(\frac{θ}{2})}} \) ,
where θ is the angle between the particle three-momentum p and the positive direction of the beam axis.[5]
Rapidity is often paired with the azimuthal angle φ at which a particle is emitted, so we have the angle of emission from an interaction point as the coordinate pair. Figure 1 shows cross sections of the pixel detector-based tracklet reconstruction algorithm in ALICE.
2.2. Tracklet Method
The pseudorapidity distributions are measured by the tracklet reconstruction method.[6] The analysis uses the first two layers of the pixel detector to determine the tracklet; so we can obtain the lowest \( {P_{T}} \) value to calculate the differences in pseudorapidity (∆η) and azimuthal angle (∆φ). We selected tracklets with \( |∆η| \lt 0.1 \) in the tracklet reconstruction. Event multiplicity variables are crucial to the analysis. The number of background was subtracted by the number of tracklets as it is less susceptible to back- ground hits. Incorrectly related hits might create redundant background tracklets. Here, the sideband method was applied to estimate the fraction of background tracklets , which depends on the event multiplicity.[5]
3. Methodology
In this study, a parameterization of ALICE open data was analyzed. The data was collected by the Compact Muon Solenoid (CMS) detector – a detector composed of two layers of Silicon Pixel Detectors (SPD) and VZERO detectors. [5] It consisted of exactly 20000 events of particle collisions. SPD records the pseudorapidity ( \( η \) ) and the azimuthal angle ( \( φ \) ) of particles produced, by both the collision and background noise, in each collision. When particles went through the two layers of detectors, the pseudorapidity for the two layers were determined by measuring the angle of the hit point on the layer relative to the primary axis. The pseudorapidity angle ranged from -1 to 1, whereas the azimuthal angle ranged from \( -π \) to \( π \) .
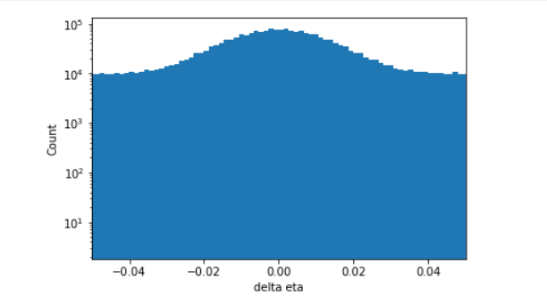
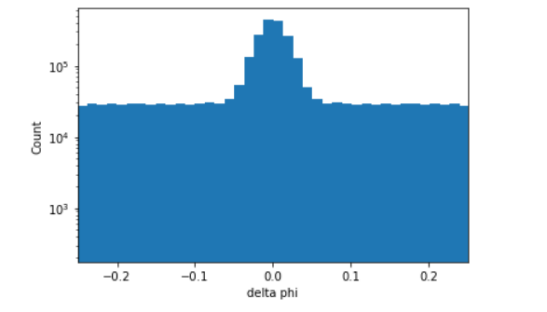
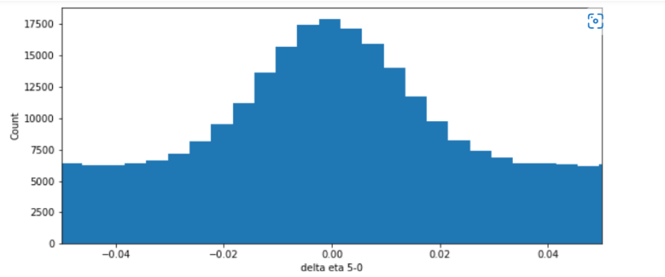
The tracklet method was applied to reconstruct the path of the produced particle from the data in general.[5] If hits on the two layers were made by the same particle, pseudorapidity values would be very close to each other. Hits made by different particles did not produce similar pseudorapidity and azimuthal angle. Using the tracklet method, since there will be many hits on the two layers, the hits which were made by one particle were selected. ∆η was calculated by determining the difference between a pseudorapidity value from layer one and another from layer two for every recorded pseudorapidity value. Figure 2 graphically presents the distribution of \( Δη \) among all 20000 events. The peak, with a domain of \( -0.4 \lt η \lt 0.4 \) and range from 80000 to 10000, was the result of the particles produced by the collision. The total number of particles produced was determined by finding the area of the peak. The distribution of ∆φ through a similar process was determined, as graphically presented in Figure 3.
|
Figure 2. ∆η vs. Event Count. |
|
Figure 3. ∆φ vs. Event Count. |
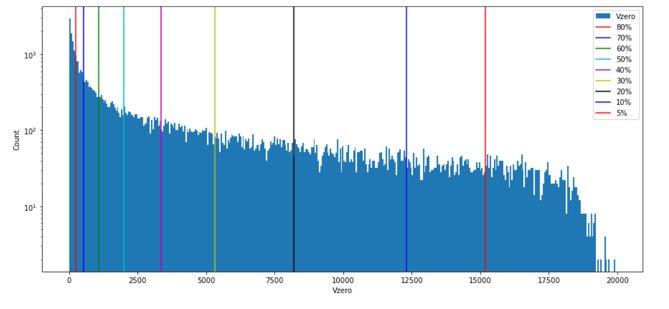
Data was analyzed based on centrality dependence using the tracklet method. Centrality dependence of particle collision was then determined by the impact parameter (b), the distance between two nuclei in the collision. With smaller impact parameters, collisions were within the high centrality range, involving more participants – particles in nuclei that will hit each other. Even though the detector could not directly measure participants, it could tell energy, which came from the VZERO detector, and the number of particles produced. Therefore, in the CMS experiment, the hits were reconstructed from the cluster of energy in the detector, which was comprehensively explained in [7]. The reconstructed hits were then used in tracklet reconstruction, which with analysis gave the calculation of the differences in azimuthal and pseudorapidity values.[8] This document, however, focuses on the analysis of centrality classes utilizing the tracklet method instead of the technicality on the calculation of values. Using the positive relationship between energy and particle produced, the collision events with the most significant energy as the events with the highest centrality range were selected. Figure 4 shows that all events were divided into ten centrality ranges in this analysis. In the graph, 0 to 5 percent centrality has the smallest impact parameter and highest number of participants. This way, prediction from the Glauber Monte Carlo model can be applied to estimate the average number of nucleon participants given the centrality classes.[9]
The tracklet method was performed in each centrality range to produce a ∆η histogram. Figure 5 shows the ∆η histogram for the top 5 percent of the centrality range. Then, the side-band method was utilized to distinguish the area of the peak from the background noise in the ∆η histogram. \( Δη \) and \( Δφ \) will combine into a two dimensions histogram. A signal region from \( -1 \lt φ \lt 1 \) will be identified to cover the peak area. Two side- band regions besides the signal region from \( 1 \lt φ \lt 2 \) were considered to be only background noise. The difference in the number of particles in the two regions were considered the number of particles produced by the collisions.[10]
|
Figure 4. VZERO vs. Event Count. |
|
Figure 5. ∆η(0 − 5%) vs. Event Count. |
4. Results
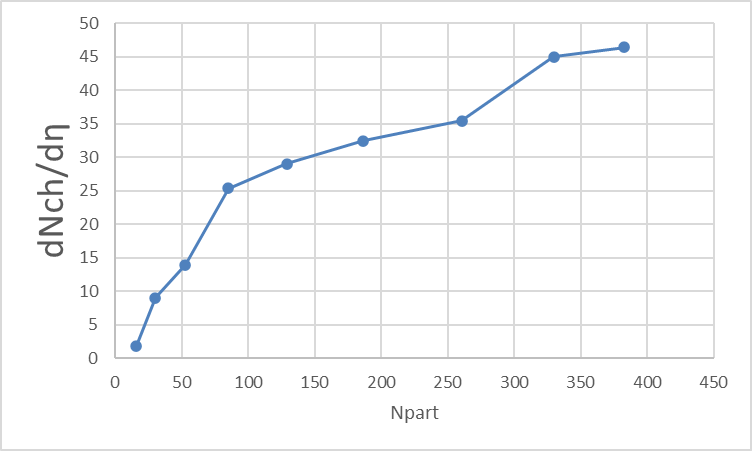
Table 1 presents the number of particles produced in each centrality range (N). \( \frac{Δ{N_{ch}}}{Δη} \) represents the particle produced per event per pseudorapidity unit[1], and Npart represents the number of participants in each centrality range (based on the prediction of the Glauber Monte Carlo model). Figure 6, plotting \( \frac{\frac{(Δ{N_{ch}}}{Δη)}}{(\frac{{N_{part}}}{2}}) \) versus \( {N_{part}} \) , shows the relationship between centrality range and particle produced per participating nucleon. [1]
The findings are numerically and graphically organized in Figure 6 and Figure 6, and the trend in which the number of particles produced increases as the centrality dependence decreases is shown. As mentioned previously, the ranges with the highest energy as the highest centrality ranges were selected. Finding a negative correlation between centrality dependence ranges and the number of particles produced led to more conclusions about the relationship between centrality ranges and particle production. Since the lower the centrality range meant a larger amount of particle produced, it also meant that a more significant impact parameter. A higher centrality range was where there were more participants – particles in nuclei that will hit each other, inferred from the higher energy in such ranges. In the parameterization of ALICE open data that we used, we find a negative correlation in the relationship between the centrality dependence ranges and the number of particles produced, as well as the relationship between energy and the number of particles produced.
|
Figure 6. (∆Nch/∆η)/(Npart/2) vs. Npart. |
5. Conclusion
Analyzing how centrality affects the number of particles produced is essential for understanding the nature of particle production. In this analysis, the tracklet method and the distributions of ∆η were utilized, and the negative correlation between centrality ranges, as well as energy, and the number of particles produced was found. This suggests that with a larger centrality, or when the collisions are more head-on, more particles are produced. This is relatively unsurprising, since when centrality is larger, the collisions of the particles are closer to their centres, so the collisions generate more products.
Acknowledgement
All the authors contributed equally to this work and should be considered as co-first author.
References
[1]. C. Gerschel. Nuclear Matter in Different Phases and Transitions. 1999.
[2]. ALICE Collaboration. Centrality dependence of the charged-particle multiplicity density at mid-rapidity in Pb–Pb collisions at √sNN = 2.76T eV . Sept. 2017.
[3]. N. Armesto. Predictions for the Heavy-ion Programme at the Large Hadron Collider. 2009.
[4]. V. Chiochia. Accelerators and Particle Detectors. 2010.
[5]. Yen-Jie Lee. Measurement of the Charged-Hadron Multiplicity in Proton- Proton Collisions at LHC with the CMS Detector. Oct. 2011.
[6]. V. Khachatryan. Pseudorapidity Distribution of Charged Hadrons in Proton-Proton Collisions at √S= 13TeV. 2015.
[7]. CMS Collaboration. Commissioning and Performance of the CMS Pixel Tracker with Cosmic Ray Muons. 2019.
[8]. K. Aamodt. Charged-particle multiplicity measurement in proton–proton collisions at s=0.9 and 2.36 TeV with ALICE at LHC. 2010. doi: https://doi.org/10.1140/epjc/s10052-010-1339-x.
[9]. M. L. Miller/K. Reygers/ S. J. Sanders/ P. Steinberg. Glauber Mod- eling in High Energy Nuclear Collisions. 2007.
[10]. E. Daw. Rapidity and Pseudorapidity. Mar. 2012.
Cite this article
Chik,N.;Cheng,B.W.;Cheng,X.;Jin,W. (2023). Tracklet Method Analysis on Particle Production Based on Centrality Dependence. Theoretical and Natural Science,5,113-118.
Data availability
The datasets used and/or analyzed during the current study will be available from the authors upon reasonable request.
Disclaimer/Publisher's Note
The statements, opinions and data contained in all publications are solely those of the individual author(s) and contributor(s) and not of EWA Publishing and/or the editor(s). EWA Publishing and/or the editor(s) disclaim responsibility for any injury to people or property resulting from any ideas, methods, instructions or products referred to in the content.
About volume
Volume title: Proceedings of the 2nd International Conference on Computing Innovation and Applied Physics (CONF-CIAP 2023)
© 2024 by the author(s). Licensee EWA Publishing, Oxford, UK. This article is an open access article distributed under the terms and
conditions of the Creative Commons Attribution (CC BY) license. Authors who
publish this series agree to the following terms:
1. Authors retain copyright and grant the series right of first publication with the work simultaneously licensed under a Creative Commons
Attribution License that allows others to share the work with an acknowledgment of the work's authorship and initial publication in this
series.
2. Authors are able to enter into separate, additional contractual arrangements for the non-exclusive distribution of the series's published
version of the work (e.g., post it to an institutional repository or publish it in a book), with an acknowledgment of its initial
publication in this series.
3. Authors are permitted and encouraged to post their work online (e.g., in institutional repositories or on their website) prior to and
during the submission process, as it can lead to productive exchanges, as well as earlier and greater citation of published work (See
Open access policy for details).
References
[1]. C. Gerschel. Nuclear Matter in Different Phases and Transitions. 1999.
[2]. ALICE Collaboration. Centrality dependence of the charged-particle multiplicity density at mid-rapidity in Pb–Pb collisions at √sNN = 2.76T eV . Sept. 2017.
[3]. N. Armesto. Predictions for the Heavy-ion Programme at the Large Hadron Collider. 2009.
[4]. V. Chiochia. Accelerators and Particle Detectors. 2010.
[5]. Yen-Jie Lee. Measurement of the Charged-Hadron Multiplicity in Proton- Proton Collisions at LHC with the CMS Detector. Oct. 2011.
[6]. V. Khachatryan. Pseudorapidity Distribution of Charged Hadrons in Proton-Proton Collisions at √S= 13TeV. 2015.
[7]. CMS Collaboration. Commissioning and Performance of the CMS Pixel Tracker with Cosmic Ray Muons. 2019.
[8]. K. Aamodt. Charged-particle multiplicity measurement in proton–proton collisions at s=0.9 and 2.36 TeV with ALICE at LHC. 2010. doi: https://doi.org/10.1140/epjc/s10052-010-1339-x.
[9]. M. L. Miller/K. Reygers/ S. J. Sanders/ P. Steinberg. Glauber Mod- eling in High Energy Nuclear Collisions. 2007.
[10]. E. Daw. Rapidity and Pseudorapidity. Mar. 2012.