


1. Introduction
In December 2019, a number of unknown pneumonia cases were reported in Wuhan, Hubei Province, China. The situation soon received nationwide attention and urgent investigation was carried out by National Health Commission (NHC) in China and World Health Organization (WHO). In January, the cause for pneumonia was discovered to be a newly known coronavirus, named as SARS-Cov-2 while the pneumonia was named as COVID-19 [1]. First COVID-19 case outside China was reported in Thailand around 20th January 2020 and the first death caused by the virus occurred in January 2020 [2, 3]. Prevention methods and policies were soon adapted by almost every country, such as total lockdown of Wuhan city from 23rd January 2020 and ban of flights from China to Japan from April 2020 [4]. Since then, the world entered a new but short era during which COVID-19 cases emerged around the globe.
During the COVID-19 period, most countries experienced major economic downturn due to restrictions and lockdown measures implemented. This resulted in a global recession of 3.4% with significant impacts on areas such as employments and international trades [5]. With the help of the discovery of several types of vaccines, the Case Fatality Rate of the virus globally was kept at below 6.22% (Italy) though the infection rate of the virus across the countries was high at more than 90% (Singapore) [6]. Gradually with the decline in toxicity of COVID-19 from alpha to omicron, the virus was finally rated lower by several countries including China in 2023 [7]. This marked the end of the ‘COVID ERA’ and the start of post-COVID period.
Although the virus has been largely monitored and controlled, the study of approaches taken by different countries to deal with COVID-19 is still meaningful and helpful in finding more effective methods to handle the virus in less-developed countries, where COVID-19 was still serious and extremely fatal, and in earning experiences to initiate faster and more useful measures when dealing with other possible pandemics in the future [8]. Among all the methods to deal with COVID-19, most of them can be classified into three different types, conservatism of long-term lockdown such as China (CN), moderatism of temporary lockdown such as Singapore (SG) and liberalism of nearly total freedom such as the United States (US) [9, 10]. Their attitudes towards vaccination also varied from recommendary in China to almost compulsory in Singapore [11, 12].
Wu provided an insightful overall analysis of the COVID-19 virus around the globe in terms of how the virus causes symptoms, how the virus spread from China to the rest parts of the world as well as how the governments responded towards the virus. Bogoch talked about the early transmission of COVID-19 from China into other countries through transportation such as airplane. Wang offered an overview and detailed statistics of the early outbreak of the pandemic in China. Inoue wrote about Japanese policies against COVID-19 pandemic spreading. Akbulaev discussed how the virus affected the economy of different countries in terms of employments, exports, consumption and other aspects. Khafaie compared the case facility rates and recovery rates of different countries. Larrauri discussed the effect on vaccine on the fatality rate and infection numbers before and after the spread of omicron species. Lone provided a unique perspective of COVID-19’s impacts and treatments against it from Africa’s point of view. Lau analyzed the data of conformed cases domestically and internationally before and after the implementation of lockdown measures in China. Jacinta talked about the effectiveness of Singapore’s measures to deal with the pandemic in terms of number of confirmed cases. Meng discussed China’s policies about vaccination and whether they are effective in dealing with the pandemic. Loo shared an overview of the circumstances about COVID-19 in Singapore and how the government responded to the situation.
In this paper, the effectiveness of governments’ methods or policies in dealing with an unknown virus will be examined with the help of COVID-related statistics of three countries (Singapore, China and the United States) and the data about these countries in terms of GDP.
2. Methodology
2.1. Statistics
The statistics of COVID-related data from China, Singapore and the United States was quoted from Our World in Data at https://ourworldindata.org/coronavirus. The Gross Domestic Product (GDP) growth rate of China, Singapore and the United States was quoted from Trading Economics at https://tradingeconomics.com.
2.2. Methods
2.2.1. GDP and COVID. Using R/R Studio, the relationship of GDP growth rate of Singapore against number of confirmed cases (cumulative) in Singapore can be investigated. The GDP growth rate is an indicator of a country’s economic status, and the number of confirmed cases shows the extent of the virus spreading in the country. Therefore, they are expected to follow the expression below where G represents GDP growth rate, N represents number of confirmed cases, k and c are constant.
\( G=-kN+c\ \ \ ( AUTONUM \* Arabic ) \)
Similar approaches are to be used for China and the United States, which should follow the same trend.
2.2.2. Vaccination and COVID. Using R/R Studio, the number of confirmed cases (cumulative) in Singapore and fatality rate (seven-day rolling average) in Singapore can be investigated. The number of confirmed cases is expected to grow proportionally while fatality rate is expected to decrease proportionally. Therefore, they are expected to follow the expression below where C represents the number of confirmed cases, F represents the fatality rate, D represents the number of days after the outbreak of COVID-19, p, q, i and j are constant.
\( C=pD+q\ \ \ ( AUTONUM \* Arabic ) \)
\( F=-iD+j\ \ \ ( AUTONUM \* Arabic ) \)
Similar approaches are to be used for China and the United States, which should follow the same trend.
3. Results and discussions
3.1. GDP and COVID
3.1.1. Results. The result for GDP growth rate against number of conformed cases (cumulative) in Singapore is shown below in Figure. 1. The data for GDP growth rate of Singapore is showed in Table 1.
Table 1. GDP growth rate of SG (in percentage).
Year/Season | 1st | 2nd | 3rd | 4th |
2020 | -0.1 | -12.6 | 9.2 | 3.8 |
2021 | 3 | -0.8 | 1.5 | 2.3 |
2022 | 0.8 | -0.1 | 1.1 | 0.1 |
|
Figure 1. GDP growth rate against number of confirmed cases (cumulative) in SG. |
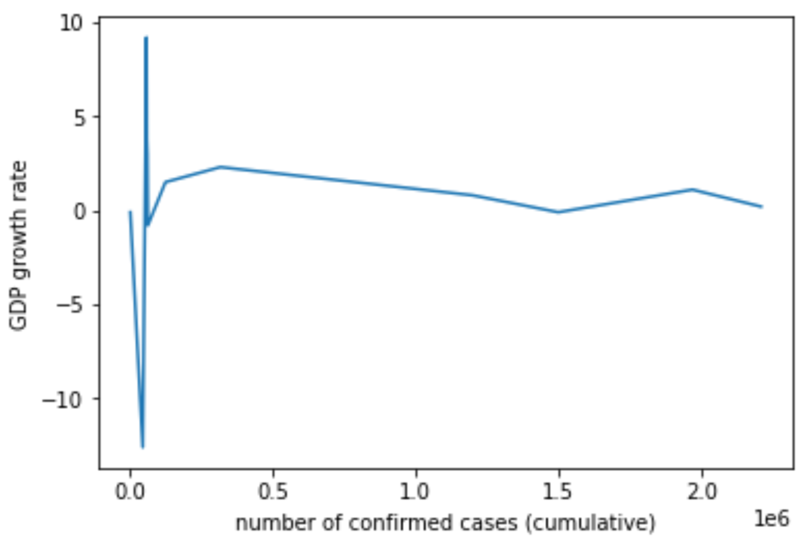
Using the formula mentioned at (1), \( {k_{SG }} \) and \( {c_{SG}} \) are calculated to be approximately zero. This seems to show that there is no correlation between Singapore’s economic status and extent of the virus spreading. However, there exists a very weird ripple at the beginning of the pandemic where the GDP growth rate suddenly dropped at -12.6%, followed by a sudden increase to 9.2%. This suggests that Singapore’s economy was only affected at the start of COVID-19 and quickly recovered within a season.
The result for GDP growth rate against number of conformed cases (cumulative) in China is shown below in Figure. 2. The data for GDP growth rate of China is showed in Table 2.
Table 2. GDP growth rate of CN (in percentage).
Year/Season | 1st | 2nd | 3rd | 4th |
2020 | -10.1 | 11.6 | 3.2 | 2.4 |
2021 | 0.8 | 1.4 | 0.4 | 1.3 |
2022 | 1.6 | -2.7 | 3.9 | 0 |
|
Figure 2. GDP growth rate against number of confirmed cases (cumulative) in CN. |
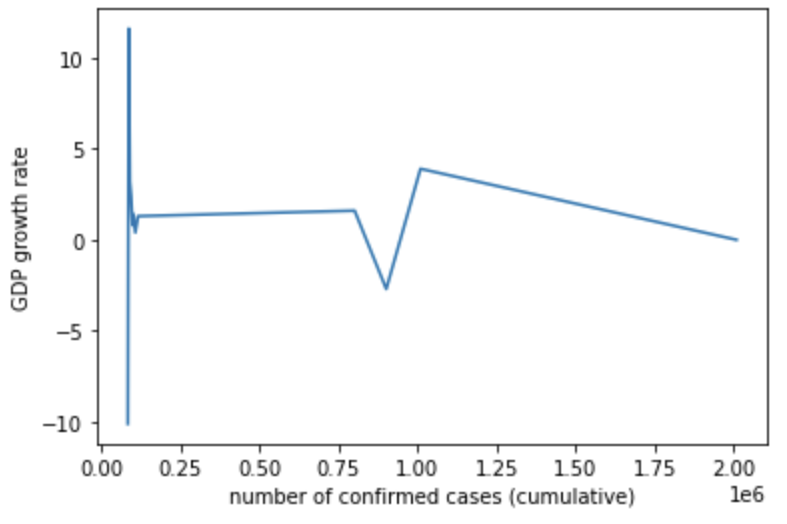
Using the formula mentioned at (1), \( {k_{CN }} \) is calculated to be approximately zero and \( {c_{CN}} \) is calculated to be around 1. While this correlation follows the same trend of Singapore, the value of c being at 1 suggests that China’s economy was steadily growing at around 1%. Similarly, there exists a suddenly decrease in the GDP growth rate at -10.1% during the start of the pandemic, followed by a sudden increase to 11.6%. Moreover, another round of attack was seen during the peak of the pandemic, with a sudden drop of GDP growth rate to -2.7%. This suggests that China’s economy was deeply affected at the start of COVID-19, slightly affected during the peak of COVID-19 but generally kept at a constant growing trend.
The result for GDP growth rate against number of conformed cases (cumulative) in the United States is shown below in Figure. 3. The data for GDP growth rate of the United States is showed in Table 3.
Table 3. GDP growth rate of the US (in percentage).
Year/Season | 1st | 2nd | 3rd | 4th |
2020 | -4.6 | -29.9 | 35.3 | 3.9 |
2021 | 6.3 | 7 | 2.7 | 7 |
2022 | -1.6 | -0.6 | 3.2 | 2.9 |
Using the formula mentioned at (1), \( {k_{US }} \) is calculated to be approximately zero and \( {c_{US}} \) is calculated to be around 2. This shows that the US’s economy was generally increasing at around 2%. Similarly, there exists a suddenly decrease in the GDP growth rate at -29.9% during the start of the pandemic but slightly later than China and Singapore, followed by a sudden increase to 35.5%. This suggests that the US’s economy experienced the decline later than Asian countries at a greater magnitude but still recovered quickly within a few months.
To conclude, all data from Singapore, China and the United States shows that there is no direct linear relation between the economic growth and extent of COVID infection. However, it is shown that all the countries experienced a major economic decline at the start of the pandemic but with different scales.
3.1.2. Discussions. The results show that all countries only suffered an economic recession shortly after the outbreak of the pandemic and quickly recovered. However, the magnitude of the recession and recovery can be further explored and discussed.
Among the three countries, the United States experienced the recession to the biggest extent, followed by Singapore and then China. This trend follows that of the number of the infected patients which the United States has the highest, followed by Singapore and then China within the first 6 months. Therefore, a corelation between the economy and the number of confirmed cases can be established that the higher the number of confirmed cases, the more badly the economic downturn.
To further relate the results to the policies of respective countries, the United States experienced the biggest recession due to the nature of its market which heavily relies on international trades which were nearly cut down during the pandemic and the lack of government’s efforts in subsidising the smaller companies and individual American citizen. Uniquely, the United States experienced the recession later than the other two, only at the second season due to the fact that the virus has not widely spread in the US until the second season in 2020. Afterwards, the relatively liberal boarder control of the United States boosted the spread of the virus throughout the country so quickly that most of the small business cannot survive through. Singapore experienced a recession to a relatively big extent due to the similar fact that Singapore served as an international financial centre and its heavy reliance on service and tourism industries was largely restricted during the pandemic. However, Singapore’s government was successful in utilizing its budget to support the local companies and every citizen. China experienced the least significant recession as its economy was largely based on domestic trades and consumption which were rarely affected during the pandemic. Moreover, despite being costly, China’s zero policy successful controlled the spread of the virus at the beginning of the pandemic so that people’s lives and the local market were not affected.
3.2. Vaccination and COVID
3.2.1. Results. The data for number of people vaccinated in Singapore is showed in Table 4. The result for number of conformed cases (cumulative) against the number of days after the outbreak of COVID-19 in Singapore is shown below in Fig.4. The result for fatality rate (7-day rolling average) against the number of days after the outbreak of COVID-19 in Singapore is shown below in Fig. 5.
Table 4. Number of people vaccinated cumulative in SG (in million).
Year/season | 1st | 2nd | 3rd | 4th |
2021 | 0.92 | 3.37 | 4.70 | 4.86 |
2022 | 5.11 | 5.13 | 5.14 | 5.16 |
|
Figure 4. Number of conformed cases (cumulative) against time in SG. |
|
Figure 5. Fatality rate (7-day rolling average) against time in SG. |

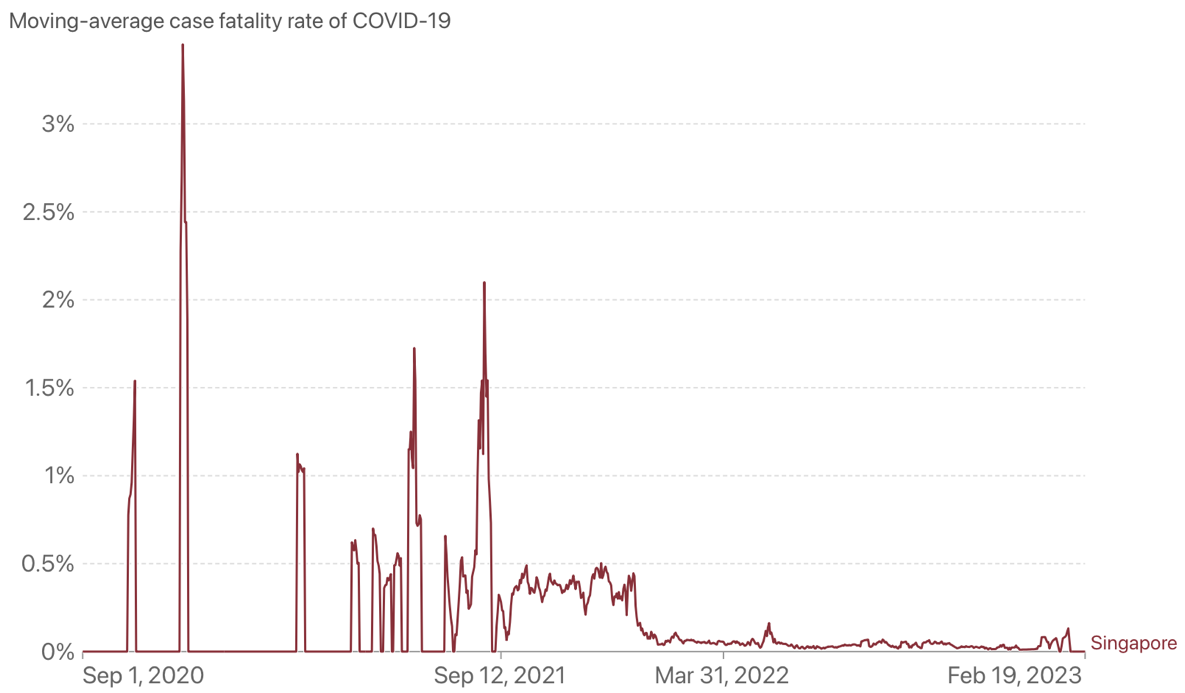
The number of people vaccinated in Singapore increased rapidly in 2021 while remained almost unchanged in 2022. Using the formula mentioned in (2) and (3), \( {p_{SG }} \) is around 3000, \( {q_{SG}} \) is around -1500000, \( {i_{SG }} \) is approximately 0.005 and \( {j_{SG }} \) is approximately 2.5. Therefore, the number of confirmed cases increases proportionally to time and the fatality rate decreases proportionally to time in general. However, the number of confirmed cases shows little increase before September 2021 and great increase after that while the fatality rate gradually became steady after September 2021.
The data for number of people vaccinated in Singapore is showed in Table 5. The result for number of conformed cases (cumulative) against the number of days after the outbreak of COVID-19 in China is shown below in Fig.6. The result for fatality rate (7-day rolling average) against the number of days after the outbreak of COVID-19 in China is shown below in Fig. 7.
Table 5. Number of people vaccinated cumulative in CN (in million).
Year/season | 1st | 2nd | 3rd | 4th |
2021 | NA | 622.00 | 1100 | 1260 |
2022 | 1280 | 1290 | 1300 | 1310 |
|
Figure 6. Number of conformed cases (cumulative) against time in CN. |
|
Figure 7. Fatality rate (7-day rolling average) against time in CN. |
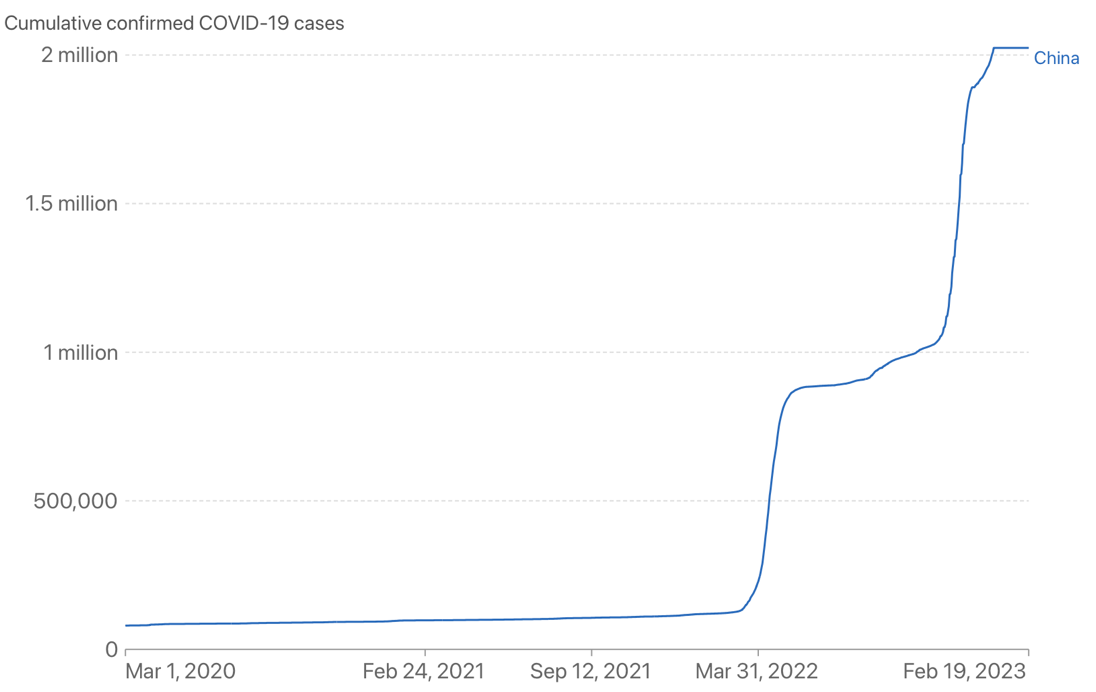
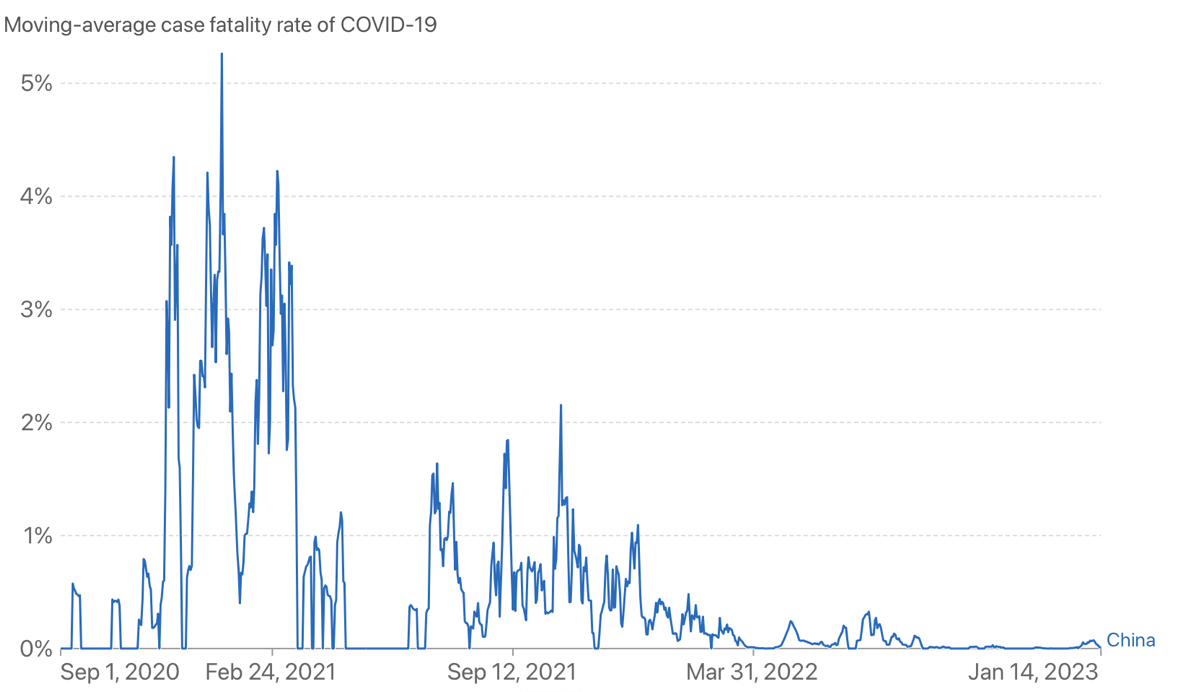
The number of people vaccinated in China increased rapidly in third season 2021 while remained almost unchanged in 2022. Using the formula mentioned in (2) and (3), \( {p_{CN }} \) is around 2200, \( {q_{CN}} \) is around -460000, \( {i_{CN }} \) is approximately 0.005 and \( {j_{CN }} \) is approximately 2.7. Therefore, the number of confirmed cases increases proportionally to time and the fatality rate decreases proportionally to time in general. However, the number of confirmed cases shows rapid increase in April 2022 and December 2022.
The data for number of people vaccinated in the United States is showed in Table 6. The result for number of conformed cases (cumulative) against the number of days after the outbreak of COVID-19 in the US is shown below in Fig.8. The result for fatality rate (7-day rolling average) against the number of days after the outbreak of COVID-19 in the US is shown below in Fig. 9.
Table 6. Number of people vaccinated cumulative in the US (in million).
Year/season | 1st | 2nd | 3rd | 4th |
2021 | 108.72 | 183.36 | 215.22 | 243.84 |
2022 | 255.62 | 259.98 | 264.36 | 268.44 |
|
Figure 8. Number of conformed cases (cumulative) against time in the US. |

The number of people vaccinated in the United States increased steadily throughout 2021 and 2022. Using the formula mentioned in (2) and (3), \( {p_{US }} \) is around 90000, \( {q_{US}} \) is around 0, \( {i_{US }} \) is approximately 0.001 and \( {j_{US }} \) is approximately 2.1. Therefore, the number of confirmed cases increases proportionally to time. However, the fatality rate shows no direct relation with respect to time.
3.2.2. Discussion. The results show that both Singapore and China had nearly the whole population vaccinated in a relatively short period of time while the US had only a proportion of the population vaccinated relatively slowly. As a result, the US experienced the steepest increase in confirmed cases and an unsteady fatality rate while Singapore and China were able to control the spread of virus and its mortality to a large extent.
Singapore’s government provided free vaccines and posed strict restrictions upon unvaccinated citizens to promote vaccination. Over 90 percent of the population were vaccinated before September 2021 and then the government decided to ease COVID restriction. Therefore, this explains the reasons why the number of confirmed cases shows great increase after September 2021 while the fatality rate gradually became steady after September 2021. China’s government also provided free vaccines and used a set of measures to encourage vaccination. Similarly, the number of confirmed cases shows great increase twice when China eased restrictions while the fatality rate gradually became steady after March 2022. The United States’ government offered limited subsidies for vaccines and posed no restrictions at all. With the lack of government’s efforts, the number of confirmed cases showed steep increase throughout years and facility rate remained unstable.
4. Conclusion
In conclusion, the policies of the United States, Singapore and China suited their respective purposes and were successful in different ways. The United States was relatively liberal in dealing with the pandemic due to the nature of the free market. Singapore practiced paternalism including the circuit breaker during the peak of the pandemic and forced vaccination as to protect every citizen in Singapore. China maintained the measure of total lockdown almost throughout the pandemic and successfully minimise the death rate and infection rate.
While there are still several countries suffering badly because of COVID-19 such as Indonesia, Algeria and other less developed countries, rapidly recovering countries could provide assistance in terms of vaccinations and medical resources to minimise the loss of these countries. In the face of future potential threats of world-wide pandemic, country should work more closely together to share the resources and information. Country should also be clearer about their priorities such as the safety of its citizens or the health of its economy in order to implement respective policies suitable to the countries’ status and ability.
References
[1]. Wu Y C, Chen C S, Chan Y J. The outbreak of COVID-19: An overview. J Chin Med Assoc, 2020, 83(3): 217-220.
[2]. Isaac I Bogoch, et al. Potential for global spread of a novel coronavirus from China. Journal of Travel Medicine, 2020.
[3]. Wang, Weier, Jianming Tang, Fangqiang Wei. Updated understanding of the outbreak of 2019 novel coronavirus (2019‐nCoV) in Wuhan, China. Journal of medical virology, 2020, 441-447.
[4]. Inoue, Hajime. Japanese strategy to COVID-19: How does it work? Global Health & Medicine, 2020, 131-132.
[5]. Akbulaev, Nurkhodzha,Ilkin Mammadov, Vasif Aliyev. Economic impact of COVID-19. Sylwan, 2020.
[6]. Khafaie M A, Rahim F. Cross-Country Comparison of Case Fatality Rates of COVID-19/SARS-COV-2. Osong Public Health Res Perspect, 2020, 11(2): 74-80.
[7]. Larrauri, Blas, Alejandro Malbran, Jose A, Larrauri. Omicron and vaccines: An analysis on the decline in COVID-19 mortality. MedRxiv, 2022.
[8]. Lone, Shabir Ahmad, Aijaz Ahmad. COVID-19 pandemic–an African perspective. Emerging microbes & infections, 2020, 1300-1308.
[9]. Lau, Hien, et al. The positive impact of lockdown in Wuhan on containing the COVID-19 outbreak in China. Journal of travel medicine, 2020.
[10]. Jacinta I, et al. COVID-19 and Singapore: from early response to circuit breaker. Ann Acad Med Singapore, 2020, 561-572.
[11]. Meng, Zhigang, Shoujin Shan, Ruilian Zhang. China’s COVID-19 vaccination strategy and its impact on the global pandemic. Risk Management and Healthcare Policy, 2021, 4649-4655.
[12]. Loo, Ke-Yan, et al. COVID-19: An updated situation from Singapore. Progress In Microbes & Molecular Biology, 2021.
Cite this article
Wang,Y. (2023). COVID-19 policies: Analysis and implication. Theoretical and Natural Science,6,158-167.
Data availability
The datasets used and/or analyzed during the current study will be available from the authors upon reasonable request.
Disclaimer/Publisher's Note
The statements, opinions and data contained in all publications are solely those of the individual author(s) and contributor(s) and not of EWA Publishing and/or the editor(s). EWA Publishing and/or the editor(s) disclaim responsibility for any injury to people or property resulting from any ideas, methods, instructions or products referred to in the content.
About volume
Volume title: Proceedings of the International Conference on Modern Medicine and Global Health (ICMMGH 2023)
© 2024 by the author(s). Licensee EWA Publishing, Oxford, UK. This article is an open access article distributed under the terms and
conditions of the Creative Commons Attribution (CC BY) license. Authors who
publish this series agree to the following terms:
1. Authors retain copyright and grant the series right of first publication with the work simultaneously licensed under a Creative Commons
Attribution License that allows others to share the work with an acknowledgment of the work's authorship and initial publication in this
series.
2. Authors are able to enter into separate, additional contractual arrangements for the non-exclusive distribution of the series's published
version of the work (e.g., post it to an institutional repository or publish it in a book), with an acknowledgment of its initial
publication in this series.
3. Authors are permitted and encouraged to post their work online (e.g., in institutional repositories or on their website) prior to and
during the submission process, as it can lead to productive exchanges, as well as earlier and greater citation of published work (See
Open access policy for details).
References
[1]. Wu Y C, Chen C S, Chan Y J. The outbreak of COVID-19: An overview. J Chin Med Assoc, 2020, 83(3): 217-220.
[2]. Isaac I Bogoch, et al. Potential for global spread of a novel coronavirus from China. Journal of Travel Medicine, 2020.
[3]. Wang, Weier, Jianming Tang, Fangqiang Wei. Updated understanding of the outbreak of 2019 novel coronavirus (2019‐nCoV) in Wuhan, China. Journal of medical virology, 2020, 441-447.
[4]. Inoue, Hajime. Japanese strategy to COVID-19: How does it work? Global Health & Medicine, 2020, 131-132.
[5]. Akbulaev, Nurkhodzha,Ilkin Mammadov, Vasif Aliyev. Economic impact of COVID-19. Sylwan, 2020.
[6]. Khafaie M A, Rahim F. Cross-Country Comparison of Case Fatality Rates of COVID-19/SARS-COV-2. Osong Public Health Res Perspect, 2020, 11(2): 74-80.
[7]. Larrauri, Blas, Alejandro Malbran, Jose A, Larrauri. Omicron and vaccines: An analysis on the decline in COVID-19 mortality. MedRxiv, 2022.
[8]. Lone, Shabir Ahmad, Aijaz Ahmad. COVID-19 pandemic–an African perspective. Emerging microbes & infections, 2020, 1300-1308.
[9]. Lau, Hien, et al. The positive impact of lockdown in Wuhan on containing the COVID-19 outbreak in China. Journal of travel medicine, 2020.
[10]. Jacinta I, et al. COVID-19 and Singapore: from early response to circuit breaker. Ann Acad Med Singapore, 2020, 561-572.
[11]. Meng, Zhigang, Shoujin Shan, Ruilian Zhang. China’s COVID-19 vaccination strategy and its impact on the global pandemic. Risk Management and Healthcare Policy, 2021, 4649-4655.
[12]. Loo, Ke-Yan, et al. COVID-19: An updated situation from Singapore. Progress In Microbes & Molecular Biology, 2021.