


1. Introduction
1.1. Background
The NACA airfoils are a series of airfoils proposed by the National Advisory Committee for Aeronautics (NACA) in the U.S., where each airfoil is assigned a four-digit number that describes its geometric properties. The first digit represents the camber in percent of the chord, the second digit describes the distance between the maximum camber and the leading edge of the airfoil, in tenths of the chord, and the last two digits indicate the ratio between the maximum thickness and the chord length, in percentage [1]. The NACA 0012 airfoil is a symmetric airfoil, which has no camber, with a maximum thickness of 12% of the chord. It is a standard airfoil that is significant in aerodynamic research, and is commonly used as a CFD benchmark. Its section is also commonly used on helicopter blades and airplane tails [2].
CFD, or Computational Fluid Dynamics, plays an important role in aerodynamic design, since it can reduce the experimental wind-tunnel tests and hence reduce the research cost [3]. The modern turbulence models, such as k-ω SST, k-ε, LES, LBM, etc., has already been developed to accurately predict aerodynamic coefficients [4].
Beyond research on single airfoil, scientists are now taking accounts of studying tandem-wing configurations. The tandem-wing configurations can enhance the airfoils’ aerodynamic performance over single airfoil configuration [5]. It also offers potential benefits, such as increasing the lift to drag ratio of the downstream wing due to wake interactions. When a higher lift to drag ratio is attained, the aircraft will gain more lift and less drag, and thus reduce the amount of energy required for flights [6, 7].
1.2. Previous studies
Researchers have put huge effort into studying the behavior of NACA 0012 airfoil, using various methods. Khalid (2022) applied CFD on analyzing the relationship between the angle of attack (AoA) and the lift coefficient of one airfoil, and reached a result that the lift coefficient reaches its maximum value at AoA = 14° [6]. In 2018, Li compared the performance of smooth and rough airfoils [8]. Kurtulus in 2019 studied the lift to drag ratio of a pitching airfoil at low Reynolds number, which helped understanding the flapping airfoil vortex formation [9].
Previous studies on tandem airfoil configurations show that axial spacing and phase difference between oscillating airfoils critically influence downstream lift and drag cycles, since upstream wake disrupts or energizes the downstream boundary layer. In 2011, Lee discovered that two in-tandem NACA 0012 airfoils oscillating sinusoidally with a phase difference of 180° will improve the downstream performance significantly, compared to the in-phase motion [7].
However, most studies on one airfoil only consider the flapping motion or the pitching motion individually, instead of a multi-step analysis. Also, the studies on tandem airfoils only consider limited phase differences between the two motions, where the phase differences except 0 or π may have better performance. Moreover, most studies fail to build the connection between the distance between the tandem airfoils, the phase difference between the pitching motion of two airfoils, and the lift to drag ratio, which is important on understanding how the vortices produced by the front airfoil affect the rear airfoil. Finally, a lot of previous research considers the lift force and drag force individually, instead of analyzing the lift to drag ratio. However, simply maximizing the lift force may not reach an optimal configuration that minimizes the energy, since the drag force could still be high.
1.3. Contribution
This research uses COMSOL Multiphysics to conduct 2D CFD simulations on the NACA 0012 airfoils, and aimed to reach an optimal configuration that maximizes the lift to drag ratio of the airfoils. This research first simulates one airfoil that has a linear motion and a rotational motion, to get the optimal amplitude of rotational motion and the optimal phase difference between the two motions. It then simulates two airfoils, placed one behind another, with the motions obtained in the simulation of one airfoil. The study further quantifies how the phase difference in the linear motions of the two airfoils under different distances between the two airfoils affects the maximum lift to drag ratio of two airfoils, and the relative L/D enhancement of the downstream wing (rear airfoil) compared to the upstream wing (front airfoil).
This research contributes to deepening the understanding of wake‐induced aerodynamic interactions and to the study of energy harvesting devices for airfoils. It is also useful in guiding the design new aircrafts, such as the aircrafts with multi‐wing systems.
2. Methodology and results
2.1. Setup
The computational domain of the experiment is a rectangular region with a size of 20 m × 8 m, centered at the origin. The chord length of a standard NACA 0012 airfoil is c = 1.8 m. Laminar flow with a free-stream velocity of U∞ = 0.01 m/s is used as the flow field, with a free-stream density of ρ∞ = 1.225 kg/m3, and a dynamic viscosity of μ∞ = 1.83 × 10⁻⁵ kg/(m·s). The Reynolds number is calculated by
The inlet velocity of the rectangular region is set to be U∞, entering from the left boundary (Figure 1), while the outlet pressure is p0 = 0 Pa, which is the boundary condition of the right side (Figure 1). The AoA of the airfoil is denoted by α. Moreover, the lift force, L, is calculated by the line integration over the airfoil:
Similarly, the drag force, D, is calculated as:
Where Tx and Ty are the total stress on the x and y direction, respectively [10].
2.2. Single airfoil
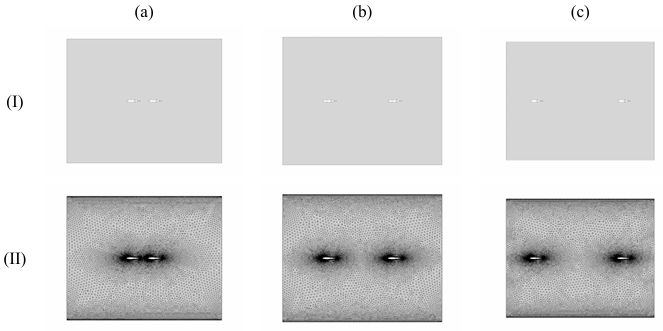
The airfoil is centered at the origin. The mesh grid for computation is chosen to be “Extra Fine” airfoil in the COMSOL. The geometry of the computation domain and the mesh grid are shown in Figure 1.
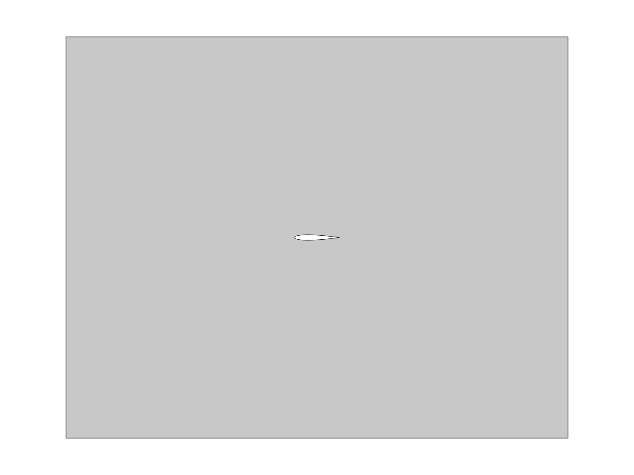
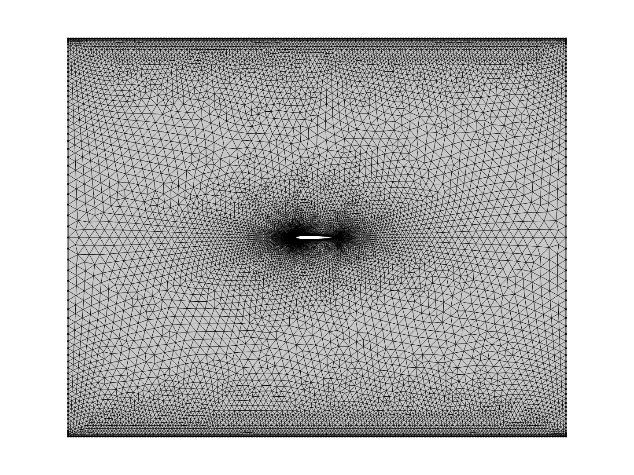
Figure 1. The geometry (a) and the mesh grid (b)
The airfoil has a linear (flapping) motion and a rotational motion, where linear motion means that the airfoil moves periodically along the y direction, and the rotational motion means that the airfoil rotates periodically along an axis perpendicular to the plane for simulation and locate at the leading edge of the airfoil. The linear motion is described by
and the rotational motion can be achieved by changing the angle of attack of the airfoil which is described by
where t represents the time, A is the amplitude of the rotational motion, φ is the phase difference between two motions, and ω in both formulas represent the angular frequency of the periodic motions. This experiment aims to maximize the average lift to drag ratio, L/D, in one period, by varying A and φ, with three angular frequencies, 1, 10, and 100.
The simulations are conducted using COMSOL, with a time-dependent solver. The experiments are conducted within one period of the motion of the airfoil, and the time steps are set to be 0.05/ω seconds. Each pair of parameters will have 125 data points, and their average lift to drag ratio is recorded.
Firstly, fix φ = 0 and change the amplitude A. Choosing A to be the integers between and including 0 and 20, the average lift to drag ratios are reached as results, and are recorded in Table 1 below.
|
A |
ω = 1 |
ω = 10 |
ω = 100 |
|
0 |
3.722674121 |
3.73214023 |
3.730519272 |
|
1 |
3.738244397 |
3.739019206 |
3.73703 |
|
2 |
3.781346859 |
3.760435982 |
3.779777612 |
|
3 |
3.816927684 |
3.801754116 |
3.8085023 |
|
4 |
3.883516989 |
3.863284797 |
3.870589245 |
|
5 |
3.974840348 |
3.94806334 |
3.956042848 |
|
6 |
4.095706977 |
4.060521094 |
4.069417363 |
|
7 |
4.253234861 |
4.207517324 |
4.217544254 |
|
8 |
4.458867946 |
4.39941014 |
4.41087658 |
|
9 |
4.730403985 |
4.652838878 |
4.666181489 |
|
10 |
5.098394967 |
4.995867753 |
5.011673714 |
|
11 |
5.543182807 |
5.480313813 |
5.499621908 |
|
12 |
5.570041301 |
5.587362643 |
5.607275359 |
|
13 |
5.484799572 |
5.373272266 |
5.392208407 |
|
14 |
5.51335871 |
5.370508588 |
5.388626474 |
|
15 |
4.615866586 |
5.216086922 |
5.232713235 |
|
16 |
4.021895264 |
4.224253071 |
4.239520882 |
|
17 |
3.694689083 |
3.371218663 |
3.602772025 |
|
18 |
3.37495853 |
3.224946881 |
3.297029522 |
|
19 |
3.085926282 |
2.999569 |
2.927467365 |
|
20 |
2.902725426 |
2.714709168 |
2.731090953 |
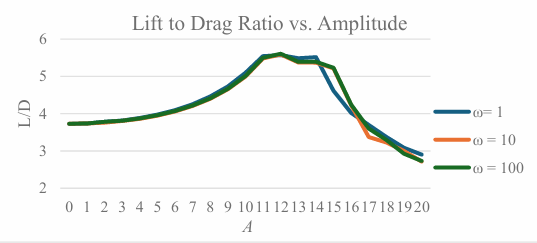
By Table 1, whatever ω is, the maximum lift to drag ratio exists at A = 12.
Now fix A = 12 and set
|
φ |
ω = 1 |
ω = 10 |
ω = 100 |
|
0 |
5.570041301 |
5.587362643 |
5.607275359 |
|
π/4 |
4.926455315 |
6.075638056 |
6.007606719 |
|
π/2 |
5.658998075 |
5.255302792 |
5.189354825 |
|
3π/4 |
6.31876983 |
6.356162781 |
6.383122899 |
|
π |
6.214805854 |
6.324521303 |
6.347124715 |
|
5π/4 |
5.807823342 |
5.308351854 |
5.129511082 |
|
3π/2 |
6.031711709 |
5.342416051 |
5.130810766 |
|
7π/4 |
6.167781977 |
6.173532397 |
6.073788058 |
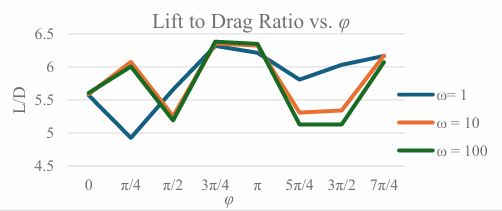
By Table 2, the lift to drag ratio is maximized at φ = 3π/4. Hence, the optimal choices of the amplitude and phase difference are A = 12, φ = 3π/4. The flow field of the optimal choices are shown in Figure 4.
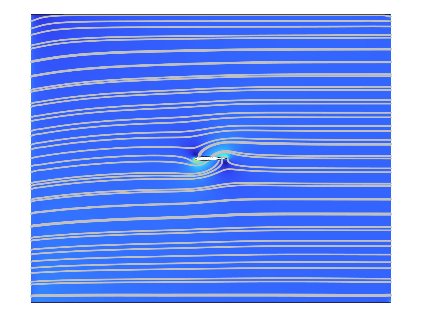
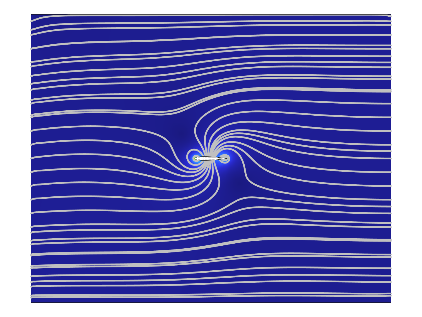
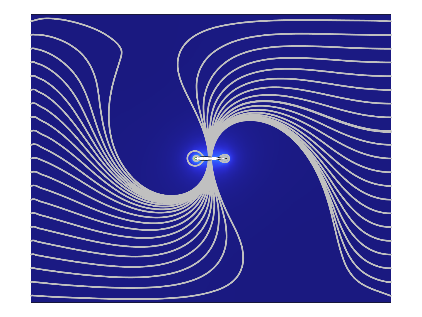
Figure 4. The flow field for single airfoil with ω = 1 (a), 10 (b), 100 (c), with A = 12 and φ = 3π/4, at time t = 0s
2.3. Dual airfoil system
This experiment explores two identical airfoils, placed one behind another, with a distance ℓ measured from the front airfoil’s tail to the back airfoil's tail. The distance ℓ was chosen to be 2.8, 6.8, and 11.8 meters. The configurations are shown in Figure 5.
Each of the airfoils has a periodical linear motion and rotational motion. In this case, there is a phase difference ψ between two airfoils’ linear motion. That is, the airfoil in the front has a linear motion described by
while the airfoil at the back has a linear motion described by
Furthermore, the rotational motion is
Here the phase difference between the rotational motion and the linear motion is chosen to be 7π/4, since when φ = 3π/4, the COMSOL cannot generate convergent solutions.
In this experiment, the lift to drag ratio is maximized by varying the phase difference between two airfoils, ψ. The experiment was conducted under different distance between two airfoils, ℓ, and the angular frequency, ω. As a result, a dimensionless parameter is introduced here:
so that the experiment was conducted under different t*. The values of ω (in s-1) are chosen to be 10, 50, and 100. The phase different, ψ, was chosen to be 0, π/4, π/2, π, and 3π/2.
All values of t* are shown in Table 3 below.
|
ℓ (m) ω |
2.8 |
6.8 |
11.8 |
|
10 |
2800 |
6800 |
11800 |
|
50 |
14000 |
34000 |
59000 |
|
100 |
28000 |
68000 |
118000 |
In this case the lift to drag ratios of the two airfoils are calculated separately, by linear integration on each airfoil. The time intervals for simulation are the same as in the single airfoil case.
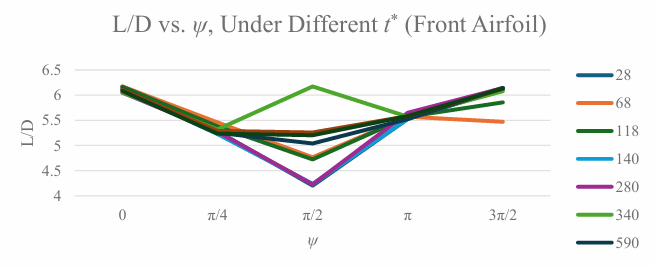
The lift to drag ratio of the front airfoil is shown in Table 4 and Figure 6.
|
t* ψ |
2800 |
6800 |
11800 |
14000 |
28000 |
34000 |
59000 |
68000 |
118000 |
|
0 |
6.160 |
6.173 |
6.168 |
6.114 |
6.048 |
6.052 |
6.122 |
6.110 |
6.085 |
|
π/4 |
5.281 |
5.459 |
5.380 |
5.226 |
5.272 |
5.319 |
5.252 |
5.291 |
5.237 |
|
π/2 |
4.202 |
4.765 |
4.723 |
4.236 |
4.227 |
6.173 |
5.040 |
5.258 |
5.203 |
|
π |
5.530 |
5.570 |
5.572 |
5.529 |
5.652 |
5.572 |
5.525 |
5.584 |
5.585 |
|
3π/2 |
6.118 |
6.168 |
5.856 |
6.143 |
6.142 |
6.080 |
6.144 |
6.130 |
6.132 |
The lift to drag ratio of the back airfoil is shown in Table 5 and Figure 6.
|
t* φ |
2800 |
6800 |
11800 |
14000 |
28000 |
34000 |
59000 |
68000 |
118000 |
|
0 |
6.174 |
6.168 |
6.167 |
6.130 |
6.154 |
6.153 |
6.122 |
6.080 |
6.117 |
|
π/4 |
5.897 |
6.139 |
6.156 |
6.070 |
6.097 |
6.141 |
6.097 |
6.137 |
6.070 |
|
π/2 |
6.045 |
6.139 |
6.165 |
6.111 |
6.089 |
6.091 |
6.148 |
6.140 |
6.117 |
|
π |
6.156 |
6.160 |
6.167 |
6.066 |
6.144 |
6.154 |
6.124 |
6.151 |
6.080 |
|
3π/2 |
6.140 |
6.113 |
6.188 |
6.213 |
6.204 |
6.171 |
6.170 |
6.132 |
6.141 |
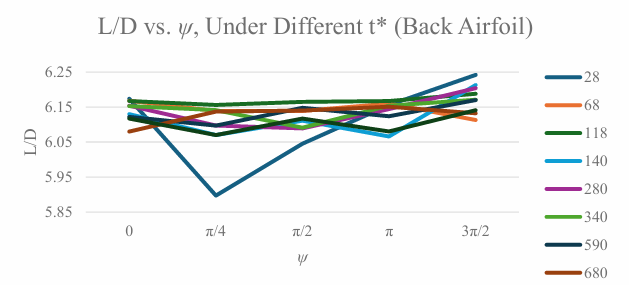
Table 4 and Table 5 show that, in most cases, the lift to drag ratios of the rear airfoil are larger than these of the front airfoil; and that the lift to drag ratios are maximized when ψ = 3π/2. The flow field of several situations are shown in Figure 8 below.
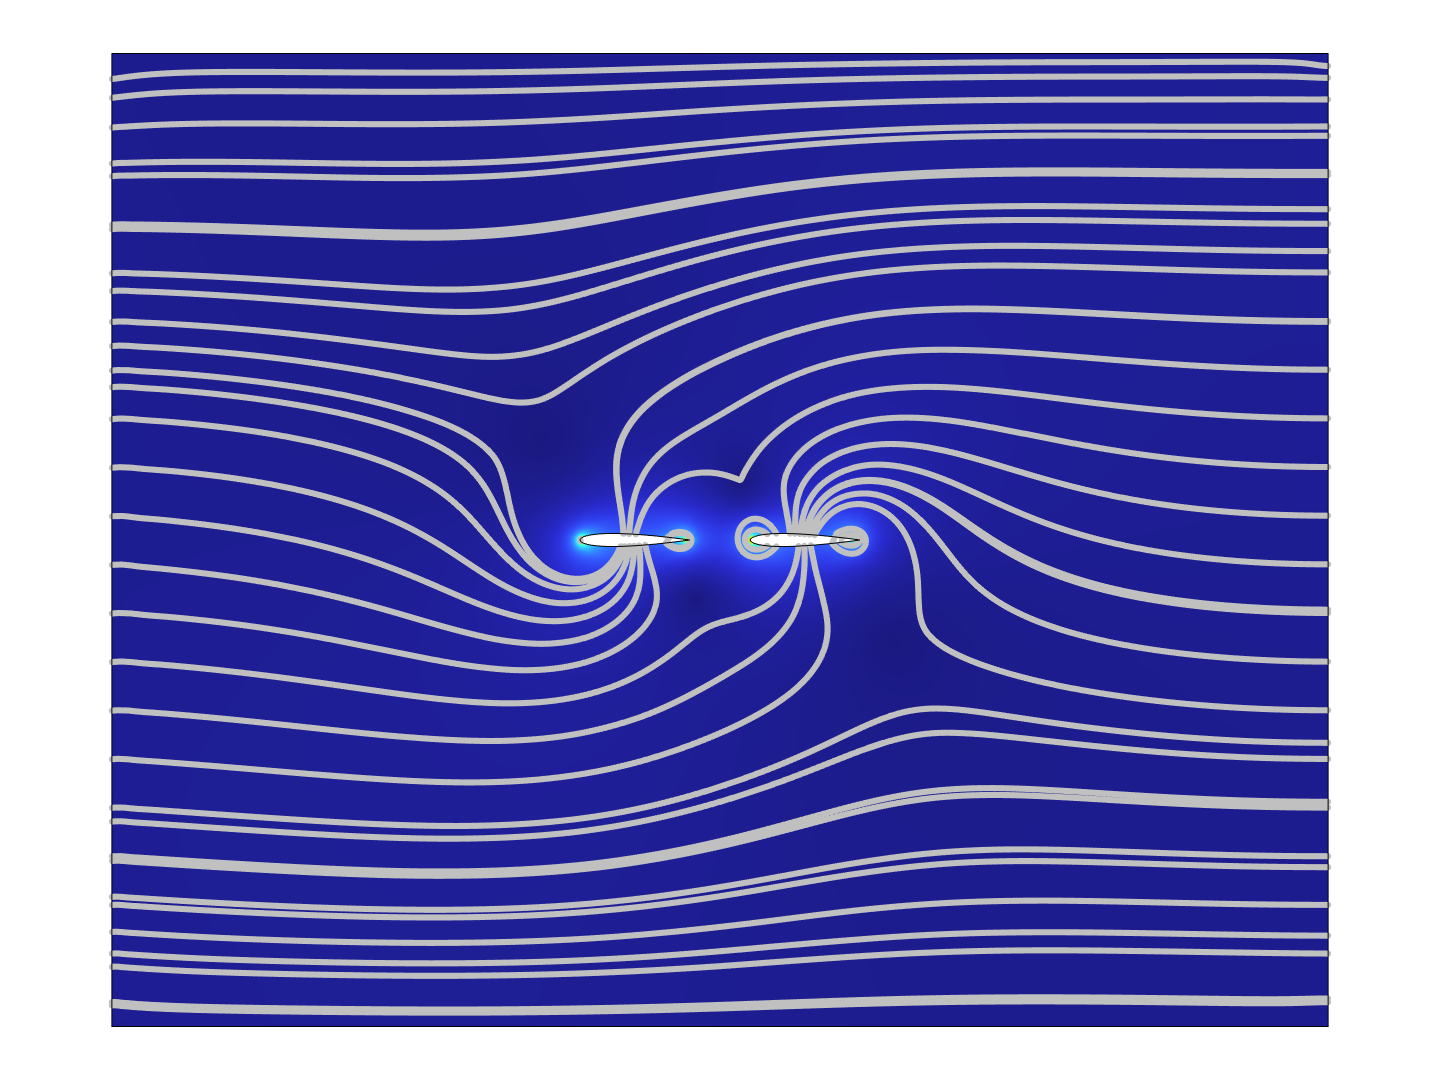
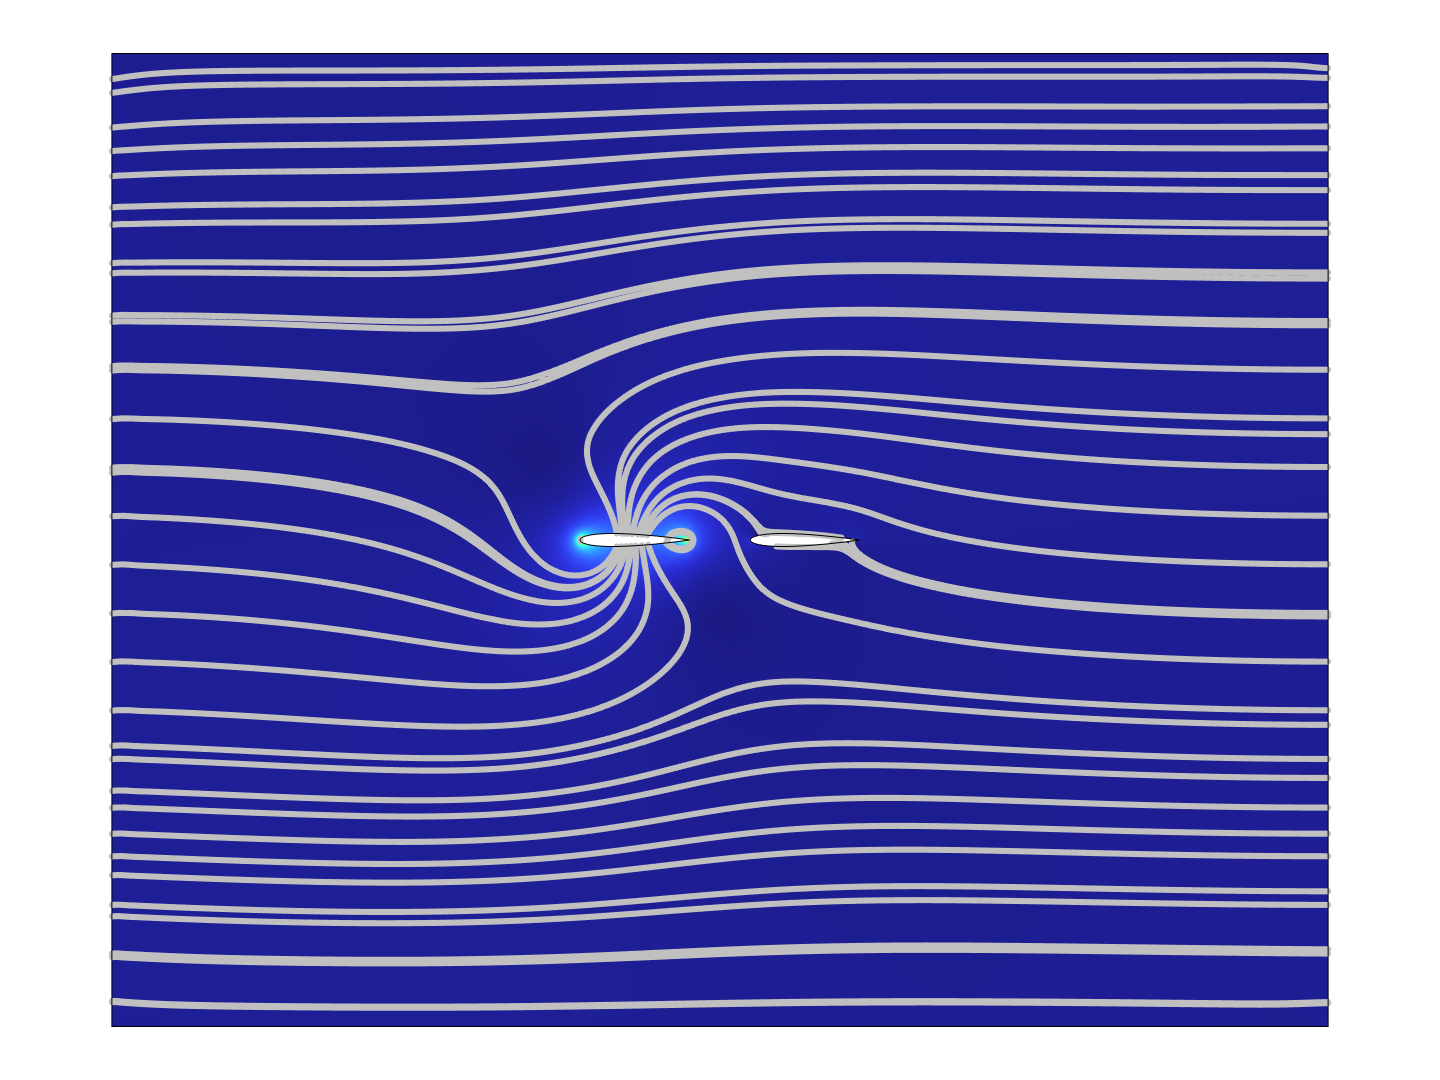
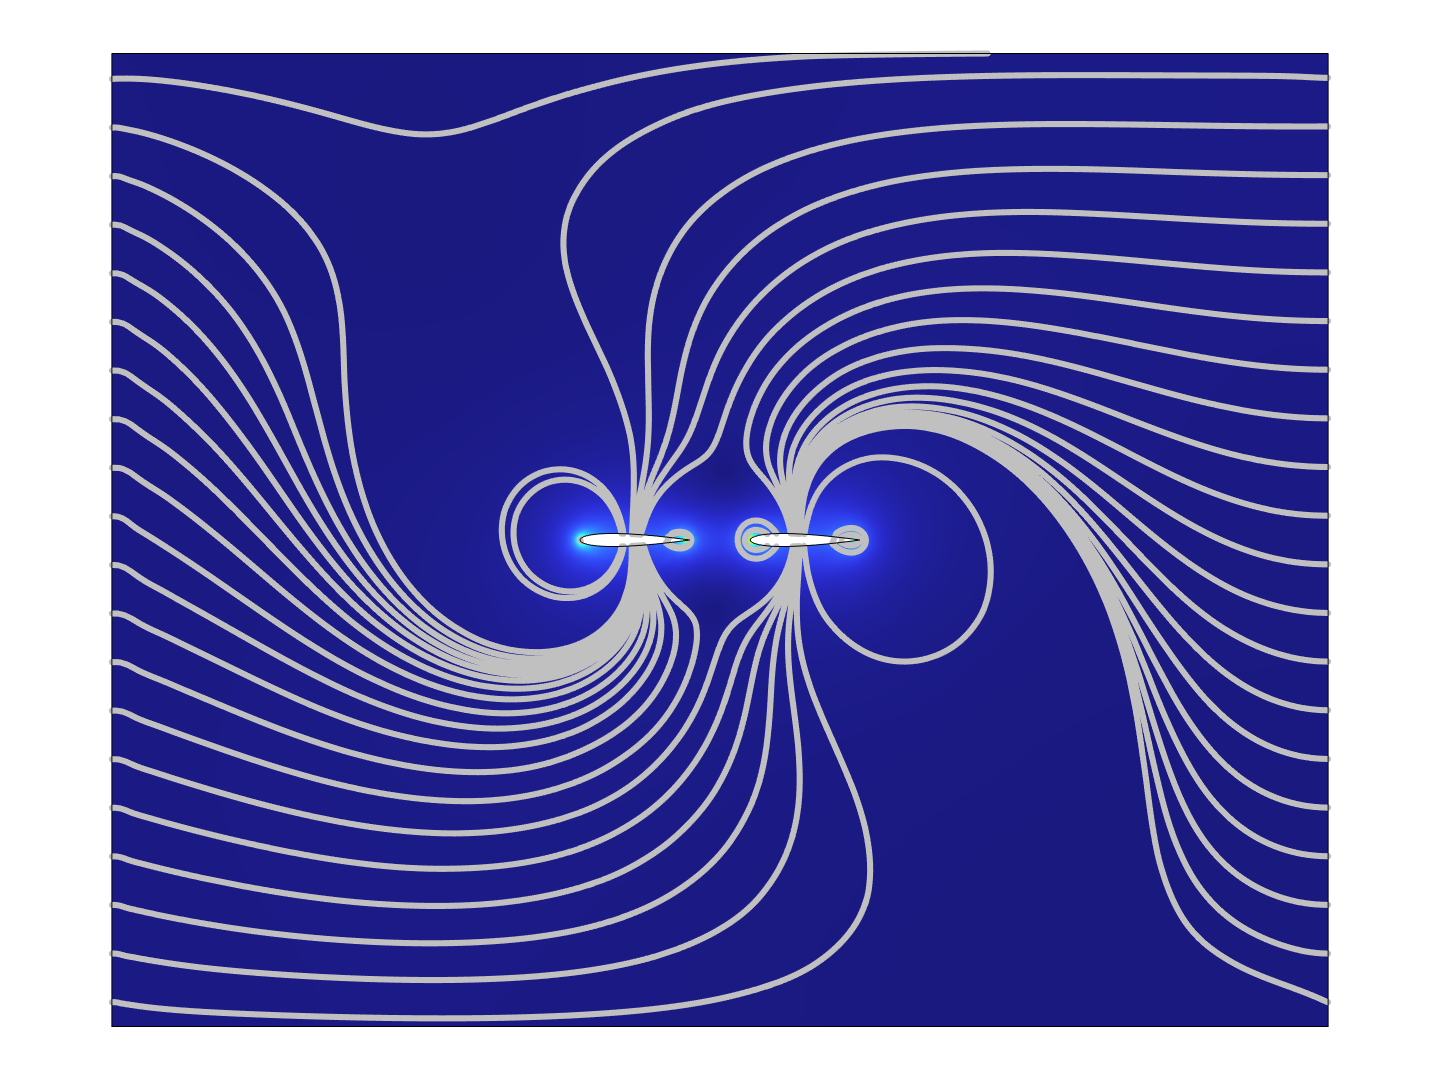
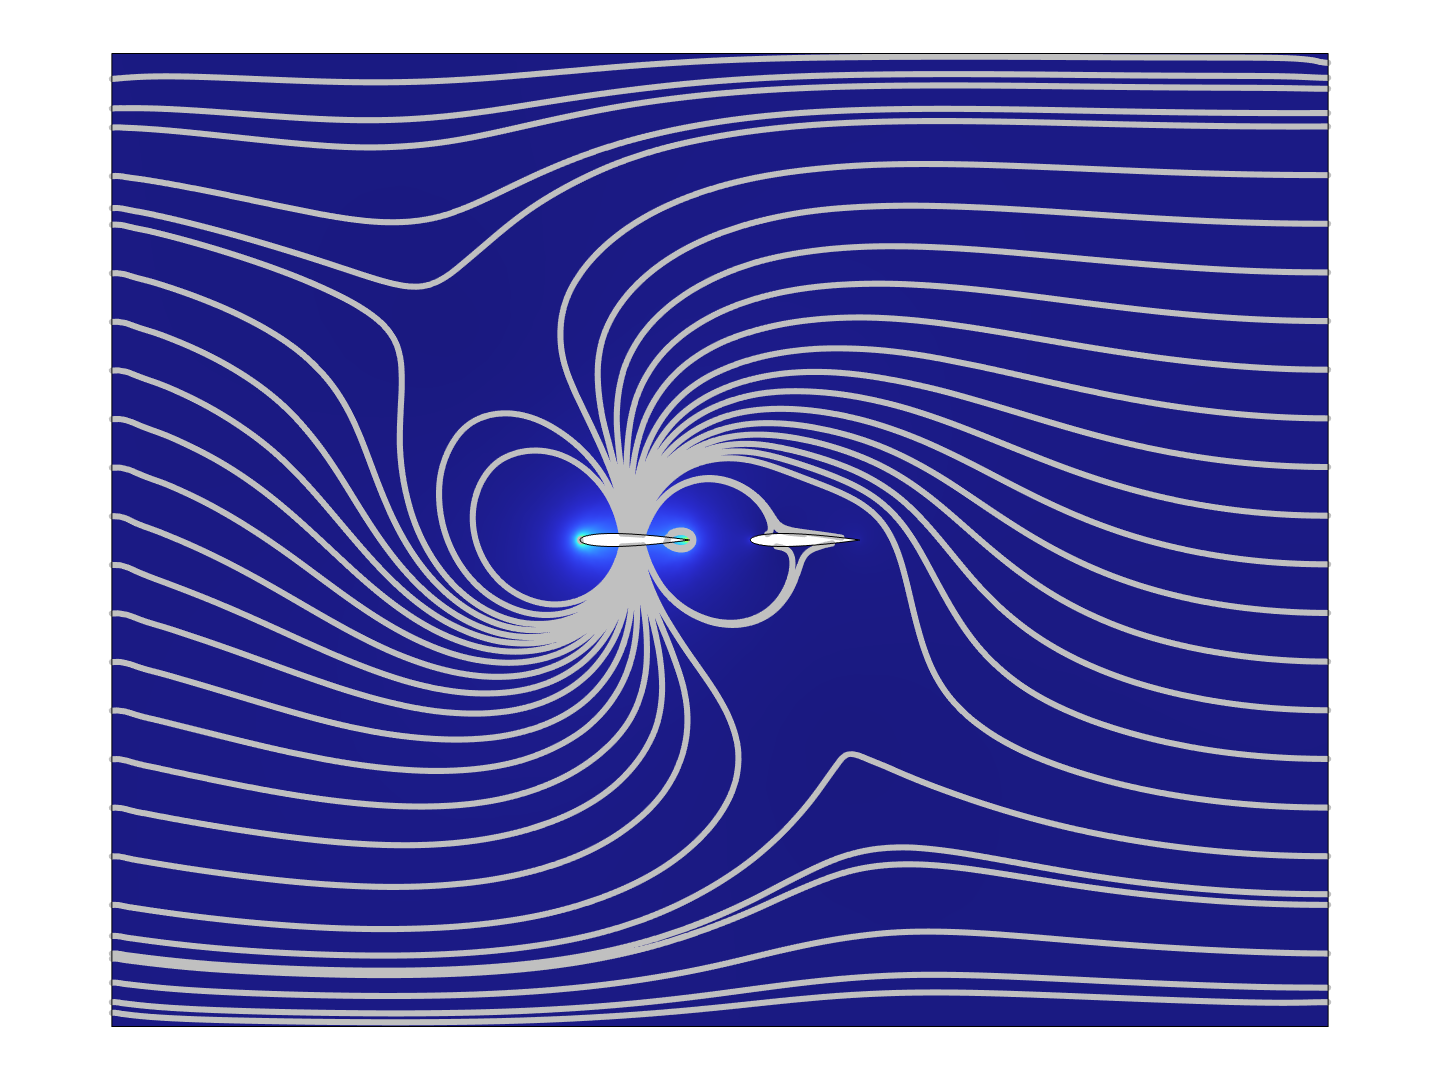
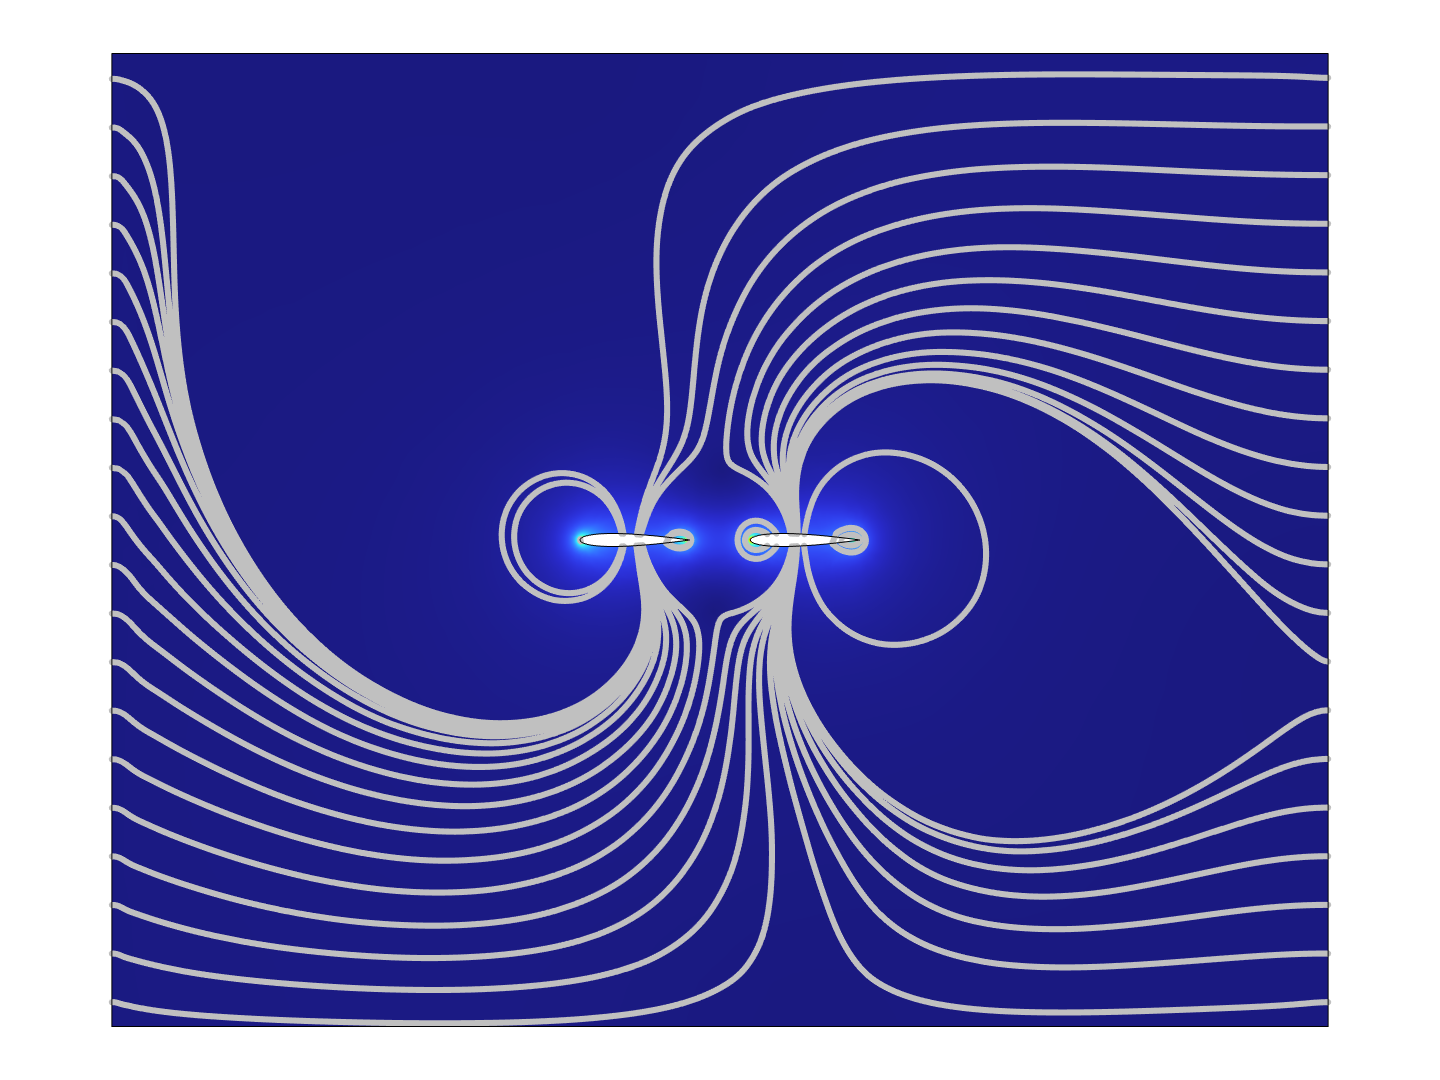
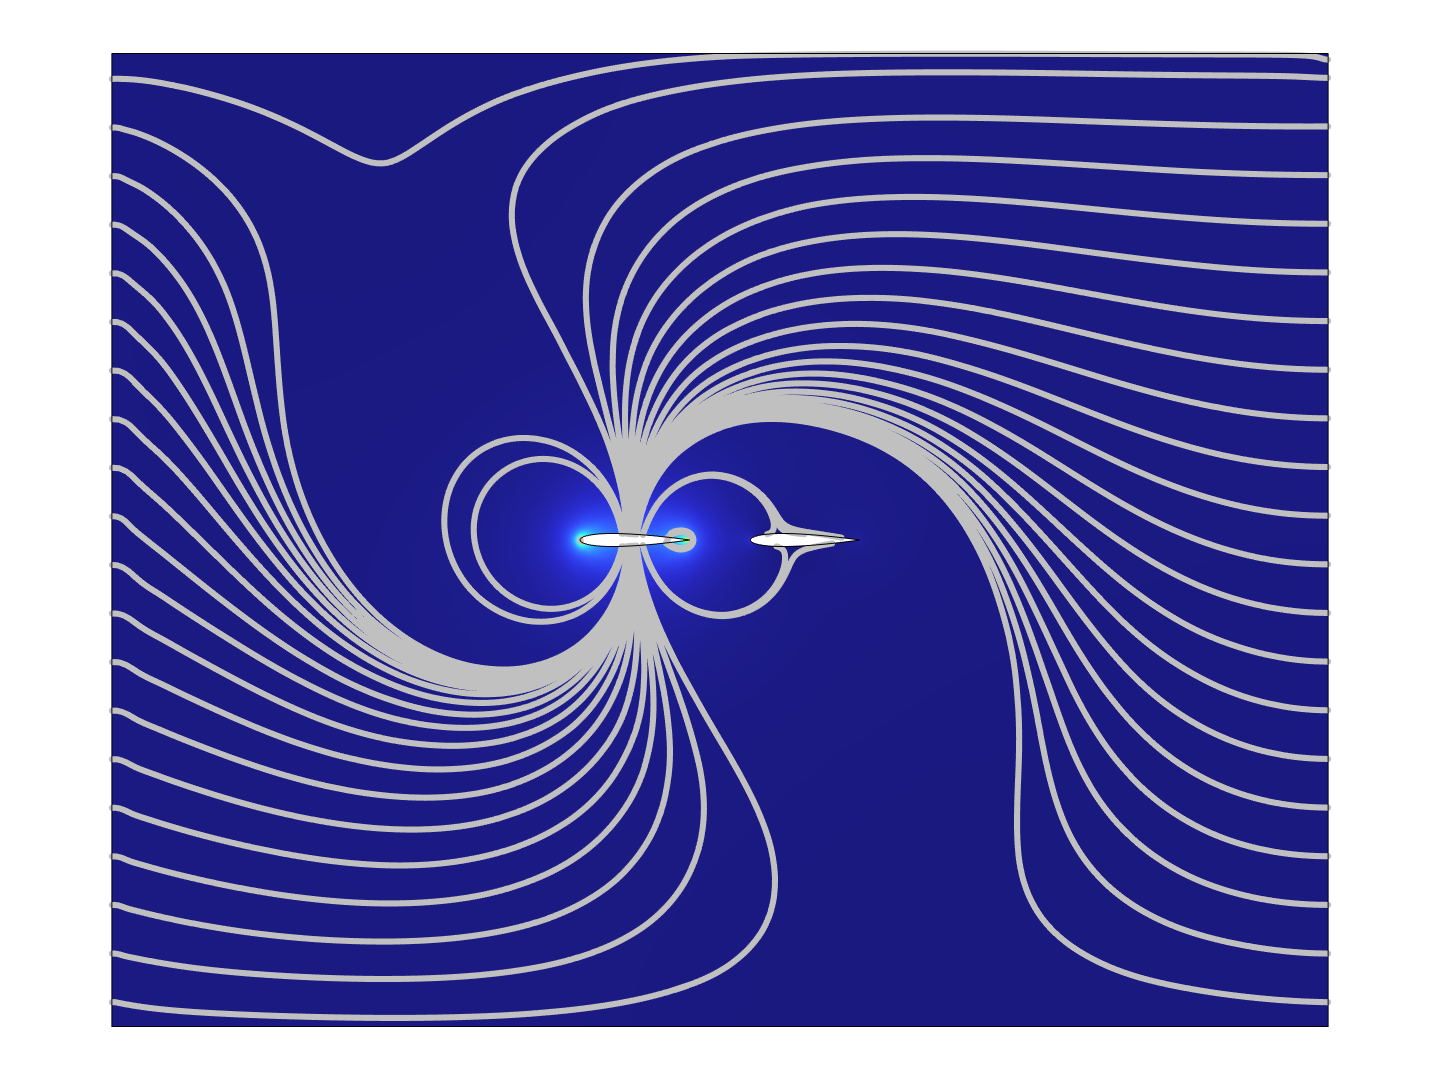
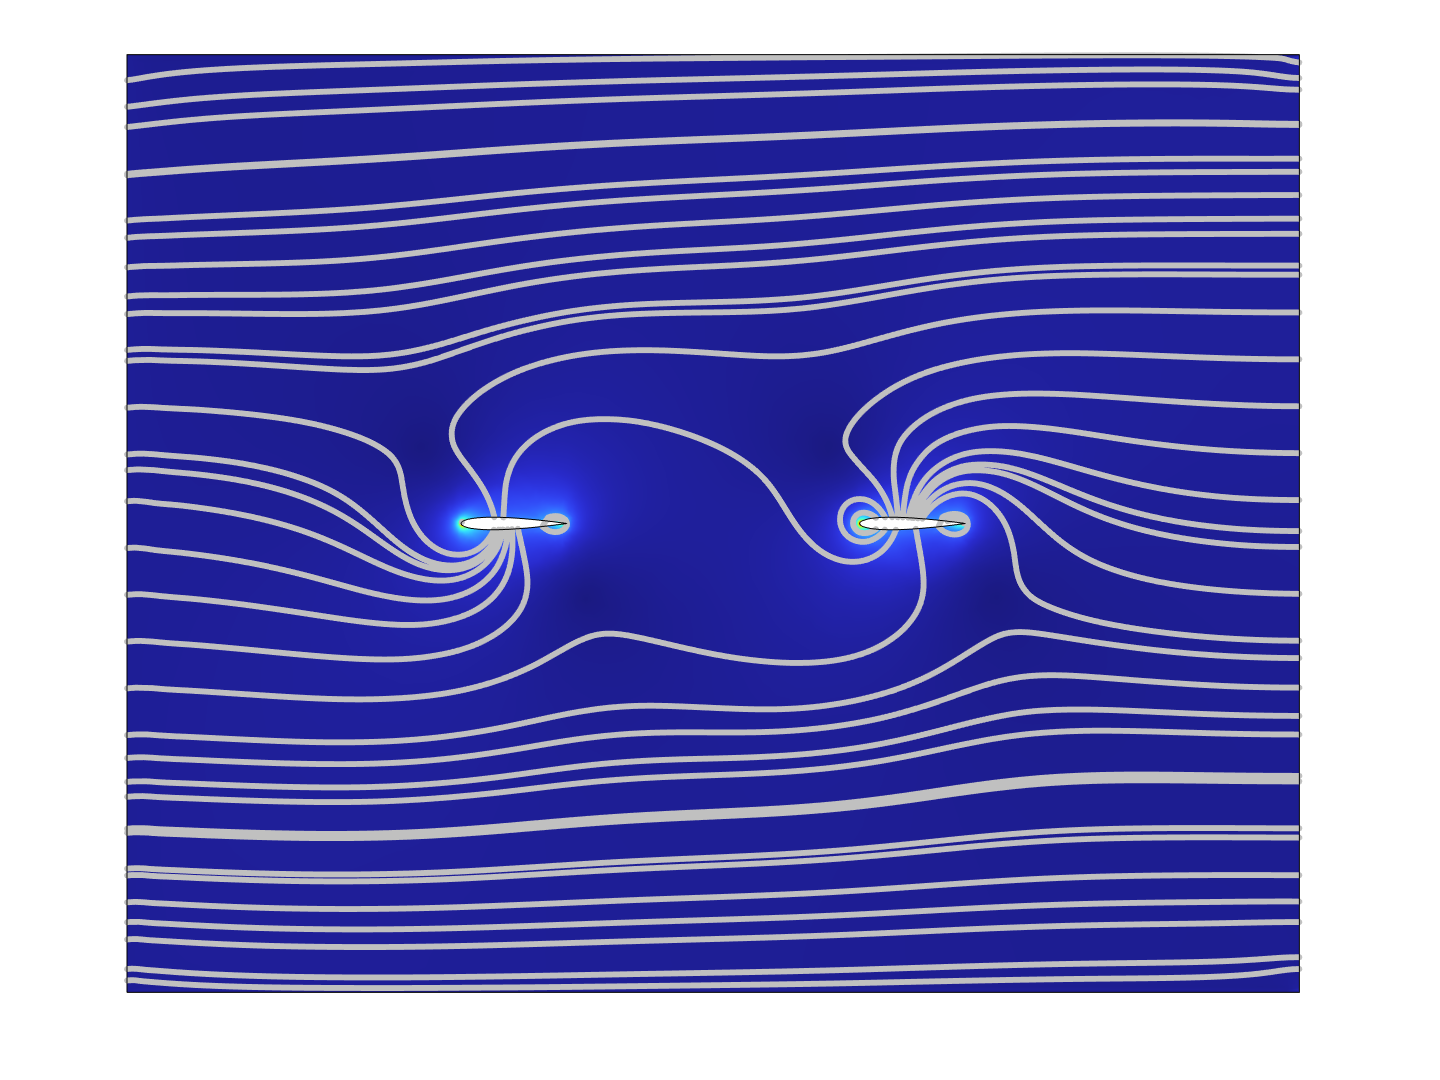
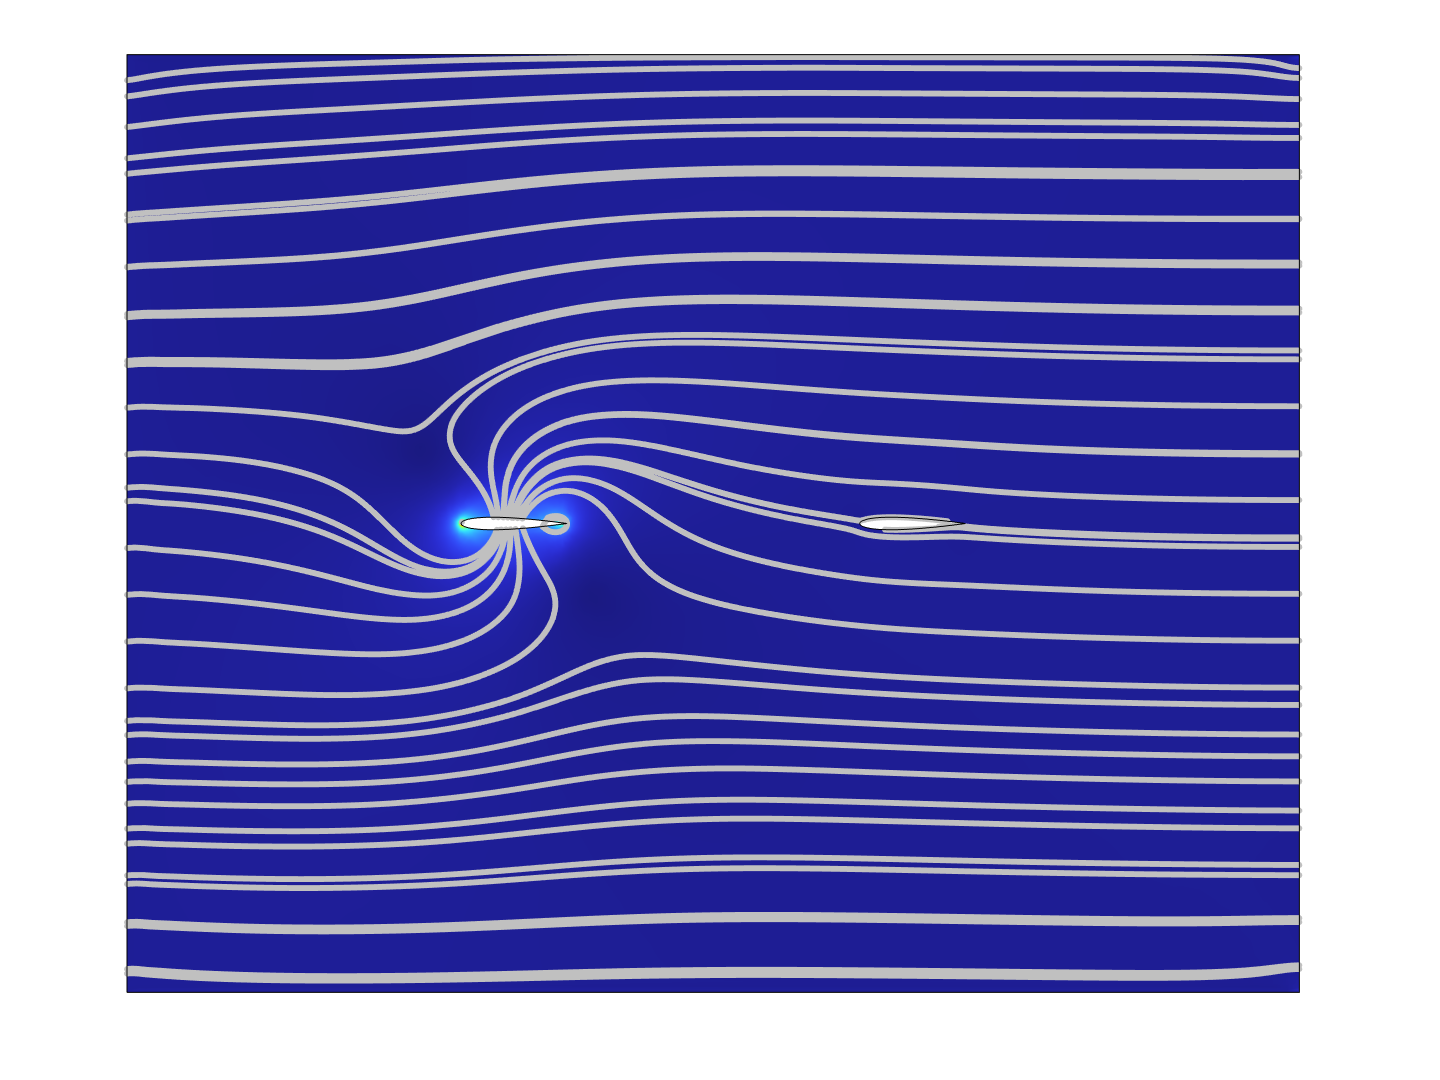
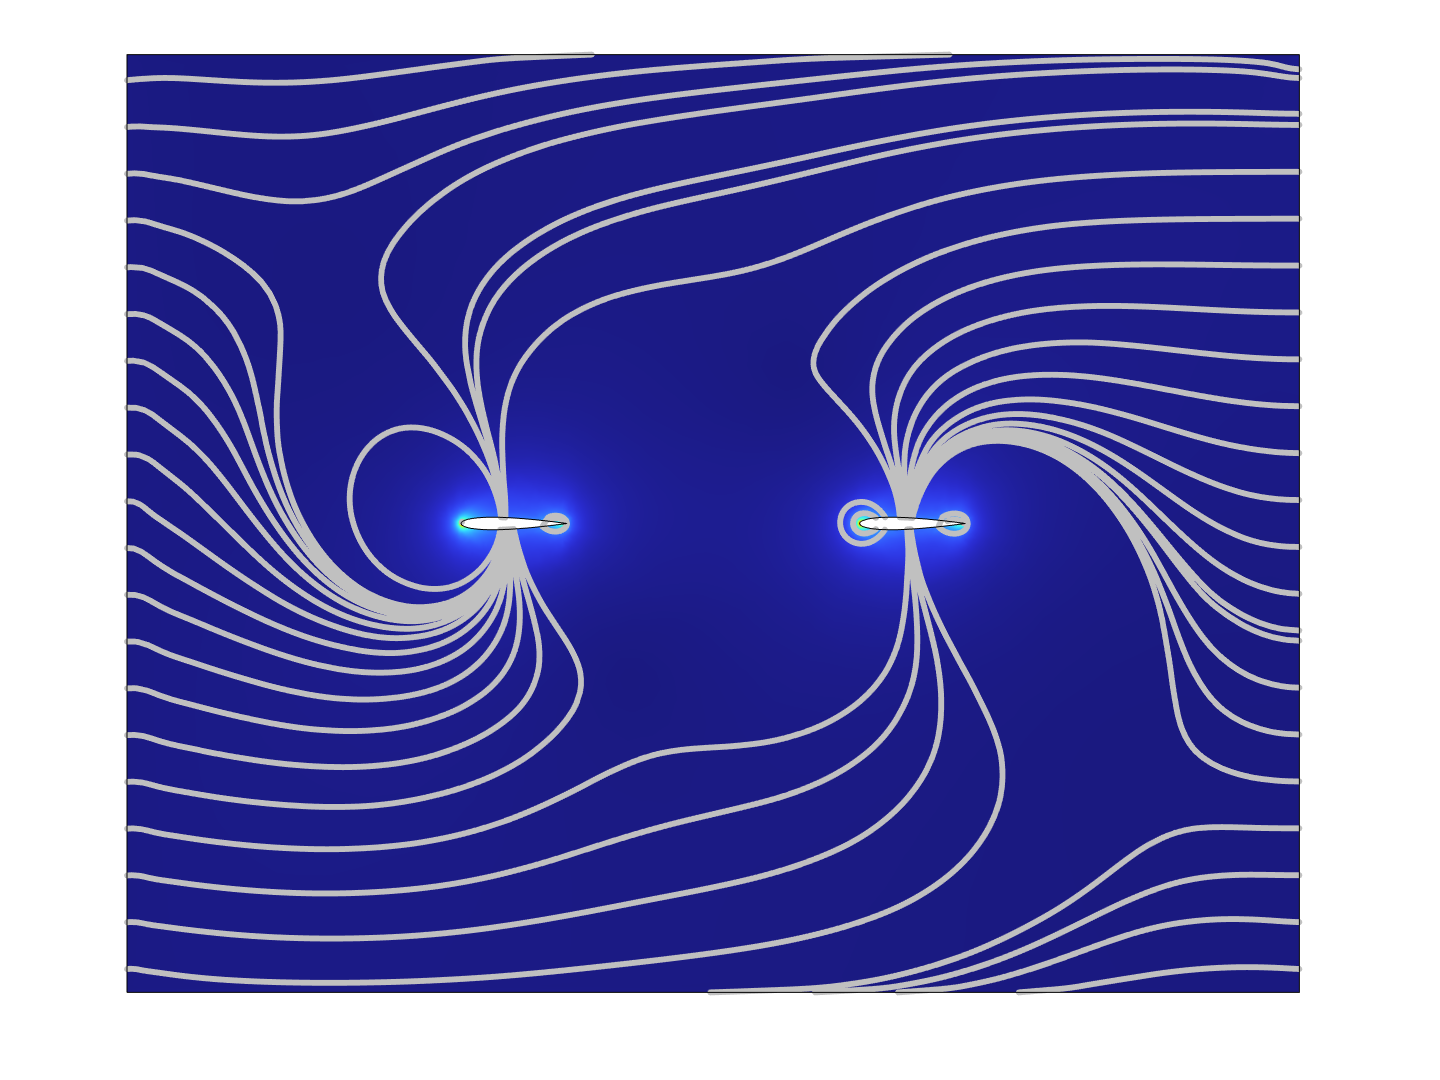
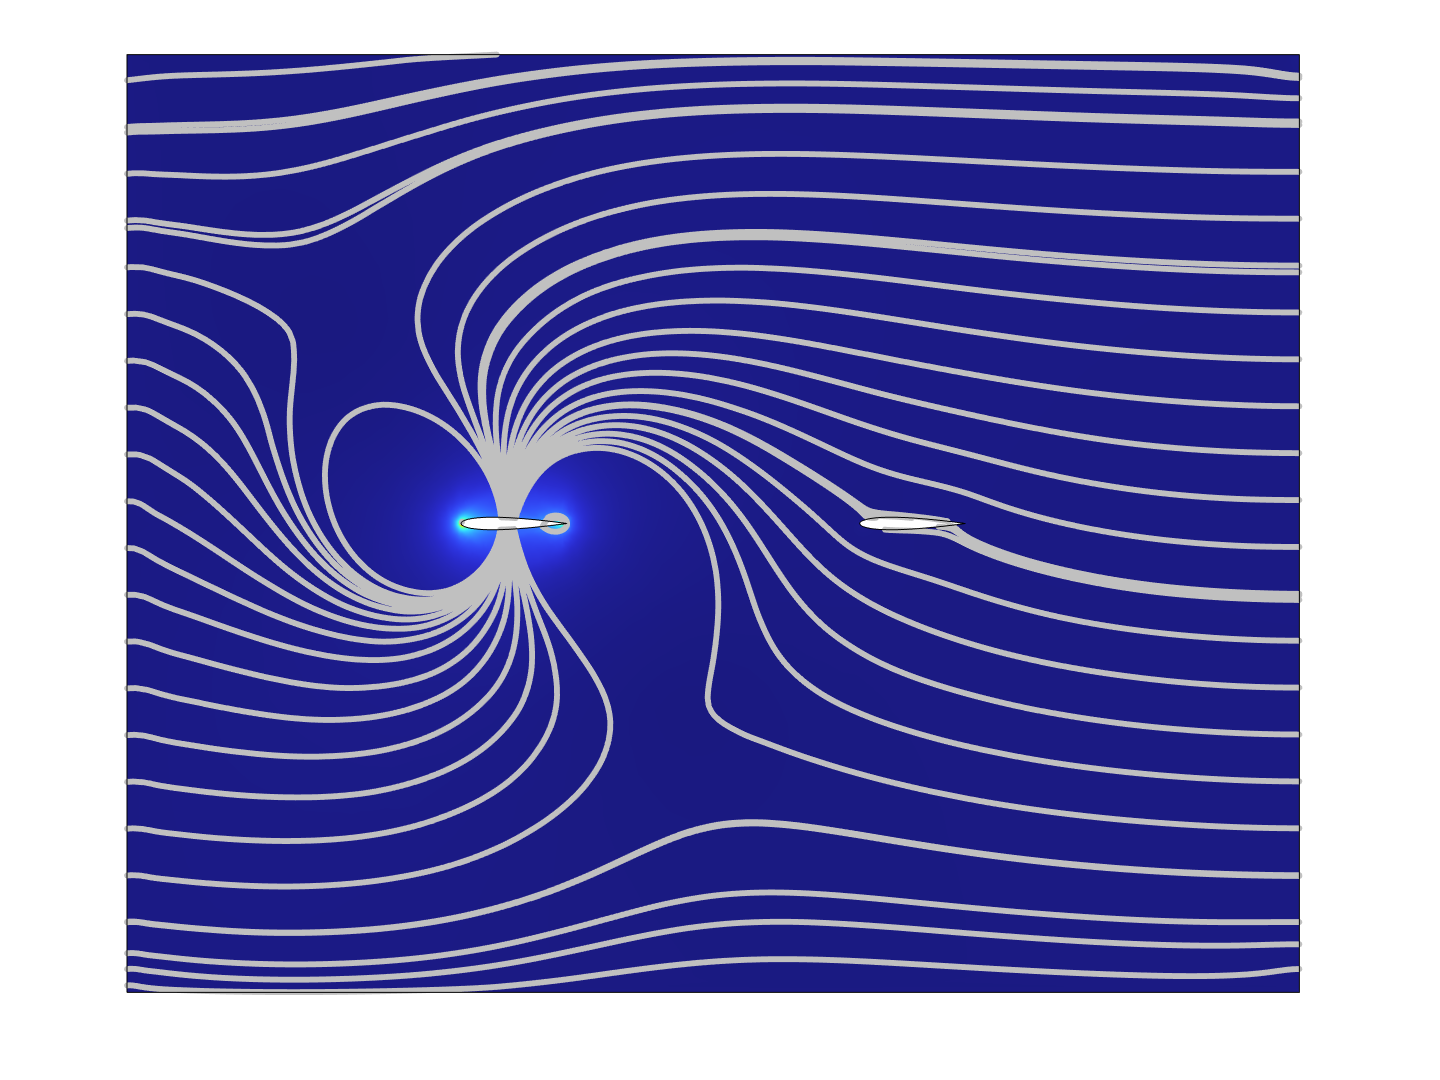
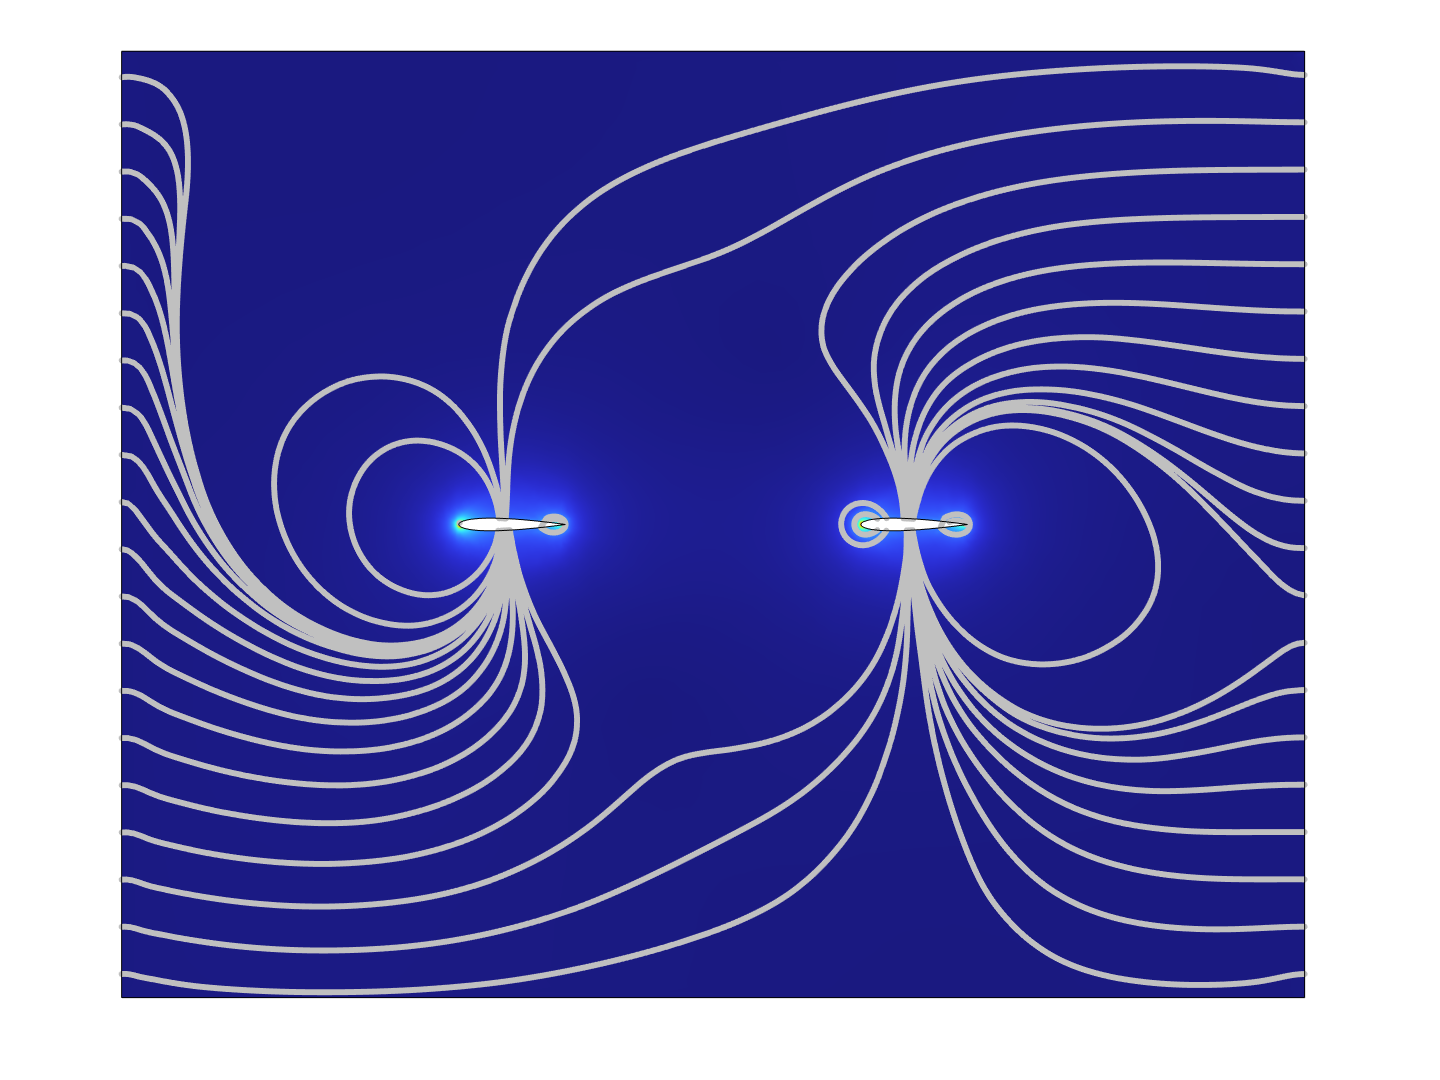
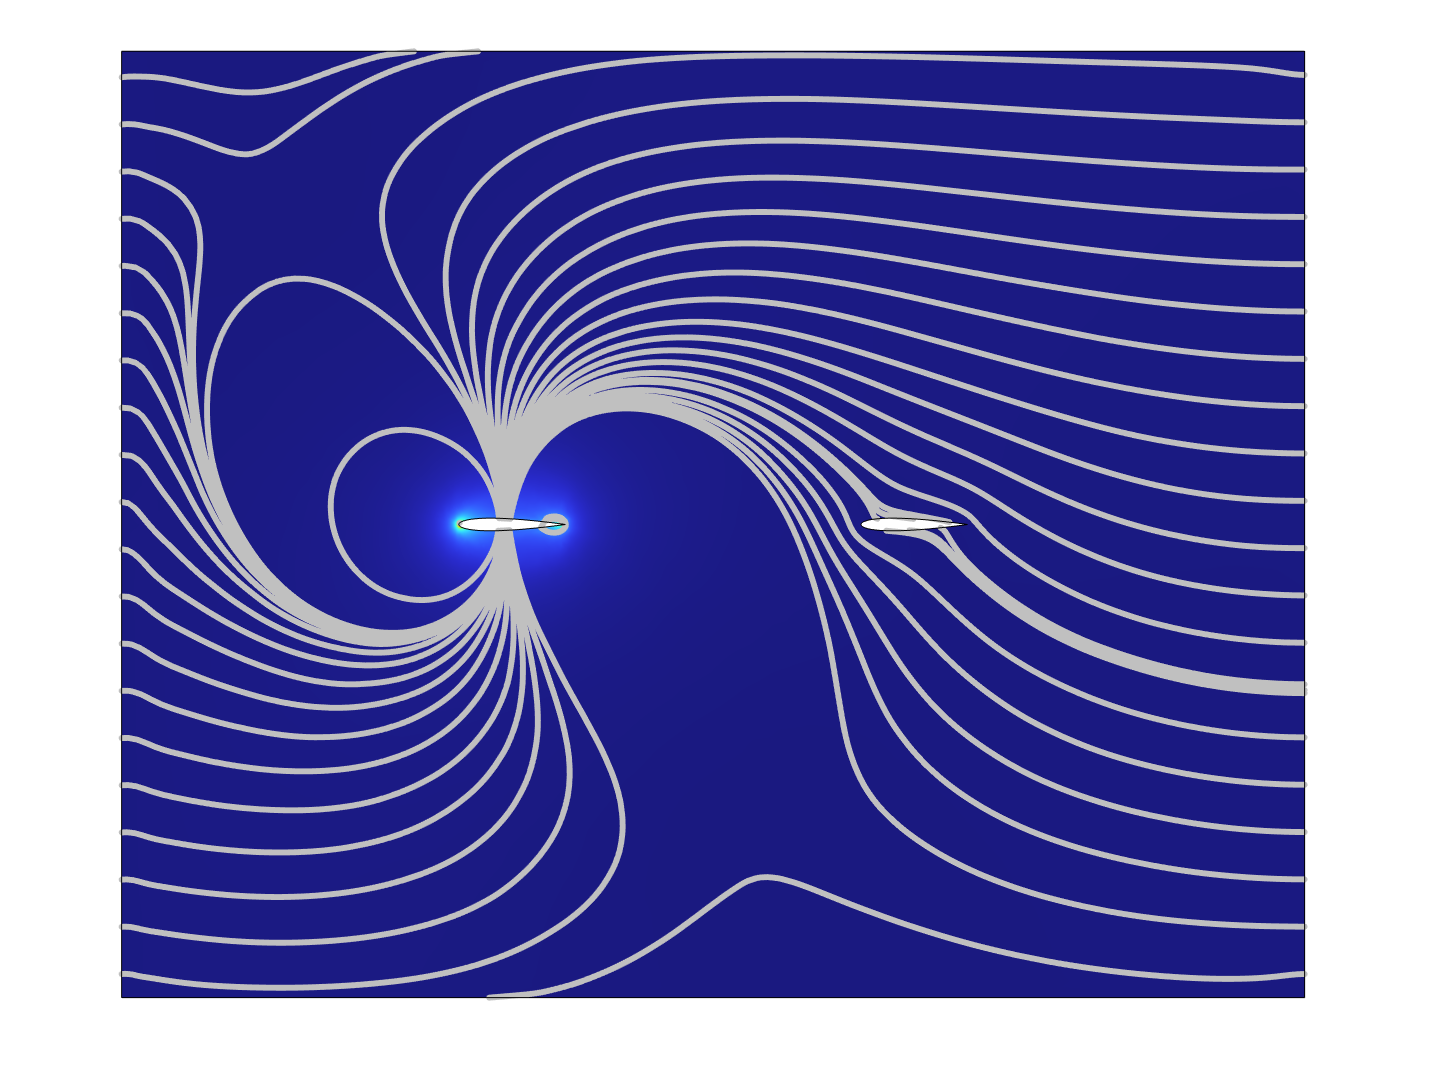
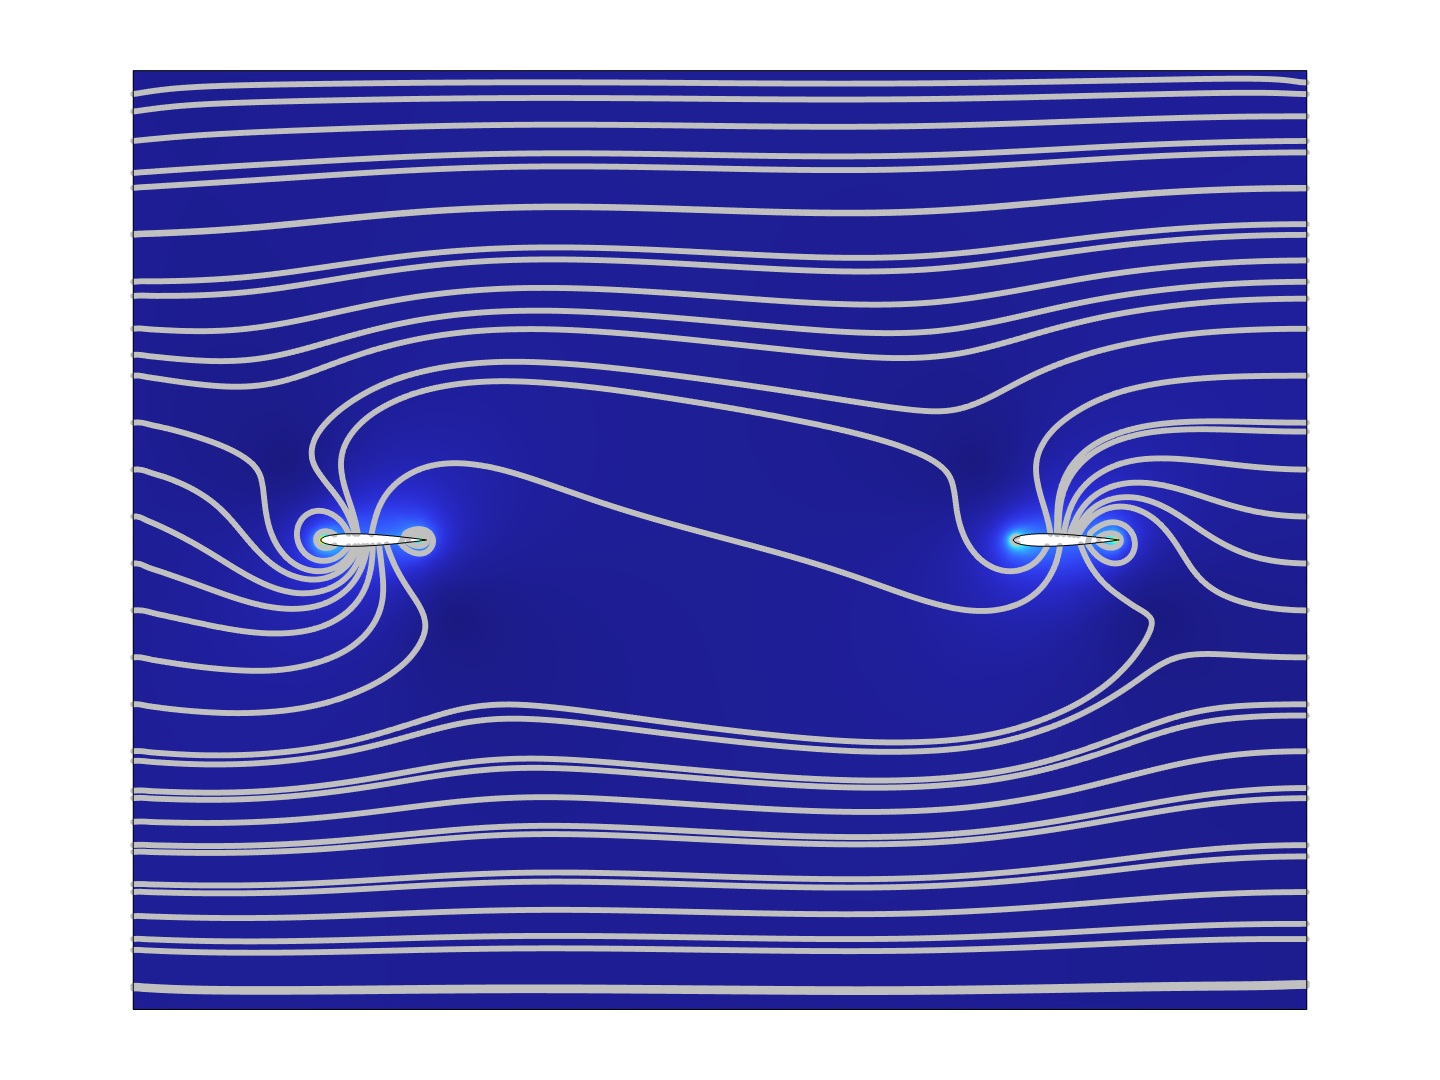
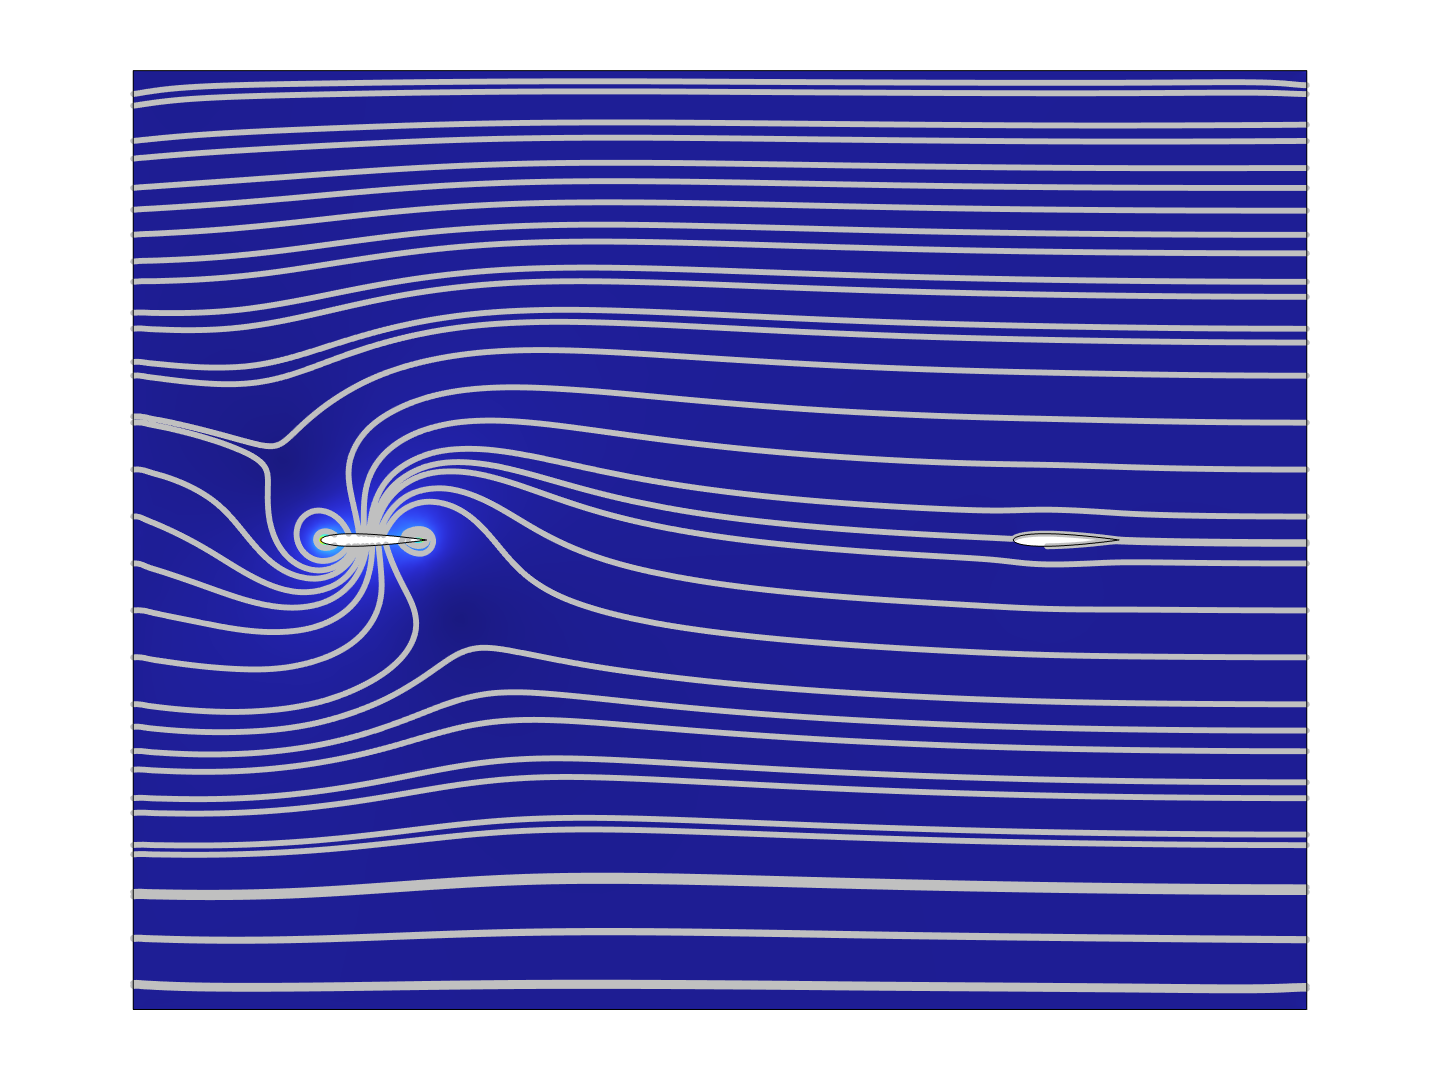
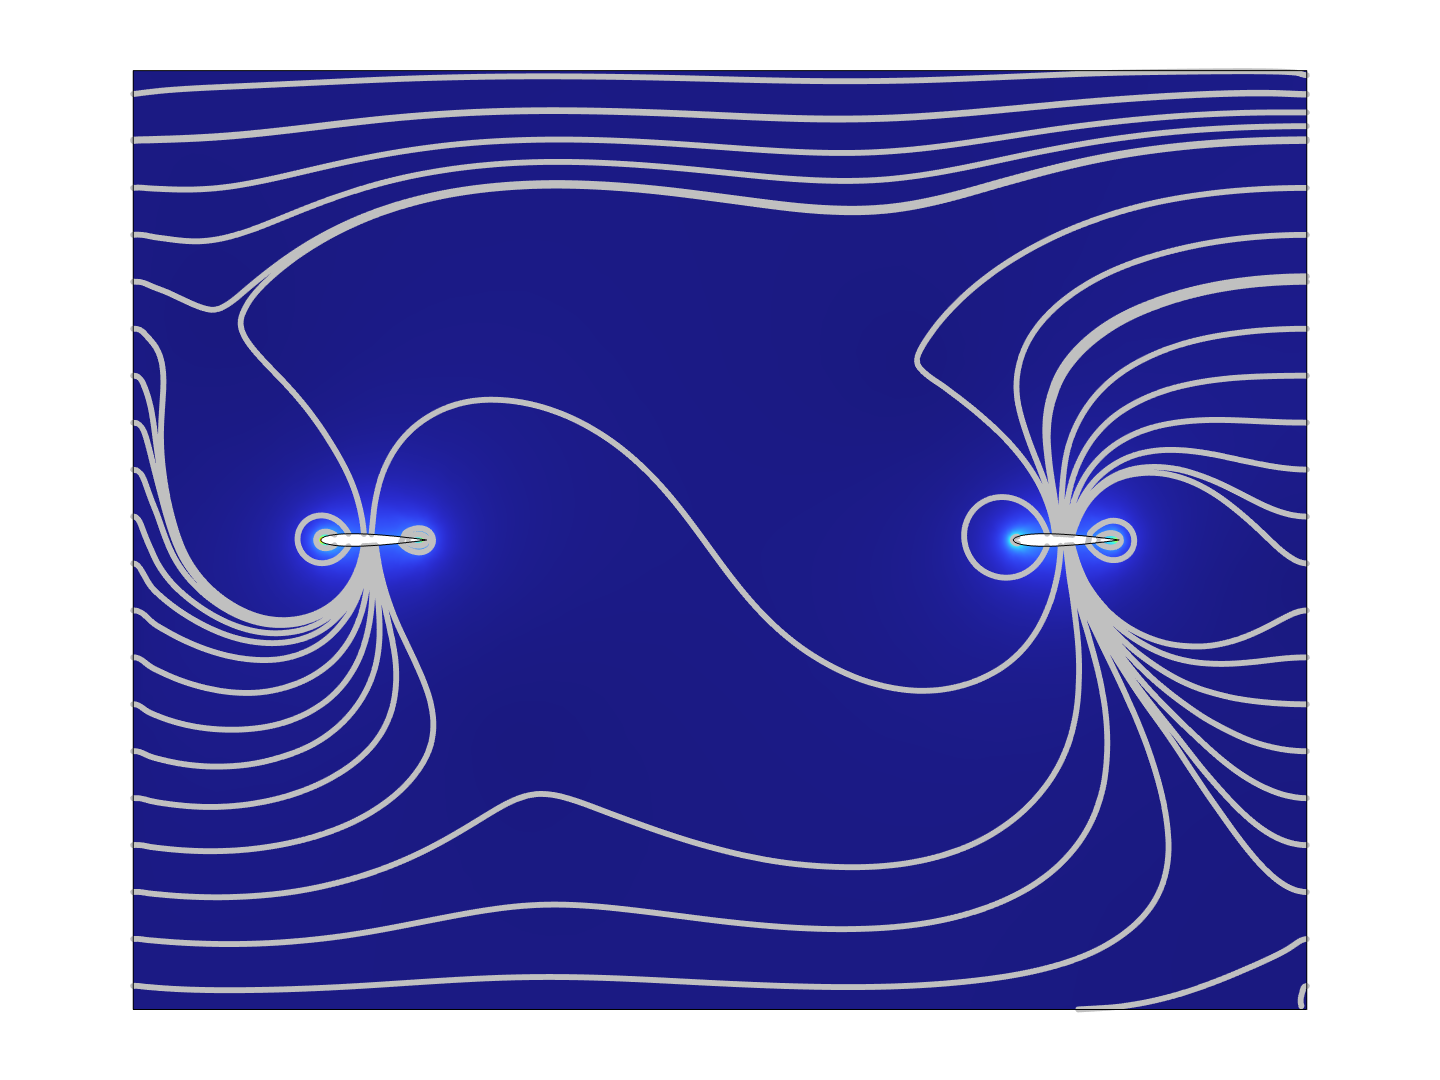
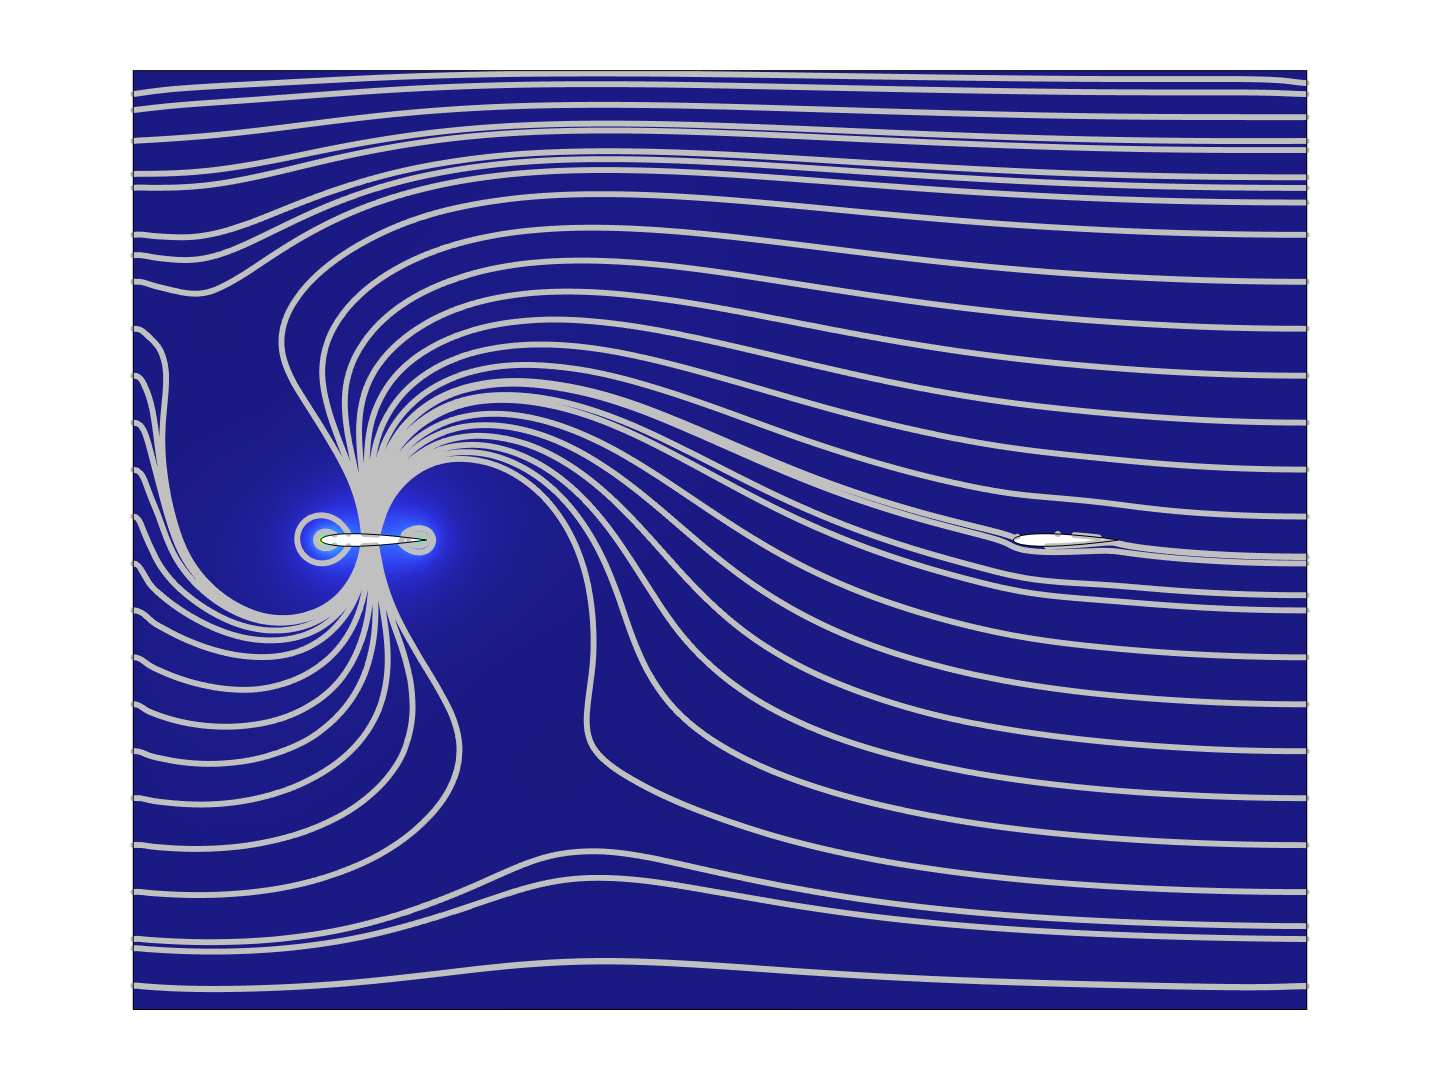
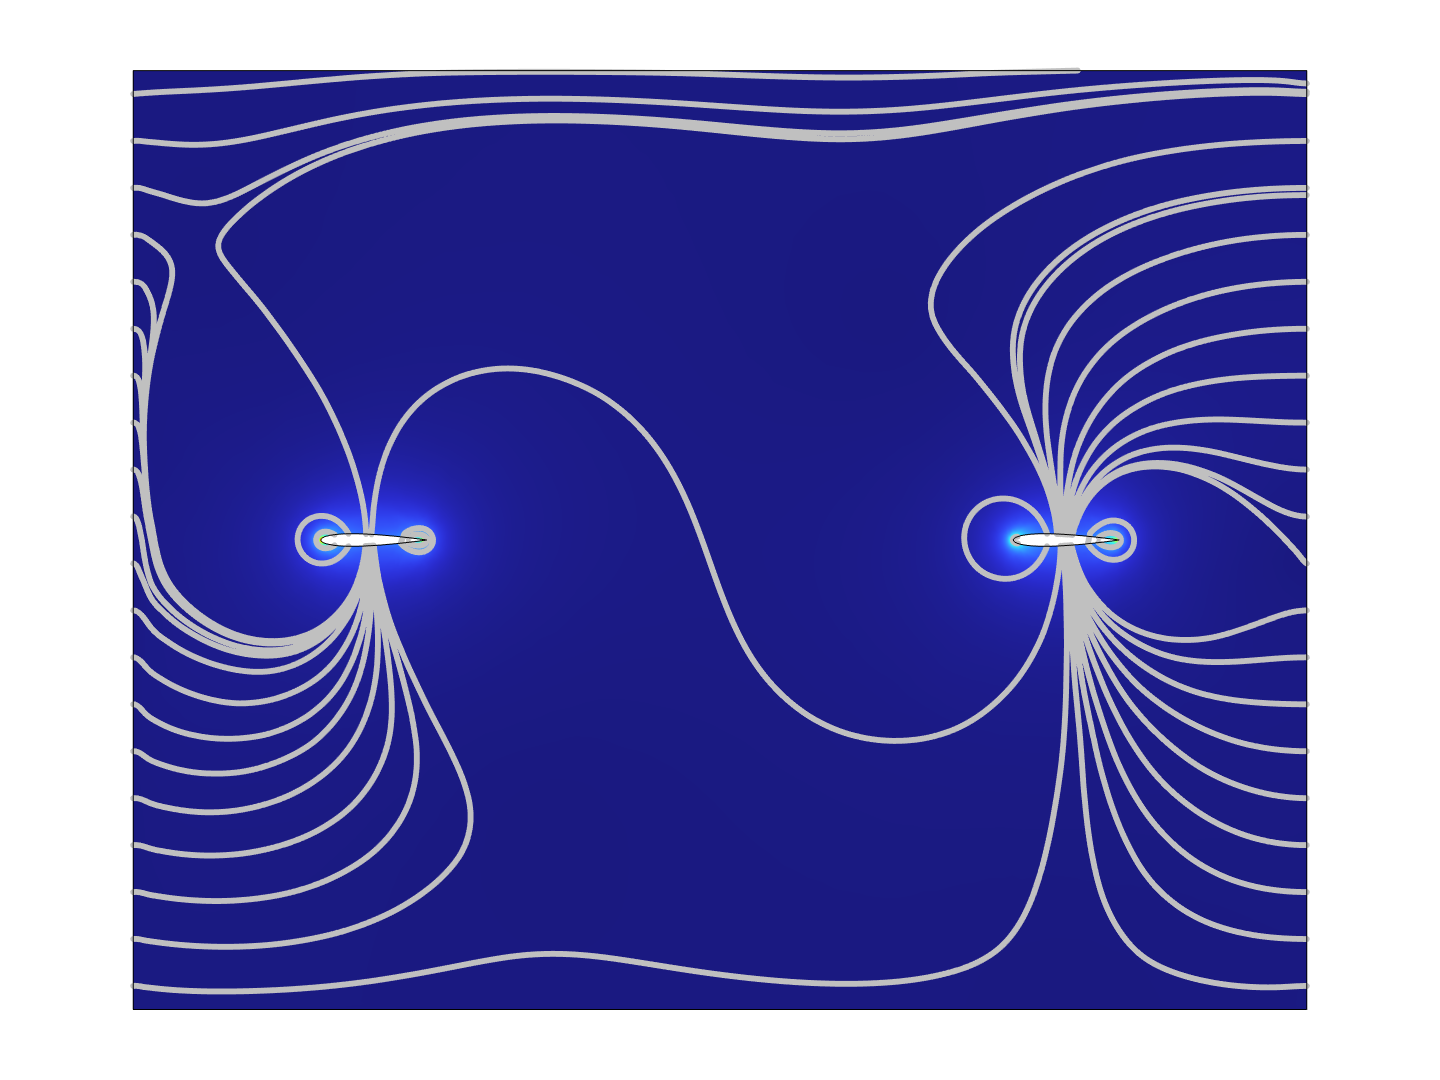
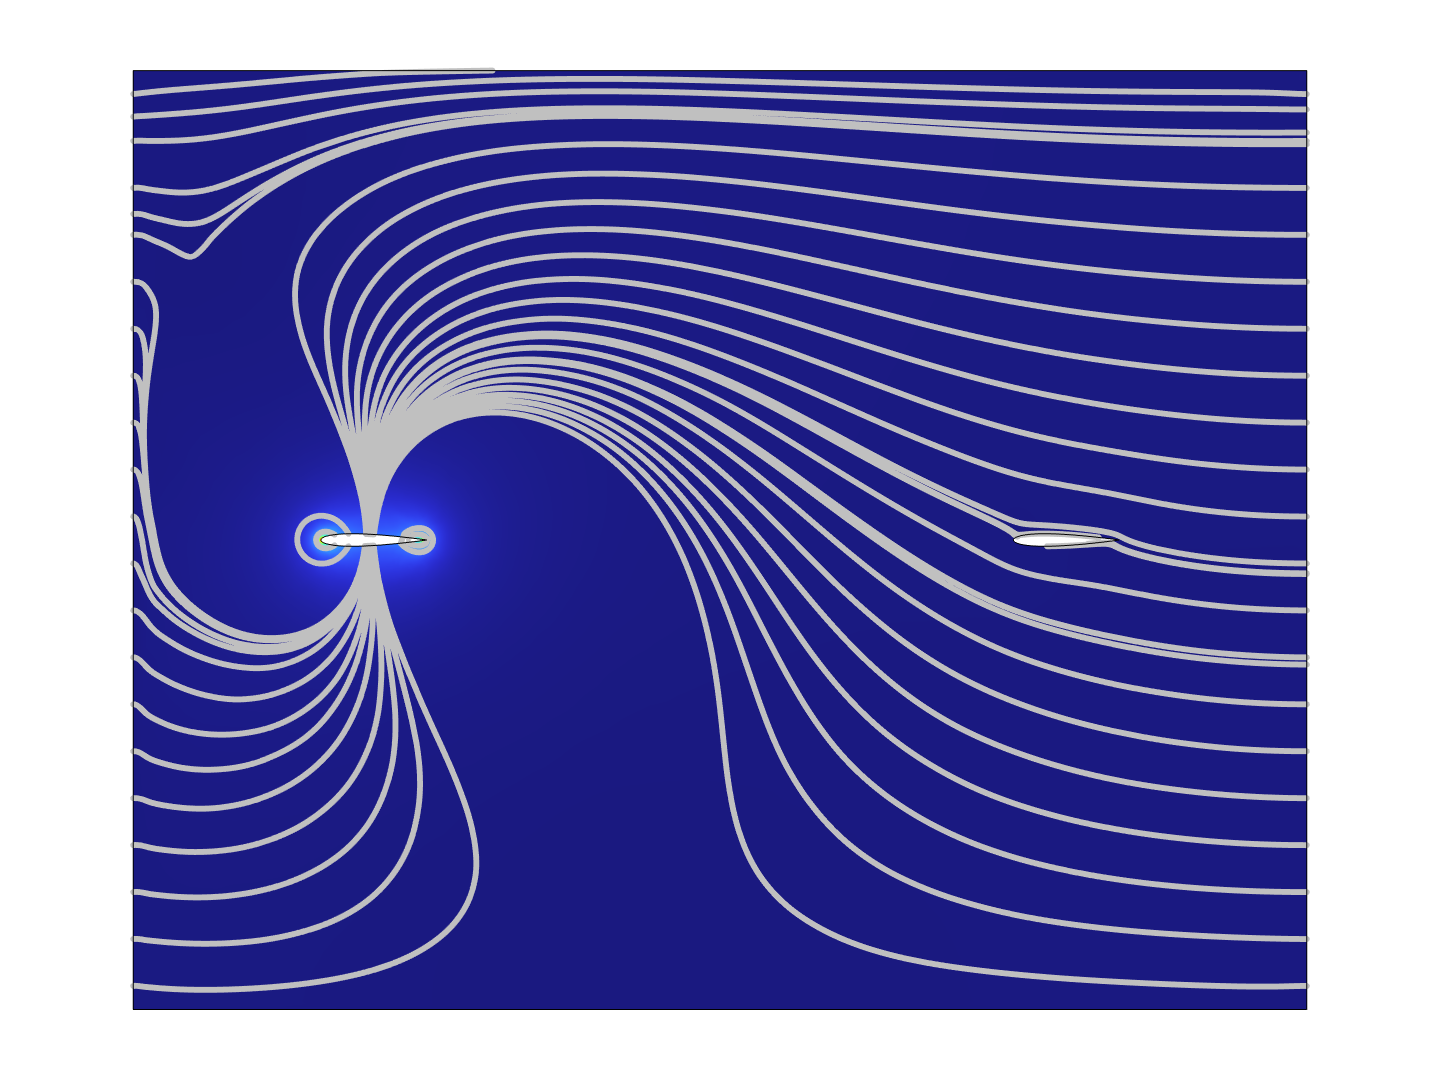
Figure 8. Flow field around the airfoils, at time t = 0
3. Discussion
3.1. Single airfoil result
The simulation of single airfoil shows that under low Reynolds number, a NACA 0012 airfoil with a periodical linear motion and a periodical rotational motion that starts at the angle of attack is 15° has a maximum lift to drag ratio when the amplitude of the rotational motion is A = 12, and the phase difference between the two motions is φ = 7π/4. This result is consistent for all three frequencies (ω = 1, 10, 100) of the linear motion.
Considering the ω = 1 case: by Table 1 shown, when there is no phase difference between the motions, at A = 0, which means only linear motion exists, the lift to drag ratio of the airfoil is L/D = 3.72. While at A = 12, L/D = 5.57. The ratio has increased by 49.62%. For the other two cases, ω = 10 and ω = 100, L/D are increased by 49.71% and 50.31%, respectively. Among the three frequencies, when ω = 100, L/D = 5.61 is the largest value, and it is also increased the most when ω = 100.
Furthermore, Table 2 shows that when ω = 1, the lift to drag ratio is L/D = 6.32 when there is a phase difference of φ = 3π/4 between the two motions. The lift to drag ratio is further increased by 13.46%. At ω = 10 and ω = 100, L/D is further increased by 13.60% and 13.93%, respectively. Again, ω = 100 results in the largest value of L/D among the three frequencies, which is 6.38. The lift to drag ratio is increased the most when ω = 100.
3.2. Dual airfoil result
The dual-airfoil experiment shows that the lift to drag ratio is generally larger in the rear airfoil than in the front airfoil. This is caused by the vortices shed by the front airfoil, which convects downstream with the wake and lift the rear airfoil [11]. By Table 4, when t* ≤ 11800, the L/D of the front airfoil is maximized when ψ = 0; when t*=34000, it is maximized when ψ = π/2; for other t* values, it is maximized when ψ = 3π/2. By Table 5, the rear airfoil has L/D maximized at ψ = 0 when t* ≤ 6800, at ψ = π when t* = 68000, and at ψ = 3π/2 for other t* values. The maximum L/D exists at t* = 14000, where L/Dfront = 6.143 and L/Drear = 6.213.
Comparing the data recorded in Table 4 and Table 5, most of the L/D values are larger in the rear airfoil than the front airfoil. An unusual observation is that at t*=34000, the L/D of the front airfoil is maximized at ψ = π/2, which is 6.173, while the maximum L/D of the back airfoil is 6.171. However, Figure 6 shows that all t* values other than 34000 will result in the L/D to be minimized near ψ = π/2. Hence, this deviation is most probably caused by anomalous spikes in the simulation results, due to the time steps or mesh grid taken.
Moreover, by Table 4 and Table 5, the rear airfoil outperformed the front by 1.40% L/D at t* = 14000, which is the maximum percentage. At t* = 6800, the L/D of the rear airfoil is 0.08% less than that of the front airfoil, and at t* = 68000 and ψ = 3π/2, the L/D of the rear airfoil is only 0.03% more than that of the front. This can be explained by that when t* ≤ 6800, the vortices are insufficiently developed, and when t* ≥ 68000, the vortex decays before reaching the rear airfoil.
3.3. Limitations
The experiments use COMSOL as the tool of simulation. “Extra fine” meshes are used in both simulations of single and double airfoils, since this is the only mesh that can make most solutions converge.
Additionally, in the simulation of double airfoils, instead of α = 15 + 12 sin (ωt + 3π/4), the rotational motion is set to be α = 15 + 12 sin (ωt + 7π/4). The reason is that when φ = 3π/4, the COMSOL solver encounters repeated error test failures, which may be because it has reached a singularity. This problem cannot be resolved by changing the mesh of the simulation. However, situations could be different from φ = 3π/4. Thus, further experiments are needed. One may try to refine the mesh grid, or use a different simulation tool to solve the problem.
Moreover, in these simulations, the lift to drag ratios are only calculated within one period. To make the results more reliable, one can repeat the simulation with more periods. Also, the time intervals used in the simulation is 0.05/ω, which means that each simulation will generate only 125 data points. To get a more precise result, the time intervals can be further decreased to 0.01/ω, or less.
Finally, the flow in the rectangular region is the laminar flow, and the simulations are conducted under a low Reynolds number. For more sophisticated situations, turbulent flows and a larger Reynolds number can be used.
4. Conclusion
This study systematically investigates the aerodynamics of flapping NACA 0012 airfoils through integrated CFD simulations at low Reynolds numbers. Key findings demonstrate that, for one airfoil with a flapping motion and a pitching motion around AoA = 15°, the amplitude A = 12 of pitching motion and the phase difference φ = 3π/4 will amplify the lift to drag ratios by up to 71.11%, compared to A = 0 and φ = 0 situations. Tandem airfoil systems achieve optimal configurations when two airfoils pitching with a phase difference of ψ = 3π/2, which enhances the L/D of the rear airfoil by at most 1.40% through leading edge vortex impingement. The dimensionless parameter, t*, governs efficiency of the vortex, peaking at t* = 14000.
These results are useful in designing new aircraft, and new energy recovering systems. However, limitations exist in this research, including the insufficient density of the mesh grid chosen, the time interval and number of periods chosen, laminar flow assumptions, etc. Future work may build denser mesh grids, conduct simulation in more time periods, and implement turbulence models for high Reynolds numbers validation.
References
[1]. Jacobs, E. N., Ward, K. E., & Pinkerton, M. R. (1933) The characteristics of 78 related airfoil sections from tests in the variable-density wind tunnel. NACA Annual Report 19, 460, 299-354.
[2]. Anderson, J. D., and Cadou, C. P. (2024). Fundamentals of aerodynamics. McGraw-Hill.
[3]. Rak, A., Grbčić, L., Sikirica, A., & Kranjčević, L. (2023). Experimental and LBM analysis of medium-reynolds number fluid flow around NACA0012 airfoil. International Journal of Numerical Methods for Heat & amp; Fluid Flow, 33(5), 1955–1980. https: //doi.org/10.1108/hff-06-2022-0389
[4]. Mula, A., & Abdulwahid, M. (2023). Numerical simulation of the aerodynamic characteristics of NACA0012 airfoil based on operational parameters. Basrah Journal for Engineering Science, 23(1), 81–89. https: //doi.org/10.33971/bjes.23.1.11
[5]. Cheng, H., & Wang, H. (2018). Prediction of lift coefficient for tandem wing configuration or multiple-lifting-surface system using Prandtl’s lifting-line theory. International Journal of Aerospace Engineering, 2018, 1–15. https: //doi.org/10.1155/2018/3104902
[6]. Khalid, M. H. (2022). CFD analysis of NACA 0012 aerofoil to investigate the effect of increasing angle of attack on coefficient of lift and coefficient of drag. Journal of Studies in Science and Engineering, 2(1), 74–86. https: //doi.org/10.53898/josse2022216
[7]. Lee, T. (2011). Flow past two in-tandem airfoils undergoing sinusoidal oscillations. Experiments in Fluids, 51(6), 1605–1621. https: //doi.org/10.1007/s00348-011-1173-4
[8]. Li, Y. (2018). CFD simulation of Smooth and Rough NACA 0012 Airfoils at low Reynolds number (thesis).
[9]. Kurtulus, D. F. (2019). Unsteady aerodynamics of a pitching NACA 0012 airfoil at low Reynolds number. International Journal of Micro Air Vehicles, 11. https: //doi.org/10.1177/1756829319890609
[10]. Lyu, P. (2015, June 16). How do I compute lift and drag?. COMSOL. https: //www.comsol.com/blogs/how-do-i-compute-lift-and-drag
[11]. Jones, K. D., Dohring, C. M., & Platzer, M. F. (1998). Experimental and computational investigation of the Knoller-Betz effect. AIAA Journal, 36(7), 1240–1246. https: //doi.org/10.2514/2.505
Cite this article
Zhao,Y. (2025). Two Dimensional CFD Simulation of Optimizing Lift to Drag Ratio of Flapping Tandem NACA 0012 Airfoils. Theoretical and Natural Science,120,99-110.
Data availability
The datasets used and/or analyzed during the current study will be available from the authors upon reasonable request.
Disclaimer/Publisher's Note
The statements, opinions and data contained in all publications are solely those of the individual author(s) and contributor(s) and not of EWA Publishing and/or the editor(s). EWA Publishing and/or the editor(s) disclaim responsibility for any injury to people or property resulting from any ideas, methods, instructions or products referred to in the content.
About volume
Volume title: Proceedings of CONF-APMM 2025 Symposium: Controlling Robotic Manipulator Using PWM Signals with Microcontrollers
© 2024 by the author(s). Licensee EWA Publishing, Oxford, UK. This article is an open access article distributed under the terms and
conditions of the Creative Commons Attribution (CC BY) license. Authors who
publish this series agree to the following terms:
1. Authors retain copyright and grant the series right of first publication with the work simultaneously licensed under a Creative Commons
Attribution License that allows others to share the work with an acknowledgment of the work's authorship and initial publication in this
series.
2. Authors are able to enter into separate, additional contractual arrangements for the non-exclusive distribution of the series's published
version of the work (e.g., post it to an institutional repository or publish it in a book), with an acknowledgment of its initial
publication in this series.
3. Authors are permitted and encouraged to post their work online (e.g., in institutional repositories or on their website) prior to and
during the submission process, as it can lead to productive exchanges, as well as earlier and greater citation of published work (See
Open access policy for details).
References
[1]. Jacobs, E. N., Ward, K. E., & Pinkerton, M. R. (1933) The characteristics of 78 related airfoil sections from tests in the variable-density wind tunnel. NACA Annual Report 19, 460, 299-354.
[2]. Anderson, J. D., and Cadou, C. P. (2024). Fundamentals of aerodynamics. McGraw-Hill.
[3]. Rak, A., Grbčić, L., Sikirica, A., & Kranjčević, L. (2023). Experimental and LBM analysis of medium-reynolds number fluid flow around NACA0012 airfoil. International Journal of Numerical Methods for Heat & amp; Fluid Flow, 33(5), 1955–1980. https: //doi.org/10.1108/hff-06-2022-0389
[4]. Mula, A., & Abdulwahid, M. (2023). Numerical simulation of the aerodynamic characteristics of NACA0012 airfoil based on operational parameters. Basrah Journal for Engineering Science, 23(1), 81–89. https: //doi.org/10.33971/bjes.23.1.11
[5]. Cheng, H., & Wang, H. (2018). Prediction of lift coefficient for tandem wing configuration or multiple-lifting-surface system using Prandtl’s lifting-line theory. International Journal of Aerospace Engineering, 2018, 1–15. https: //doi.org/10.1155/2018/3104902
[6]. Khalid, M. H. (2022). CFD analysis of NACA 0012 aerofoil to investigate the effect of increasing angle of attack on coefficient of lift and coefficient of drag. Journal of Studies in Science and Engineering, 2(1), 74–86. https: //doi.org/10.53898/josse2022216
[7]. Lee, T. (2011). Flow past two in-tandem airfoils undergoing sinusoidal oscillations. Experiments in Fluids, 51(6), 1605–1621. https: //doi.org/10.1007/s00348-011-1173-4
[8]. Li, Y. (2018). CFD simulation of Smooth and Rough NACA 0012 Airfoils at low Reynolds number (thesis).
[9]. Kurtulus, D. F. (2019). Unsteady aerodynamics of a pitching NACA 0012 airfoil at low Reynolds number. International Journal of Micro Air Vehicles, 11. https: //doi.org/10.1177/1756829319890609
[10]. Lyu, P. (2015, June 16). How do I compute lift and drag?. COMSOL. https: //www.comsol.com/blogs/how-do-i-compute-lift-and-drag
[11]. Jones, K. D., Dohring, C. M., & Platzer, M. F. (1998). Experimental and computational investigation of the Knoller-Betz effect. AIAA Journal, 36(7), 1240–1246. https: //doi.org/10.2514/2.505