


1. Introduction
Suicide is a main health concern in the society, and has become one of the leading causes of death in the United States. Suicide has consistently ranked among the top ten causes of death nationwide, affecting individuals across all age groups [1]. Alarmingly, the suicide rate increased from 10.4 to 13.5 per 100,000 people between 2000 and 2016 [2], reflecting a worrying upward trend. This persistent rise highlights the urgent need for a better understanding of the social and economic factors that contribute to suicide risk. Previous research has examined various factors of suicide, including mental health conditions, access to lethal means, and demographic characteristics such as age and gender [3]. Economic conditions—particularly unemployment—have also been identified as influential, with study of Steven Stack’s suggesting that unemployment affects suicide because the former represents a break between individuals and the society, bringing mental stress and thus leading to suicide [3]. Gender differences, in turn, may interact with these economic factors, leading to variations in suicide rates between men and women. However, most of the existing literature only focuses on individual factors in a certain aspect, and there are still deficiencies in covering all factors and conducting further in-depth analysis of the causes of suicide.
This study aims to address that gap by analyzing the relationships between suicide rates and household income, insurance coverage, unemployment rate, gender composition and mental distress at the county level in the United States. Using a dataset from County Health Rankings & Roadmaps (CHR&R) in 2023 covering over 3,000 counties [4], we apply linear regression modeling to explore how these distributions influence the suicide rates. By identifying significant associations, the research results will provide valuable references for policy-making, especially in suicide prevention strategies for economically vulnerable groups and those at high risk based on gender and health. The remainder of this paper is structured as follows. Section 2 contains data exploration and visualization, which shows the data cleaning process, detailed data information and association between different variables. In Section 3, a model is built and used to tell the relationship between each variable mentioned above and suicide rate. In section 4, we will discuss the results of the model and explain how unemployment, income, gender and insurance affect suicide rate. Conclusions, recommendations and ideas for future work are included in section 5.
2. Literature review
Suicide becomes a significant public issue, leading approximately 800,000 lives worldwide each year and being the second cause of death among teenagers and young adults. Although there are lots of precautionary measures to avoid this situation, an increasing number of suicide rate indicates that it is a difficult issue [5]. By reading a large amount of literature, suicide is mainly influenced by the following aspects.
2.1. Household income and insurance coverage
Nowadays, the structural determinants of society behind suicide have been learned a lot. A report in 2024 found that the suicide rate of the counties in the United State with higher health insurance coverage is twenty six percent lower than the counties with lowest coverage. Insurance coverage can improve the accessibility of mental health services, providing intervention to those with psychological distress [6]. As a higher insurance coverage rate can enhance individuals' access to mental health services, it makes it easier for people with mental illnesses or distress to receive early screening, psychological counseling and crisis intervention, which may effectively reduce the risk of suicide.
Additionally, suicide rate of the counties with higher household income level is also thirteen percent lower than the counties with lowest household income level. This report claims that higher income level can improve housing stability and life satisfaction, thus might be related to lower suicide rate [6]. Higher family income often means better housing conditions, greater stability and satisfaction in life, as well as a better ability to meet daily living needs. Thus, their mental health is more stable instead of sentimental emotion. This discovery indicates that people whose socio-economic support systems, including medical insurance coverage and income security, are stable and reasonable, there are more likely to reduce the occurrence of suicide.
2.2. Unemployment and gender
In previous research, self-actualization and population structure play an important role in explaining suicide. In a paper of Steven Stack, unemployment represents a break between individuals and society, bringing mental stress. This weakened sense of identity and the intense mental pressure of life lead people into self-doubt and anxiety, which leads to suicide [3]. The construction of social gender roles affects the suicide rate either. A large number of articles show that the suicide rate of male is higher than female. One potential explanation is that the traditional expectations for men, such as suppressing negative emotions, could prevent them from seeking support and lead to worse mental health outcomes, which is related to suicide [3]. This latent concept of gender differences means male usually endow themselves with behaviors beyond their capabilities and a high degree of self-prediction, leading to increased pressure and higher suicide rates.
2.3. Frequent mental distress
As society pays more attention to mental health issues, an increasing number of studies have begun to emphasize that mental distress plays a key role in suicidal behavior [7]. Mental distress, including depression, anxiety and psychological suffering, is becoming increasingly significant for suicide rate. Some studies have shown that people with emotional and mental disorders increase their risk of suicide [8]. Due to the lack of clinical trial experience, non-clinical psychological distress is overlooked. But these problems still pose a great threat and difficulty to people's mental health, leading to suicide. However, most previous studies have concentrated on certain types of psychiatric disorder and few have investigated the general mental distress. Therefore, in this research the association of frequent mental distress value and suicide rate is studied.
3. Methodology
3.1. Data cleaning
In the dataset, variables with majority of missing data and rows with missing suicide raw data were removed. To find out the relationship between suicide and the remaining variables, scatter plots that has suicide raw value as dependent variable and the rest as independent variable. The original plot is essentially skewed to x-axis, but after taking log transformations, the association became more obvious. Among all those scatter plots, ones that has relatively strong associations are pick to draw regression lines, and analyze the relationship through regression model summary output.
3.2. Focused data collection
|
Variable |
Mean |
Median |
Standard |
|
Suicide |
18.88 |
17.73 |
7.835029 |
|
Unemployment |
0.04800 |
0.04531 |
0.01607678 |
|
Frequent Mental Distress |
0.15873 |
0.15900 |
0.01952718 |
|
Median Household Income |
60577 |
57723 |
15764.26 |
|
Female |
0.4984 |
0.5012 |
0.01867266 |
|
Insurance |
0.11398 |
0.10260 |
0.04899117 |
|
Air pollution |
7.787 |
8.000 |
1.615473 |
The factors identified from Table 1 were selected according to predefined criteria. These factors are graphically represented, followed by a detailed analysis.
3.3. Data analysis
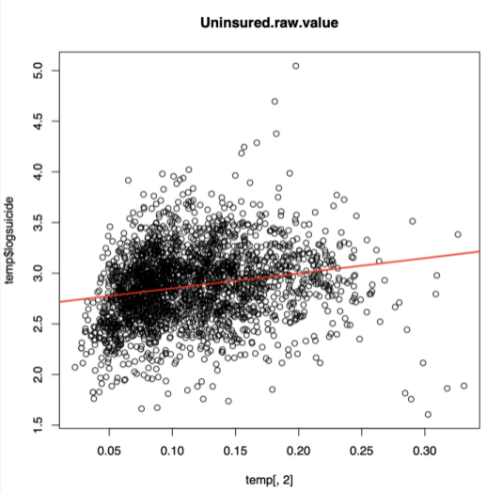
In Figure 1, this weak positive correlation suggests that within the context of these two variables, there is a slight linear tendency where higher values of insurance are associated with higher log_suicide. But since the correlation is weak, we can't rely on insurance alone to predict log-suicide accurately.
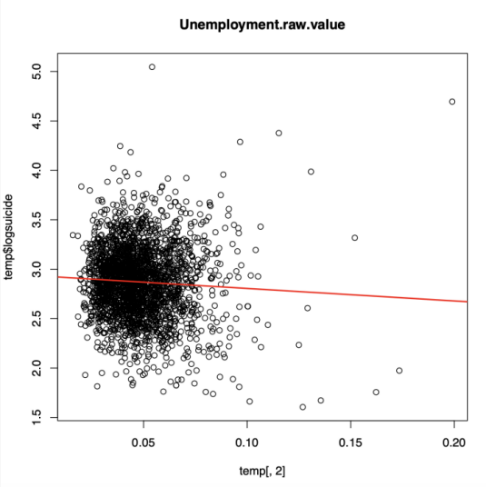
Figure 2 shows the regression line for log-suicide and unemployment. Since the correlation is equal to -0.056, the association of two variable is weakly negative, which means that as unemployment rate increases, the proportion of suicide probably decrease.
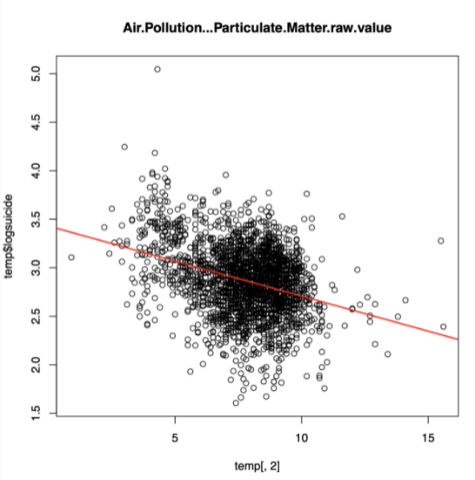
Figure 3 shows the downward-sloping regression line suggests that as air pollution increases, log-suicide tends to decrease. Visually, the data points are scattered around the regression line. This indicates that the linear relationship might not be very strong
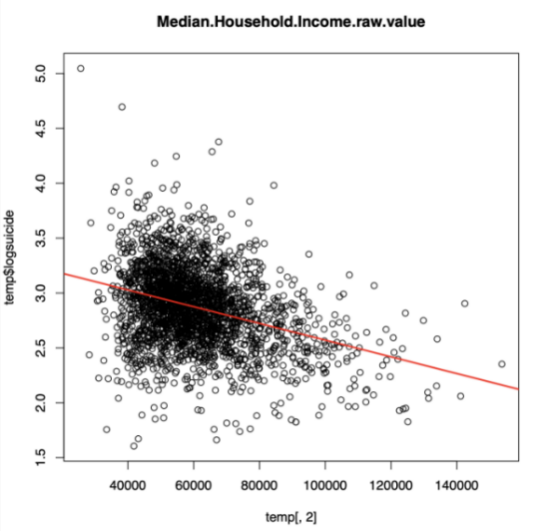
The correlation coefficient of –0.334 indicates a moderate negative linear relationship between median household income and the log-suicide rate in the figure 4. In general, this suggests that higher median income is mildly associated with lower suicide rates.
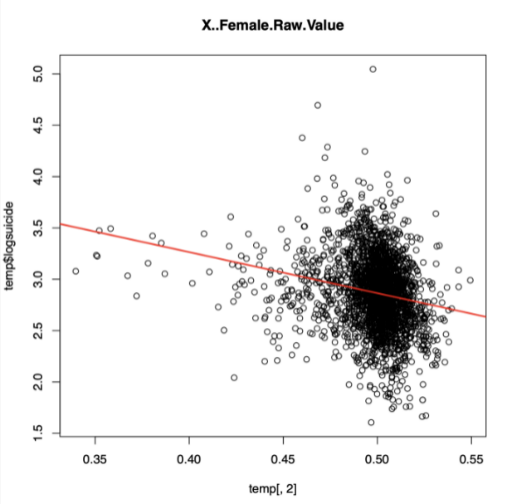
In the figure 5, the correlation coefficient r=−0.207 indicates a weak negative linear relationship between female and log-suicide. There are some outliers which are much higher than expected value, but the overall distribution is still negative.
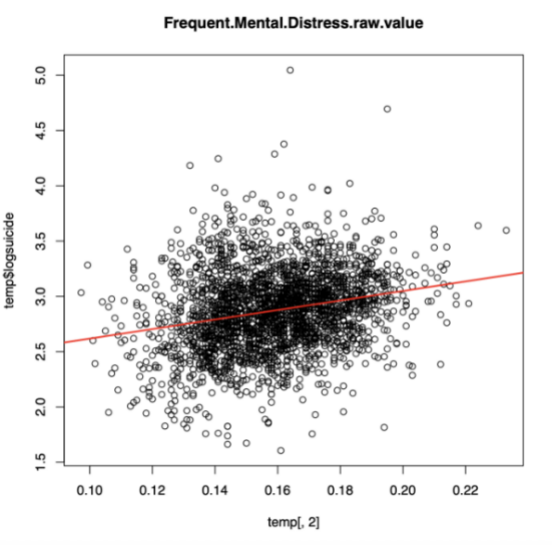
In the figure 6, the correlation of log-suicide and frequent mental distress is 0.234. This means that, as the rate of frequent mental distress increases, the suicide rate tends to increase slightly, though the association is not strong.
4. Modeling
4.1. The construction of linear regression model
Finding a model to tell the relationship between suicide rate and some other factors, such as unemployment rate, can be really hard, since 41 covariates are included in our data set. Therefore, reading previous research about various factors associated with suicide rate seems to be a reliable approach to find out the variable that could be included in the model. As a conclusion, unemployment rate, gender, income and insurance rate are studied frequently, showing their significance to suicide rate. Therefore, these factors are included in the model. It is noteworthy that some of these variables might be closely linked to other variables, such as unemployment rate could be affected by the proportion of rural region in the area, rural area and uninsured are incorporated, which are potential co-funding variables to the existing covariates in the model. To reduce the potential impact and make the model more accurate and reasonable, the final model, including unemployment rate, gender, median household income, uninsured rate, proportion of rural area, air quality and frequent mental distress is decided. During this process, we tried to join some other variables, for instance, percentage of over-drinking population in the model, but they were found insignificant to the result, which is illustrated by p-value greater than 0.05. Therefore, they were deleted from the model.
4.2. Regression diagnostics
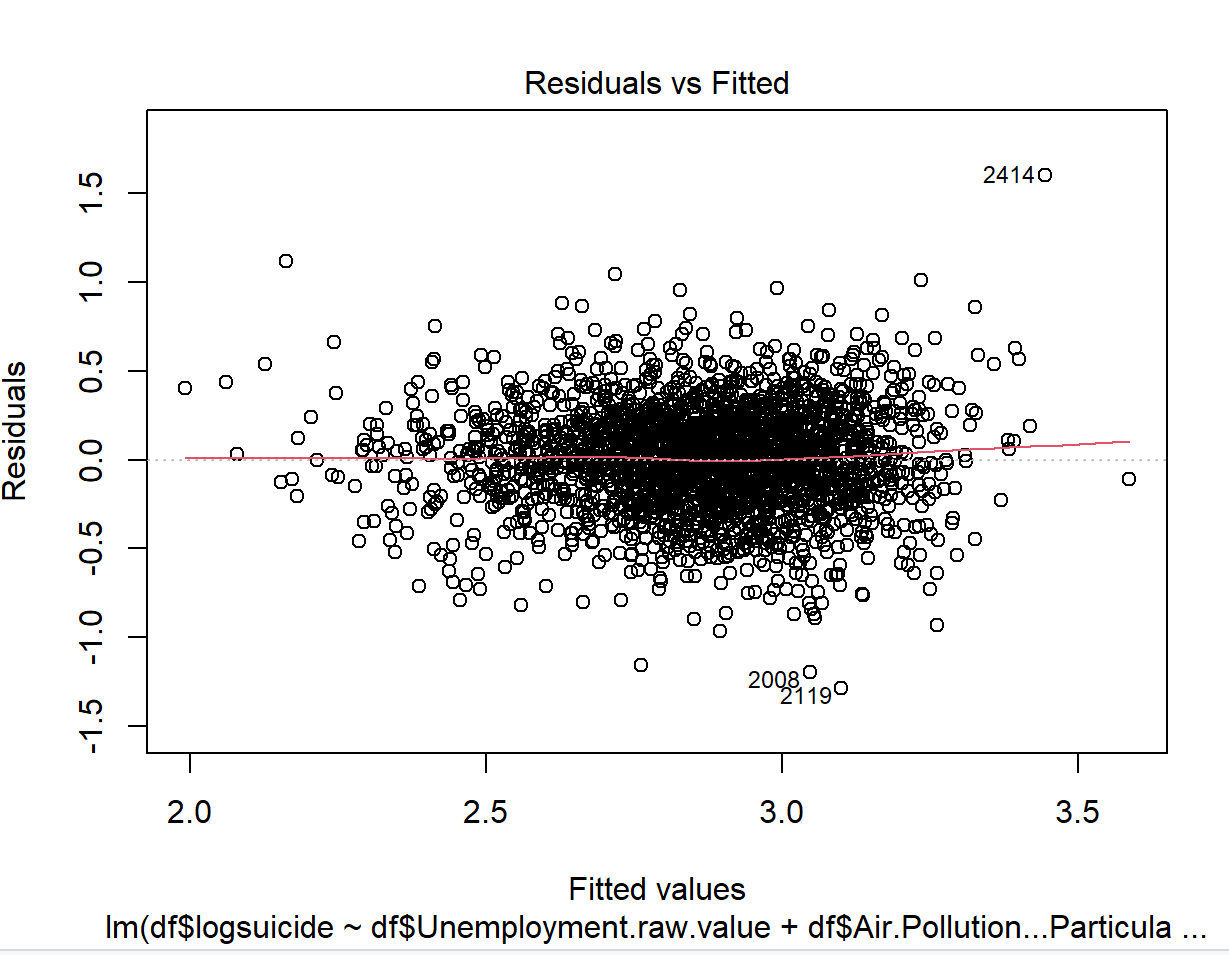
For the assumption of linearity, we first check the scatter plots of the standardized residuals versus numeric covariates. As shown in Figure 7, the Residuals versus Fitted plot after transformation indicates that there is no systematic relationship between residuals and predicted values. Therefore, the assumption of linearity appears to be reasonable.
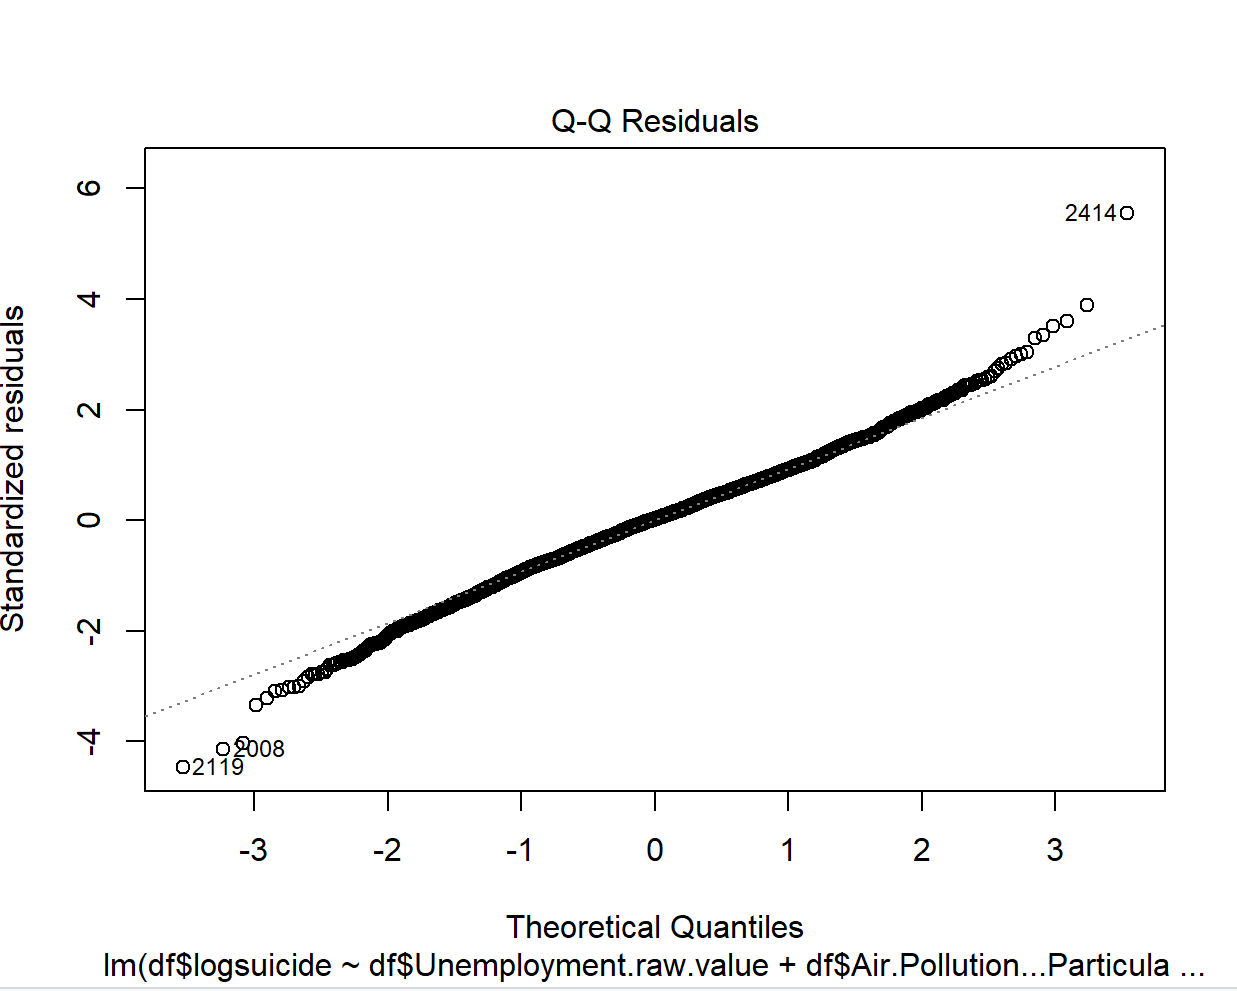
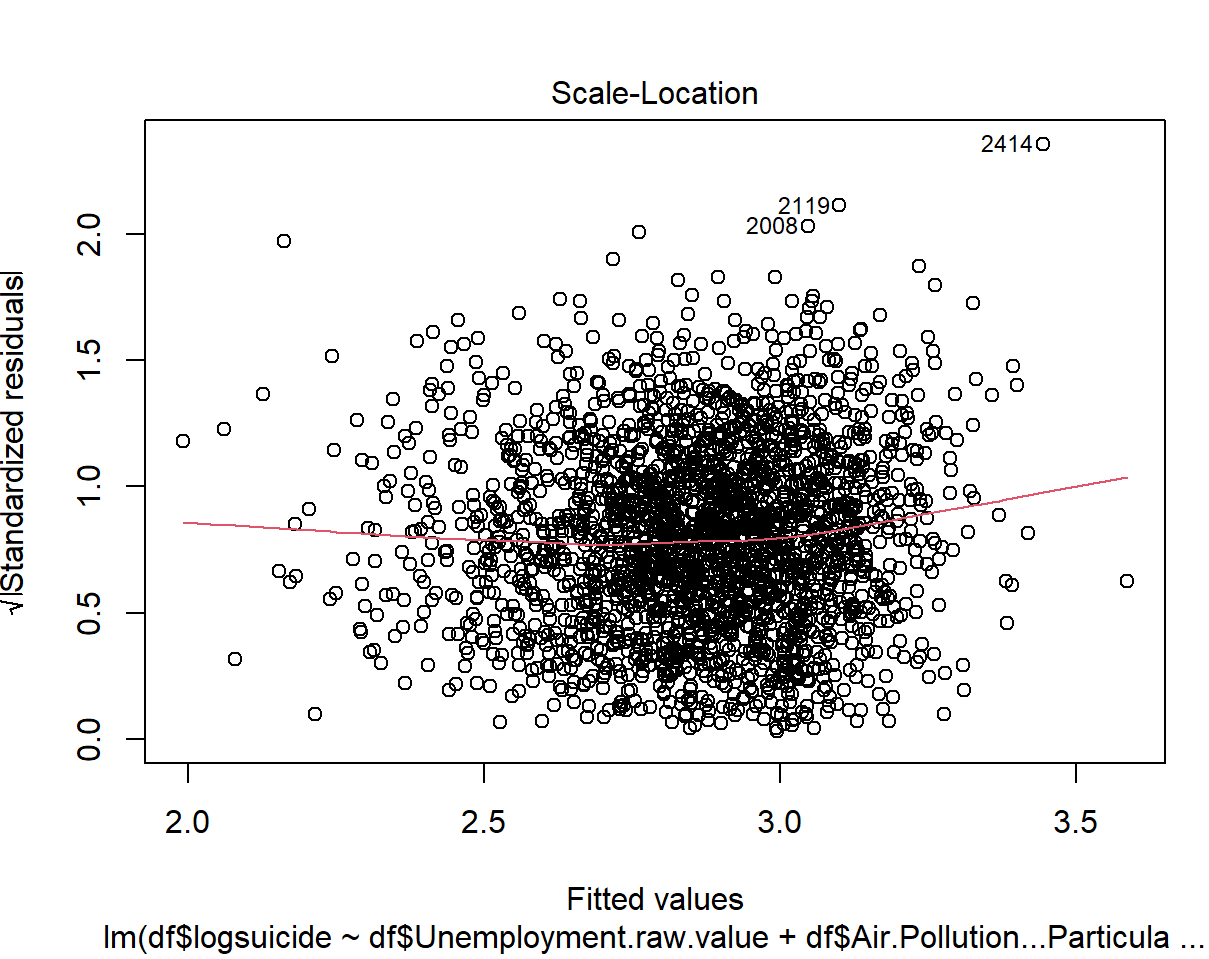
After transformation for explanatory variables, for the assumption of normally distributed errors, Figure 8 and Figure 9 show that with the exception of observations #2008, #2119 and #2414, most part of the observations fall close to the straight line and are within the 95% confidence interval, which is marked by a dashed line. Thus, there is no evidence against the normality assumption.
4.3. Unusual observations
As illustrated in Figure 8, #2119 has the largest negative residual, which indicates that our model overestimated the suicide rate in this country. On closer inspection, #2119, which is Hocking County, has the lowest suicide rate among all the counties in America. Generally speaking, a country with low suicide rate usually has the higher insured rate and low unemployment rate. However, comparing with RutherFord County (#2008), which has the second lowest residual, the unemployment rate and insured rate are significantly outperformed when the differences between other covariates are not obvious in these two countries. This illustrates that the suicide rate is low due to some other reasons, possibly associated with the beautiful scenery, where people can visit the park to release the pressure.
#2414 is also overestimated by our regression model as shown by Figure 8. We found that #2414 is Brule County, which has the highest suicide in America. However, deleting this country does not show a notable impact on the interception term and each estimated covariate coefficient. Equivalently, DFBETAS plots also confirm this point. Additionally, all covariates of Brule County do not exist particularly significant extreme values in the whole original data set; they all located in either mean or the third quantile of their own categories.
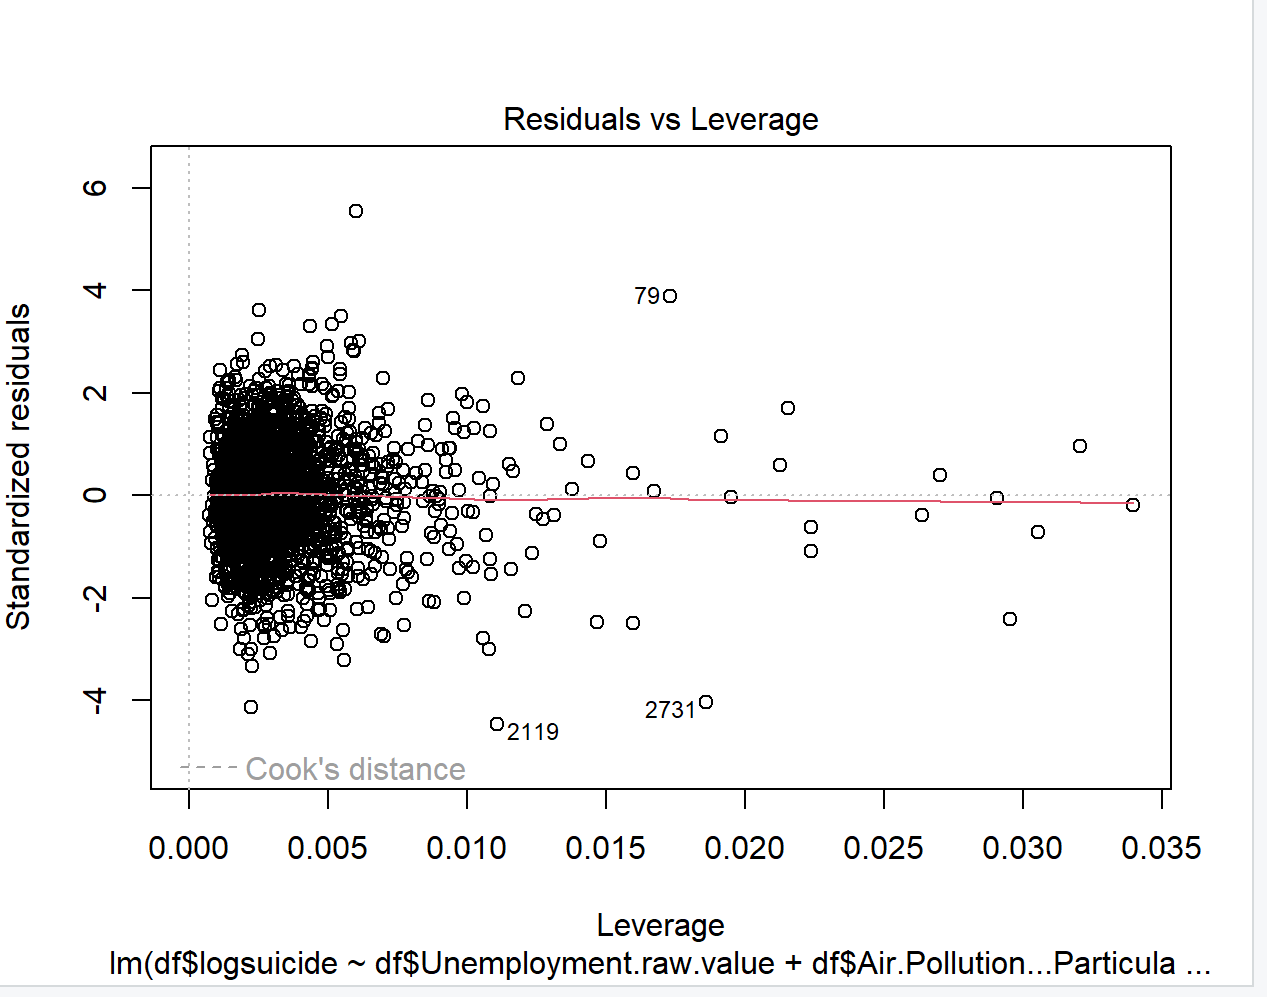
According to Figure 10, Hoonah-Angoon Census Area (#79) has the second highest leverage and Matagorda County (#2731) possess the second lowest leverage. However, these two regions do not show up as outliers in Figure 8. Therefore, we keep them in our model since they do not affect the model significantly. In contrast, Hocking County (#2119) appeared in both Figure 8 and Figure 10, which has essential effect on the mode. Thus, we decide to delete it.
4.4. Regression results & interpretation
|
Coefficient |
Estimate |
Std.Error |
t-value |
p-value |
|
Intercept |
4.10E+00 |
1.812e-01 |
22.604 |
<2e-16*** |
|
Unemployment |
-3.35E+00 |
3.983e-01 |
-8.419 |
<2e-16*** |
|
Air Pollution |
7.47E+00 |
3.878e-03 |
-19.253 |
<2e-16*** |
|
Frequent Mental Distress |
2.365e+00 |
4.227e-01 |
5.53 |
3.55e-08*** |
|
Female |
-1.61E+00 |
3.299e-01 |
-4.891 |
1.07e-06*** |
|
Median Household Income |
-4.24E-06 |
5.351e-07 |
-7.916 |
3.67e-15*** |
|
Uninsured |
7.269e-01 |
1.287e-01 |
5.646 |
1.83e-08*** |
|
Rural |
2.305e-01 |
2.397e-02 |
9.619 |
<2e-16*** |
As detailed in Table 2, the linear regression analysis identifies multiple significant covariates. Unemployment, Female proportion, and Median Household Income show significant negative coefficients. Conversely, Air Pollution, the prevalence of Frequent Mental Distress, the Uninsured rate, and the Rural indicator are all positively and significantly associated with the outcome variable.
4.4.1. Employment rate
A 1% increase in unemployment rate was associated with a −4.216 decrease in suicide rate. This finding contradicts prior literature. Potential explanations include lower psycho-social stress in rural areas (where unemployment rates are often higher), healthier lifestyles, and slower-paced living environments.
4.4.2. Air pollution (PM2.5)
A 1% increase in average daily PM2.5 concentration (μg/m³) was linked to a −0.08007 change in suicide rate. This result diverges from existing research, warranting further investigation into potential confounding factors (e.g., regional differences in pollution exposure).
4.4.3. Frequent mental distress
A 1% increase in adults reporting ≥14 poor mental health days/month correlated with a +3.454 rise in suicide rate. The consequence aligns with established literature on mental health and suicide risk.
4.4.4. Proportion of women
A 1% increase in female population share predicted a −2.291 reduction in suicide rate. The result is consistent with historical studies showing lower suicide rates among women.
4.4.5. Median household income
Each $1 increase in income corresponded to a −5.363 × 10⁻⁶ decline in suicide rate. This supports prior evidence linking higher income to reduced suicide risk, albeit with a marginal effect size.
5. Conclusion
This study examines the factors that are associated with suicide rates among US counties. The overall suicide rate has been rising year by year, finding factors which is the most significant influencing suicide rate in the US. Therefore, analyzing how they affect suicide rates is important.
The first influencing factor is the household income. Our research also shows that higher income is associated with lower suicide rate, consistent with previous studies. Uninsured population is the second important element. There is a positive association between uninsured population and suicide rate. Increasing uninsured population is in positive relation with higher suicide rate because people who lack of healthcare insurance are less likely to access healthcare facilities and get worse mental health outcomes.
The third contributor is the unemployment rate. There are lots of articles providing opposite opinion and most of them suggest that higher unemployment rate leads to higher suicide rate. A common finding was that higher unemployment rate was related to a greater risk of suicide and suicide attempt. However, the data in our research evidence lower suicide rate is related with higher unemployment rate, which contrary to the conclusion of the previous articles. Individual-level data and county-level data come from different sources. However our data is aggregated to the county level, some information might be omitted during this process.
In addition to factors discussed above, gender is also important. According to data visualizations and analysis, the suicide rate is lower in areas with a higher proportion of woman, which is consistent with historical studies, showing that suicide rates are lower among women compared to man. But this may be caused by different population proportion.
The last element is mental health. The data analyzing in the research provides that the number of days with poor mental health is increasing, and the suicide rate is rising in agreement with previous articles. As for Peiyin Hung’s opinion, a small but negative association between the number of Concise Mental Health Checklist and suicide death rates. Therefore, keeping mental health is important to reduce suicide rates.
However, there are also some limitations in the research. The first limitation is there may be some omitted reasons that affect both unemployment and suicide behaviors simultaneously, giving opposite results compared to prior research. Additionally, lower suicide rate may not exactly relate with higher proportion of female. There might be some factors influence for both component of population and the suicide rate. Thus, further research can focus on finding the causal effects of unemployment and gender. At the same time, determining more factor that may associate with and affect suicide rate is important. Research shows that, suicide rates are associated with boomers and subsequent cohorts [9]. Moreover, it also related with education. Based on Maurizio Pompili’s opinion, suicide victims were significantly more often to have a higher education attainment [10]. All of these require further research.
Acknowledgements
Yixi Zhang, Yichen Xing, Ziyi Cai, Xinran Wang contributed equally to this work and should be considered co-first authors.
References
[1]. Felix Tran, “Income inequality and suicide in the United States: A spatial analysis of 1684 U.S. counties using geographically weighted regression”, 2020.
[2]. Holly Hedegaard, M.D., Sally C. Curtin, M.A., and Margaret Warner, Ph.D., “Suicide Rates in the United States Continue to Increase”, 2018.
[3]. Steven Stack, “Contributing factors to suicide: Political, social, cultural and economic”, 2021.
[4]. University of Wisconsin Population Health Institute. County Health Rankings Key Findings, 2023. https: //www.countyhealthrankings.org/health-data/methodology-and-sources/data-documentation
[5]. Gonzalo Martinez-Ales, Daniel Hernandez-Calle, Nicole Khauli & Katherine M. Keye, “Why Are Suicide Rates Increasing in the United States? Towards a Multilevel Reimagination of Suicide Prevention”, 2020.
[6]. Alison L. Cammack, PhD1; Mark R. Stevens, MSPH1; Rebecca B. Naumann, PhD1; Jing Wang, MD1; Wojciech Kaczkowski, PhD1; Jorge Valderrama, PhD2; Deborah M. Stone, ScD1; Robin Lee, PhD1, “Vital Signs: Suicide Rates and Selected County-Level Factors — United States", 2022.
[7]. Benson S. Ku, Jianheng Li, Cathy Lally, Michael T. Compton, Benjamin G. Druss, “Associations between mental health shortage areas and county-level suicide rates among adults aged 25 and older in the USA, 2010 to 2018”, 2021.
[8]. R. C. Evenson, J. B. Wood, E. A. Nuttall, D. W. Cho, “Suicide rates among public mental health patients”, 1982.
[9]. Julie A. Phillips, “A changing epidemiology of suicide? The influence of birth cohorts on suicide rates in the United States”, 2014.
[10]. Maurizio Pompili, Monica Vichi, Ping Qin, Marco Innamorati, Diego De LeoPaolo Girardi, “Does the level of education influence completed suicide?”, 2013.
Cite this article
Zhang,Y.;Xing,Y.;Cai,Z.;Wang,X. (2025). Influencing Factors of Suicide Rate in the United States. Theoretical and Natural Science,142,20-30.
Data availability
The datasets used and/or analyzed during the current study will be available from the authors upon reasonable request.
Disclaimer/Publisher's Note
The statements, opinions and data contained in all publications are solely those of the individual author(s) and contributor(s) and not of EWA Publishing and/or the editor(s). EWA Publishing and/or the editor(s) disclaim responsibility for any injury to people or property resulting from any ideas, methods, instructions or products referred to in the content.
About volume
Volume title: Proceedings of CONF-APMM 2025 Symposium: Simulation and Theory of Differential-Integral Equation in Applied Physics
© 2024 by the author(s). Licensee EWA Publishing, Oxford, UK. This article is an open access article distributed under the terms and
conditions of the Creative Commons Attribution (CC BY) license. Authors who
publish this series agree to the following terms:
1. Authors retain copyright and grant the series right of first publication with the work simultaneously licensed under a Creative Commons
Attribution License that allows others to share the work with an acknowledgment of the work's authorship and initial publication in this
series.
2. Authors are able to enter into separate, additional contractual arrangements for the non-exclusive distribution of the series's published
version of the work (e.g., post it to an institutional repository or publish it in a book), with an acknowledgment of its initial
publication in this series.
3. Authors are permitted and encouraged to post their work online (e.g., in institutional repositories or on their website) prior to and
during the submission process, as it can lead to productive exchanges, as well as earlier and greater citation of published work (See
Open access policy for details).
References
[1]. Felix Tran, “Income inequality and suicide in the United States: A spatial analysis of 1684 U.S. counties using geographically weighted regression”, 2020.
[2]. Holly Hedegaard, M.D., Sally C. Curtin, M.A., and Margaret Warner, Ph.D., “Suicide Rates in the United States Continue to Increase”, 2018.
[3]. Steven Stack, “Contributing factors to suicide: Political, social, cultural and economic”, 2021.
[4]. University of Wisconsin Population Health Institute. County Health Rankings Key Findings, 2023. https: //www.countyhealthrankings.org/health-data/methodology-and-sources/data-documentation
[5]. Gonzalo Martinez-Ales, Daniel Hernandez-Calle, Nicole Khauli & Katherine M. Keye, “Why Are Suicide Rates Increasing in the United States? Towards a Multilevel Reimagination of Suicide Prevention”, 2020.
[6]. Alison L. Cammack, PhD1; Mark R. Stevens, MSPH1; Rebecca B. Naumann, PhD1; Jing Wang, MD1; Wojciech Kaczkowski, PhD1; Jorge Valderrama, PhD2; Deborah M. Stone, ScD1; Robin Lee, PhD1, “Vital Signs: Suicide Rates and Selected County-Level Factors — United States", 2022.
[7]. Benson S. Ku, Jianheng Li, Cathy Lally, Michael T. Compton, Benjamin G. Druss, “Associations between mental health shortage areas and county-level suicide rates among adults aged 25 and older in the USA, 2010 to 2018”, 2021.
[8]. R. C. Evenson, J. B. Wood, E. A. Nuttall, D. W. Cho, “Suicide rates among public mental health patients”, 1982.
[9]. Julie A. Phillips, “A changing epidemiology of suicide? The influence of birth cohorts on suicide rates in the United States”, 2014.
[10]. Maurizio Pompili, Monica Vichi, Ping Qin, Marco Innamorati, Diego De LeoPaolo Girardi, “Does the level of education influence completed suicide?”, 2013.