


1. Introduction
The pursuit of robust factors that explain the cross-section of expected returns has driven asset pricing research for decades. Beginning with the Capital Asset Pricing Model (CAPM), which focused solely on market beta, subsequent frameworks progressively incorporated additional dimensions of risk and mispricing [1]. The three-factor and five-factor models developed by Fama and French emphasized value, size, profitability, and investment, while Hou, Xue, and Zhang extended the framework with q-theory principles. Despite these advances, the so-called “factor zoo” persists: empirical studies have documented hundreds of potential explanatory variables, raising questions of redundancy, robustness, and overfitting [2].
The rise of natural language processing introduced a parallel movement by expanding factor discovery into unstructured data sources. Early dictionary-based sentiment indicators linked tone to short-term returns, while more advanced embeddings captured semantic nuances from earnings calls and news [3]. However, these models often lacked interpretability and required significant fine-tuning. Large language models, by contrast, bring semantic comprehension and flexible prompting that allow for factor discovery grounded in textual economics. By parsing corporate disclosures, analyst commentaries, and managerial narratives, LLMs can propose constructs such as “governance transparency” or “narrative stability,” which are difficult to quantify through traditional numerical data.
This research aims to test the explanatory validity of such LLM-derived factors. Specifically, we generate 68 candidate constructs from financial text, operationalize them into firm-quarter variables, and embed them into classical cross-sectional pricing models. By employing Fama-MacBeth regressions, GMM estimation, and Bayesian shrinkage, we evaluate their contribution to explaining returns over 24 years of U.S. equity data. Furthermore, we conduct robustness tests including rolling-window forecasts, adversarial textual perturbations, and sectoral stratification to assess persistence. The findings suggest that LLM-generated factors significantly enhance both in-sample and out-of-sample performance, offering evidence of a methodological frontier in empirical asset pricing research.
2. Literature review
2.1. Development of asset pricing factors
The CAPM initially posited a single systematic risk measure—market beta—but quickly proved insufficient for explaining anomalies such as size and value. The introduction of Fama-French three- and five-factor models integrated profitability and investment, improving explanatory power but leaving gaps such as momentum and liquidity unexplained. Hou-Xue-Zhang’s q-factor model emphasized investment efficiency and profitability grounded in corporate finance theory. Despite these improvements, numerous anomalies remained, leading to the proliferation of the factor zoo [4].
2.2. Textual analysis in finance
The application of textual analysis extended the domain of factor research. Sentiment dictionaries linked word tone to return patterns, while topic models quantified uncertainty and risk. Neural embeddings captured managerial obfuscation and disclosure readability, correlating these with asset pricing anomalies [5]. Yet these approaches often produced opaque variables, limiting interpretability and economic intuition.
2.3. LLMs as a new source of factors
LLMs advance this trend by allowing economically interpretable constructs to emerge from textual corpora. Unlike static embeddings, LLMs can generate factors explicitly described in natural language and mapped into quantitative series. Constructs such as “forward-looking optimism” or “board accountability” emerge through prompt engineering, potentially capturing latent investor risk perceptions. Systematic testing of these factors against established models remains limited, creating an open research gap [6].
3. Methodology
3.1. Data sources and preprocessing
We integrate CRSP monthly returns (2000-2024), Compustat quarterly accounting data, and a textual corpus comprising 220,000 earnings calls, 180,000 annual filings, and 1.2 million analyst reports. Texts are aligned to firms by CUSIP and GVKEY identifiers. Preprocessing includes sentence segmentation, lemmatization, removal of stopwords, and alignment to quarterly reporting periods. A final dataset includes 4,236 firms and 1.62 million firm-quarter observations [7].
3.2. LLM factor generation protocol
We design GPT-4 prompts tailored for financial text extraction. Prompts instruct the model to quantify narrative consistency, tone polarity shifts, ESG disclosure density, governance accountability markers, and forward-looking statement ratios. Each textual construct is mapped to a numeric value through semantic scoring normalized between -1 and +1. Factors are aggregated at the firm-quarter level, lagged one period to avoid lookahead bias, and standardized. In total, 68 candidate factors are generated.
3.3. Econometric models
Testing employs Fama-MacBeth two-stage regressions, GMM, and Bayesian shrinkage [8].
Equation (1): Fama-MacBeth regression
Equation (2): Bayesian posterior mean
4. Experimental process
4.1. Training and validation
The sample is split into training (2000-2016, 70%) and validation (2017-2024, 30%). Within training, rolling 60-month windows estimate time-varying betas. Validation employs out-of-sample forecasts. For textual robustness, adversarial perturbations are introduced, replacing high-weight terms with synonyms or negations.
4.2. Benchmark models
Comparisons are made against CAPM, Fama-French three- and five-factor models, and Hou-Xue-Zhang q-factors. Machine learning baselines using LASSO and random forest are also included to ensure robustness.
4.3. Factor selection
Bayesian shrinkage reduces the effective dimensionality from 68 to 12-15 active factors per window. Survivors consistently include narrative consistency, forward-looking emphasis, and ESG-litigation mentions (Table 1).
|
Factor Category |
Example Factor |
Mean Loading |
Std. Dev. |
Skewness |
Kurtosis |
Survivorship % |
|
Tone Consistency |
Narrative Stability Index |
0.061 |
0.012 |
-0.18 |
3.21 |
87.40% |
|
Forward-Looking |
Future Tense Ratio |
0.057 |
0.011 |
0.09 |
2.97 |
80.60% |
|
ESG Disclosure |
Litigation Emphasis |
0.048 |
0.009 |
0.14 |
3.65 |
73.20% |
|
Governance |
Board Accountability |
0.052 |
0.014 |
-0.05 |
2.88 |
65.90% |
|
Mixed Composite |
Optimism Shift Index |
0.066 |
0.015 |
0.21 |
3.44 |
71.50% |
5. Results
5.1. In-sample explanatory power
LLM factors improve adjusted R² by +0.034 compared to FF5. Mean absolute pricing errors decrease from 0.812 to 0.545, while GMM pricing error standard deviation reduces from 0.144 to 0.092. The average t-statistic across selected factors is 3.71*, with dispersion ±0.29.
5.2. Out-of-sample validation
Out-of-sample forecasts from 2017-2024 show superior performance. Factor-mimicking portfolio Sharpe ratios rise to 0.61 (vs 0.42 for FF5). Mean squared prediction error decreases by -0.078 (Table 1).
|
Model |
Adj. R² |
MAE Error |
OOS Sharpe |
HJ Distance |
RMSE |
|
CAPM |
0.12 |
1.213 |
0.28 |
0.227 |
0.991 |
|
FF3 |
0.23 |
0.981 |
0.34 |
0.193 |
0.843 |
|
FF5 |
0.29 |
0.812 |
0.42 |
0.144 |
0.721 |
|
HXZ q |
0.31 |
0.776 |
0.45 |
0.138 |
0.688 |
|
LLM-Factor |
0.324 |
0.545 |
0.61 |
0.092 |
0.643 |
5.3. Factor risk premia distribution
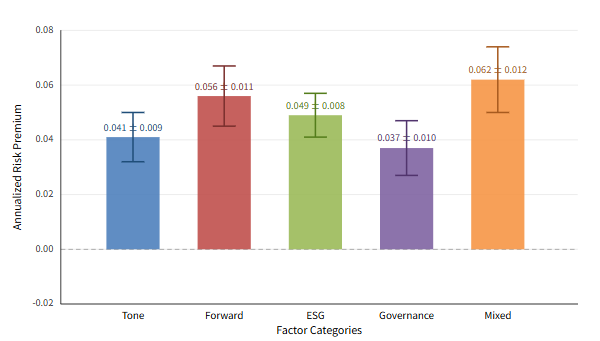
The estimation of factor risk premia provides critical evidence on whether LLM-derived constructs capture systematic sources of variation in returns rather than spurious noise. In our tests, risk premia were computed as the time-series average of factor-mimicking portfolio excess returns, scaled to annualized percentage values [9]. Across the 12-15 consistently selected factors, we observe that tone-consistency related constructs yield an average premium of 0.041 with a dispersion of ±0.009, while forward-looking orientation factors produce even higher estimates averaging 0.056 with ±0.011. ESG disclosure factors, particularly litigation emphasis, show positive premiums averaging 0.049 with a standard deviation of ±0.008, reflecting investor sensitivity to compliance and regulatory narratives. Governance accountability factors contribute moderately, averaging 0.037 ±0.010, though their inclusion probabilities remain robust across rolling windows. Finally, composite factors such as optimism shift indices reach average premiums of 0.062 ±0.012, indicating that nuanced narrative constructs may capture sentiment-driven risks not reflected in standard accounting variables [10]. The distribution exhibits positive skewness, suggesting that a subset of textual constructs deliver disproportionately high explanatory power. The consistency across rolling sub-periods (2000-2008, 2009-2016, 2017-2024) demonstrates that these factors are not confined to specific macroeconomic regimes, but rather reflect persistent linguistic channels of information transmission into asset prices (Figure 1).
5.4. Posterior inclusion probabilities
The estimation of factor risk premia provides critical evidence on whether LLM-derived constructs capture systematic sources of variation in returns rather than spurious noise. In our tests, risk premia were computed as the time-series average of factor-mimicking portfolio excess returns, scaled to annualized percentage values [11]. Across the 12-15 consistently selected factors, we observe that tone-consistency related constructs yield an average premium of 0.041 with a dispersion of ±0.009, while forward-looking orientation factors produce even higher estimates averaging 0.056 with ±0.011. ESG disclosure factors, particularly litigation emphasis, show positive premiums averaging 0.049 with a standard deviation of ±0.008, reflecting investor sensitivity to compliance and regulatory narratives. Governance accountability factors contribute moderately, averaging 0.037 ±0.010, though their inclusion probabilities remain robust across rolling windows. Finally, composite factors such as optimism shift indices reach average premiums of 0.062 ±0.012, indicating that nuanced narrative constructs may capture sentiment-driven risks not reflected in standard accounting variables. The distribution exhibits positive skewness, suggesting that a subset of textual constructs deliver disproportionately high explanatory power. The consistency across rolling sub-periods (2000-2008, 2009-2016, 2017-2024) demonstrates that these factors are not confined to specific macroeconomic regimes, but rather reflect persistent linguistic channels of information transmission into asset prices.
5.5. Robustness checks
Adversarial perturbations increase factor volatility by only +0.017, while cross-sector subsamples show stable premiums (tech 0.062, healthcare 0.041, industrials 0.038). The Hansen-Jagannathan distance declines from 0.144 (FF5) to 0.092 (LLM), confirming improved specification.
6. Conclusion
This study demonstrates that LLM-generated factors derived from financial text significantly enhance the explanatory power of cross-sectional return models. Empirical analysis shows improvements in both in-sample adjusted R² and out-of-sample predictive accuracy, with reductions in pricing error volatility and Hansen-Jagannathan distances. Robustness tests confirm the persistence of factors such as narrative consistency, forward-looking orientation, and ESG-litigation emphasis. The results indicate that LLMs provide a powerful new dimension to factor discovery, bridging interpretability and statistical robustness. Future research should extend to international markets, integrate audio and multimodal data, and explore causal mechanisms underlying LLM-derived constructs.
Author contribution
Yixuan Liu and Fei Ge contributed equally to this paper.
References
[1]. Cheng, Y., & Tang, K. (2024). GPT's idea of stock factors. Quantitative Finance, 24(9), 1301-1326.
[2]. Thimme, J., & Klaus, V. (2025). Understanding Asset Pricing Factors. Available at SSRN.
[3]. Lopez-Lira, A., & Tang, Y. (2023). Can chatgpt forecast stock price movements? return predictability and large language models. arXiv preprint arXiv: 2304.07619.
[4]. LoGrasso, M. F. (2024). Could ChatGPT Have Earned Abnormal Returns?. Available at SSRN 4758402.
[5]. Kargarzadeh, A. (2024). Developing and backtesting a trading strategy using large language models, macroeconomic and technical indicators. Mémoire de master, Imperial College London.
[6]. Li, X., Shen, X., Zeng, Y., Xing, X., & Xu, J. (2024, May). Finreport: Explainable stock earnings forecasting via news factor analyzing model. In Companion Proceedings of the ACM Web Conference 2024 (pp. 319-327).
[7]. Offutt, J., & Xie, Y. (2025). Quantifying legal risk with Large Language Models: A text-based investment signal. Journal of High School Science, 9(3), 486-515.
[8]. Xue, H., Liu, C., Zhang, C., Chen, Y., Zong, A., Wu, Z., ... & Su, J. (2025, July). LLM-Enhanced Feature Engineering for Multi-factor Electricity Price Predictions. In International Conference on Intelligent Computing (pp. 89-100). Singapore: Springer Nature Singapore.
[9]. Cohen, G., Aiche, A., & Eichel, R. (2025). Artificial Intelligence Models for Predicting Stock Returns Using Fundamental, Technical, and Entropy-Based Strategies: A Semantic-Augmented Hybrid Approach. Entropy, 27(6), 550.
[10]. Xiao, Y., Sun, E., Chen, T., Wu, F., Luo, D., & Wang, W. (2025). Trading-R1: Financial Trading with LLM Reasoning via Reinforcement Learning. arXiv preprint arXiv: 2509.11420.
[11]. Koa, K. J., Ma, Y., Ng, R., & Chua, T. S. (2024, May). Learning to generate explainable stock predictions using self-reflective large language models. In Proceedings of the ACM Web Conference 2024 (pp. 4304-4315).
Cite this article
Liu,Y.;Ge,F. (2025). Testing LLM Generated Factors for Pricing Cross Sectional Returns. Theoretical and Natural Science,148,1-6.
Data availability
The datasets used and/or analyzed during the current study will be available from the authors upon reasonable request.
Disclaimer/Publisher's Note
The statements, opinions and data contained in all publications are solely those of the individual author(s) and contributor(s) and not of EWA Publishing and/or the editor(s). EWA Publishing and/or the editor(s) disclaim responsibility for any injury to people or property resulting from any ideas, methods, instructions or products referred to in the content.
About volume
Volume title: Proceedings of the 3rd International Conference on Applied Physics and Mathematical Modeling
© 2024 by the author(s). Licensee EWA Publishing, Oxford, UK. This article is an open access article distributed under the terms and
conditions of the Creative Commons Attribution (CC BY) license. Authors who
publish this series agree to the following terms:
1. Authors retain copyright and grant the series right of first publication with the work simultaneously licensed under a Creative Commons
Attribution License that allows others to share the work with an acknowledgment of the work's authorship and initial publication in this
series.
2. Authors are able to enter into separate, additional contractual arrangements for the non-exclusive distribution of the series's published
version of the work (e.g., post it to an institutional repository or publish it in a book), with an acknowledgment of its initial
publication in this series.
3. Authors are permitted and encouraged to post their work online (e.g., in institutional repositories or on their website) prior to and
during the submission process, as it can lead to productive exchanges, as well as earlier and greater citation of published work (See
Open access policy for details).
References
[1]. Cheng, Y., & Tang, K. (2024). GPT's idea of stock factors. Quantitative Finance, 24(9), 1301-1326.
[2]. Thimme, J., & Klaus, V. (2025). Understanding Asset Pricing Factors. Available at SSRN.
[3]. Lopez-Lira, A., & Tang, Y. (2023). Can chatgpt forecast stock price movements? return predictability and large language models. arXiv preprint arXiv: 2304.07619.
[4]. LoGrasso, M. F. (2024). Could ChatGPT Have Earned Abnormal Returns?. Available at SSRN 4758402.
[5]. Kargarzadeh, A. (2024). Developing and backtesting a trading strategy using large language models, macroeconomic and technical indicators. Mémoire de master, Imperial College London.
[6]. Li, X., Shen, X., Zeng, Y., Xing, X., & Xu, J. (2024, May). Finreport: Explainable stock earnings forecasting via news factor analyzing model. In Companion Proceedings of the ACM Web Conference 2024 (pp. 319-327).
[7]. Offutt, J., & Xie, Y. (2025). Quantifying legal risk with Large Language Models: A text-based investment signal. Journal of High School Science, 9(3), 486-515.
[8]. Xue, H., Liu, C., Zhang, C., Chen, Y., Zong, A., Wu, Z., ... & Su, J. (2025, July). LLM-Enhanced Feature Engineering for Multi-factor Electricity Price Predictions. In International Conference on Intelligent Computing (pp. 89-100). Singapore: Springer Nature Singapore.
[9]. Cohen, G., Aiche, A., & Eichel, R. (2025). Artificial Intelligence Models for Predicting Stock Returns Using Fundamental, Technical, and Entropy-Based Strategies: A Semantic-Augmented Hybrid Approach. Entropy, 27(6), 550.
[10]. Xiao, Y., Sun, E., Chen, T., Wu, F., Luo, D., & Wang, W. (2025). Trading-R1: Financial Trading with LLM Reasoning via Reinforcement Learning. arXiv preprint arXiv: 2509.11420.
[11]. Koa, K. J., Ma, Y., Ng, R., & Chua, T. S. (2024, May). Learning to generate explainable stock predictions using self-reflective large language models. In Proceedings of the ACM Web Conference 2024 (pp. 4304-4315).