


1. Introduction
With the development of social economy and the progress of agricultural science and technology, food production has become more important because of its environmental and health protection [1]. Food production inevitably causes environmental pollution in various ways. For instance, in the production of apples, fruit farmers often rely excessively on chemical fertilizers, which can lead to soil hardening, acidification, and salinization [2]. In addition, the wax oil painted on the apples to make them look better contributes to air and water pollution due to its industrial waste gas and wastewater. Moreover, the packaging and transportation processes cause air pollution as fossil fuels are burned. Therefore, it is crucial to study the impact of food production on the environment so as to effectively protect the world.
Professor Quijas and Balvanera pointed out that food production derived from agriculture depends on a wide diversity of crop species found across the planet. As many as one hundred different crops used for human food are registered in global agricultural databases, and many more are locally grown and consumed [3]. Additionally, food production has a direct and indirect impact on the environment. Like Mondal delivered that direct impacts include land degradation, air and water pollution, and energy consumption. Indirect impacts include deforestation, soil erosion, biodiversity loss, and climate change [4]. For example, intensive lives stock farming is responsible for an increase in greenhouse gas emissions, while pesticides used in industrial farming degrade soil and cause water pollution.
Moreover, the transportation of food products contributes to air pollution and increases energy consumption. Therefore, it is important to consider the environmental consequences of food production when evaluating its sustainability reported by Hartmann, Lazzarini, Funk and Siegrist [5]. The successful management of agricultural resources to meet human needs while preserving or improving environmental quality and protecting natural resources for future generations is the foundation of sustainable agriculture. Together with efficient water and crop management, improving agricultural sustainability management of soil fertility and soil physical properties, as well as their best use properties [6]. Besides, about the sustainability of the environment, developmental agriculture is one of the most essential industries that is included. Agricultural significantly harms the environment in three fundamental ways: It first needs a lot of freshwater, which can put a lot of pressure on the ecosystem in places where there is a shortage of water. In addition to requiring water as an input, it also releases nutrients that pollute rivers, lakes, and seas. It is a significant contributor to climate change as well, accounting for around a quarter of global greenhouse gas emissions. Finally, due to its extensive use of land, agriculture has a significant negative influence on the environment worldwide. In the world, agriculture occupies half of the livable land [7]. To sum up, it is a meaningful question that can be researched.
This research provides people with an opportunity to make tangible contributions to environmental protection in daily life, instead of simply relying on awareness-raising campaigns and appeals. It gives individuals the chance to contribute to a better world. At present, the challenge lies in finding solutions to minimize the negative impact of food production on the environment. Consequently, it is essential to address the problem of food production from two perspectives: raising awareness and improving technology. The first step is to promote green production and planting practices among food producers. Additionally, innovative green business models should be implemented in order to help reduce pollutant emissions. For this purpose, the government should develop policies and regulations to ensure compliance with green industrial standards [8]. On the technological side, sustainable development should be pursued through the implementation of new food maximization models such as waste recycling, secondary processing of raw materials, and food packaging. It can also promote products from a new perspective, like distributing expired milk to others for skin care [9]. All these measures are necessary for the protection of the environment.
According to the preview of research, it can be hypothesized that that bean products and oil products, such as olive oil, sunflower oil, and oatmeal, have the least pollution to the environment. Meat food, such as beef (including beef herd and dairy herd) and eggs, has the greatest environmental pollution. Because the production of beans and several simple plants requires less water, and the growing environment is not so harsh. Unlike vegetables and fruits, they are simple to package, easy to transport, and convenient to store. Compared with beans, meat food is much more complex: Firstly, they are all obtained from animals, which will inevitably consume a lot of water and various feeds. Then, the packaging conditions are also more stringent. Many meat products use vacuum packaging to prevent bacteria from entering, which is basically plastic (consisting of synthetic resin mostly). Finally, their storage and transportation conditions are not too easy as well. Many of them are fresh products, which need to be delivered to consumers quickly in order to get higher profits. On the other hand, food production has a significant environmental impact, both through the emissions of vehicles used in the harvesting and transportation process, and through the practices of food producers. It is essential to raise awareness and implement green business models in order to reduce pollutant emissions. Additionally, innovative food maximization models should be used to promote sustainable development and protect the environment [10]. In short, food production is closely related to environmental pollution.
2. Methodology
This paper selects the dataset from Kaggle. This dataset contains 43 kinds of most common foods grown globally and 23 columns for respective land, water usage, and carbon footprints. We divide the project into three parts. In the first part, we focus on the greenhouse gas emissions per kg of food product (Kg CO2 - equivalents per kg product) across different stages in the lifecycle of food production. In order to find out which process in food production brings how much negative impact to the environment, total greenhouse gas emission in this case, we have to classify food type and then continue to analyze. The results of generalization analysis for all foods cannot be generalized to every food because if we do so, the conclusions we draw will be too general and inaccurate, and they have no practical application values as well. However, it is also not necessary to analyze each food precisely because the workload will be overwhelming. Therefore, the types of foods are divided into two groups according to animals and plants, marked as animal-based food and plant-based food. Later, food is also subdivided into carbohydrates, proteins, fats, and others, according to the nutrients contained.
Firstly, our group identified the animal-based foods and plant-based foods. The factor used here is called “Animal.Feed”, a factor listed in columns. Clearly, if the value of “Animal.Feed” is larger than 0, it has to be an animal-based food, and vice versa for plant-based foods. The result is: Beef (beef herd), Beef (dairy herd), Lamb & Mutton, Pig Meat, Poultry Meat, Milk, Cheese, Eggs, Fish (farmed). And the rest whose Animal.Feed value equals to zero are accordingly plant-based foods. After this, we used boxplot for both animal-based and plant-based food to get a sense of how data looks like.
Next, our group focuses on the second part: the specific pollution emissions for each food. These specific pollutions include: Eutrophying emissions per kilogram (gPO₄eq per kilogram), Freshwater withdrawals per kilogram (liters per kilogram), Greenhouse gas emissions per 1000 kcal (kgCO₂eq per 1000 kcal), Land use per kilogram (m² per kilogram), and Scarcity-weighted water use per kilogram (liters per kilogram). These specific pollution binds together to partly contribute to the total emissions data. However, there is no guarantee that total emissions are caused all by these specific pollutions, so in order to see the relationships between them, a correlation summary is presented by Figure 1.
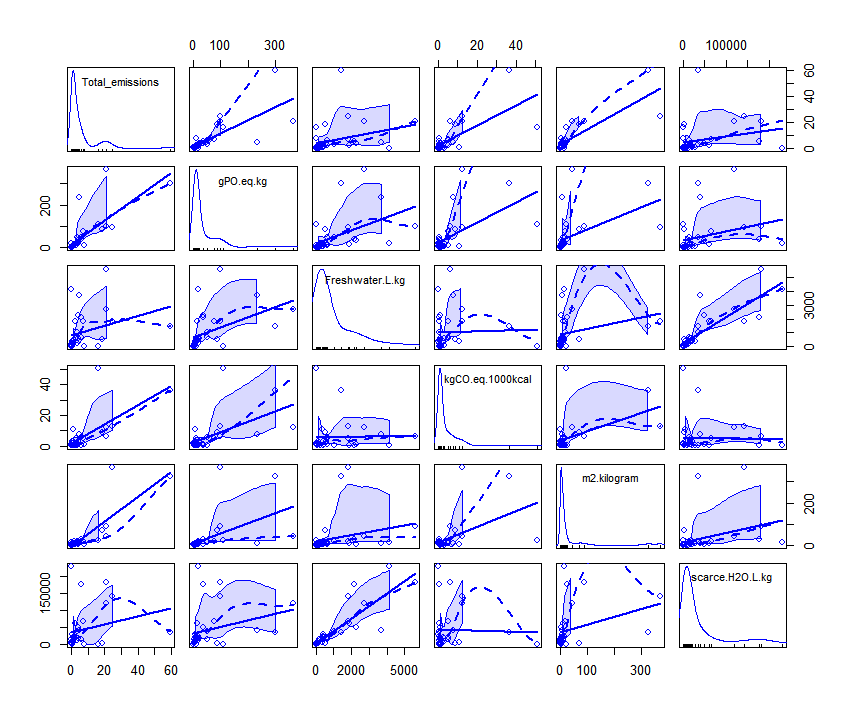
Figure 1. Trend lines between each pollution indexes.
Figure 1 shows that most combinations of the pollution factors have positive relationships with each other. Later, although our group knows that there exists a relationship between the specific pollution indexes and total emissions, we don’t know how strong the relationship is to allow us to draw conclusions. Therefore, we apply an intuitive linear regression to model the relationship.
The third part is in terms of the nutritional contents: within each category, which food has the lowest negative impacts on the environment. To deal with this, this paper assigns points to each food based on their specific pollution indexes. The standard is: compute the quartiles of each index, min-20%: 1 point, 20%-40%: 2 points, 40%-60%: 3 points, 60%-80%: 4 points, 80%-max: 5 points. This is straightforward because the quartile of each pollution indicator where each food is located represents which stage it is compared with other foods, and the lower the stage is, the less negative impacts this food will have on the environment. Each food receives their points according to the data.
Next, this paper divides foods based on their nutritional contents into five categories: Carbohydrates; Protein; Fruits and Vegetables; Oil/Fat; and Drinks/Snacks.
3. Result and Discussion
3.1. Comparison of the carbon emission levels of animal and plant-based foods
As Table 1 shows, a preliminary determination of the difference in carbon emissions between plant-based and animal-based foods was made by comparing the minimum, first quartile, median mean, third quartile, and maximum values of carbon emissions for animal-based and plant-based foods. The left side corresponds to the carbon emissions of animal-based food, and the right side corresponds to the carbon emissions of plant-based food.
Table 1. Summary of animal emissions vs. plant emissions.
Animal Emissions | Plant Emissions | ||
Min. | 2.8 | Min. | 0.2 |
1st Quartile | 5.1 | 1st Quartile | 0.7 |
Median | 7.1 | Median | 1.4 |
3rd Quartile | 21.2 | 3rd Quartile | 3.0 |
Max. | 59.6 | Max. | 18.7 |
Mean | 16.9 | Mean | 2.8 |
3.2. The correlation of multiple contamination items
The correlation of multiple contamination items is represented in Table 2. Six different items of environmental damage were selected. Values in the table represent the correlation between the objects corresponding to a specific row and column.
Table 2. Correlations between total emissions and each specific pollution index.
Total emissions | gPO.eq | Freshwater | CO2.eq | Land use | Scarce H20 | |
Total emissions | 1.000 | 0.753 | 0.303 | 0.697 | 0.829 | 0.235 |
gPO.eq | 0.753 | 1.000 | 0.475 | 0.566 | 0.500 | 0.288 |
Freshwater | 0.303 | 0.475 | 1.000 | 0.029 | 0.244 | 0.841 |
CO2.eq | 0.697 | 0.566 | 0.029 | 1.000 | 0.475 | -0.031 |
Land use | 0.829 | 0.500 | 0.244 | 0.475 | 1.000 | 0.324 |
Scarce H20 | 0.235 | 0.288 | 0.841 | -0.031 | 0.324 | 1.000 |
The results of the visualization of the correlations of the contaminated items are shown in the figure above. This diagram gives a more visual representation of what the table shows.
3.3. Objects with a strong relationship (with carbon emissions)
Table 3 shows the results of the relationship between total carbon emission and pollution objects processed by the linear regression model. There are four items gPO.eq.kg, Freshwater.L.kg, m2. Kilogram and PO.eq.kg: Freshwater.L.kg have p-values less than <0.05, and they are marked by asterisks. They are the objects that will be selected to have a strong correlation with total emissions.
Table 3. Linear regression model for total emissions and pollution indexes.
Coefficients | Estimate | Std. Error | t value | Pr(>|t|) | |
(Intercept) | -0.695 | 1.029 | -0.675 | 0.505 | |
gPO.eq.kg | 0.129 | 0.033 | 3.95 | 0.001 | *** |
Freshwater.L.kg | 0.004 | 0.001 | 2.544 | 0.017 | * |
kgCO.eq.1000kcal | 0.084 | 0.108 | 0.777 | 0.444 | |
m2.kilogram | 0.071 | 0.012 | 6.363 | 0.001 | *** |
scarce.H2O.L.kg | 0.001 | 0.001 | -2.043 | 0.051 | |
gPO.eq.kg:Freshwater.L.kg | 0.001 | 0.001 | -2.882 | 0.008 | ** |
Figure 2 shows the effect of Freshwater.L.kg on the relationship between gPO.eq.kg and total emissions. The lines with different colors represent the correlation between gPO.eq.kg and total emissions at different freshwater.L.kg. Four different values of Freshwater.L.kg are selected, and the slope of the colored line is greater when the value of Freshwater.
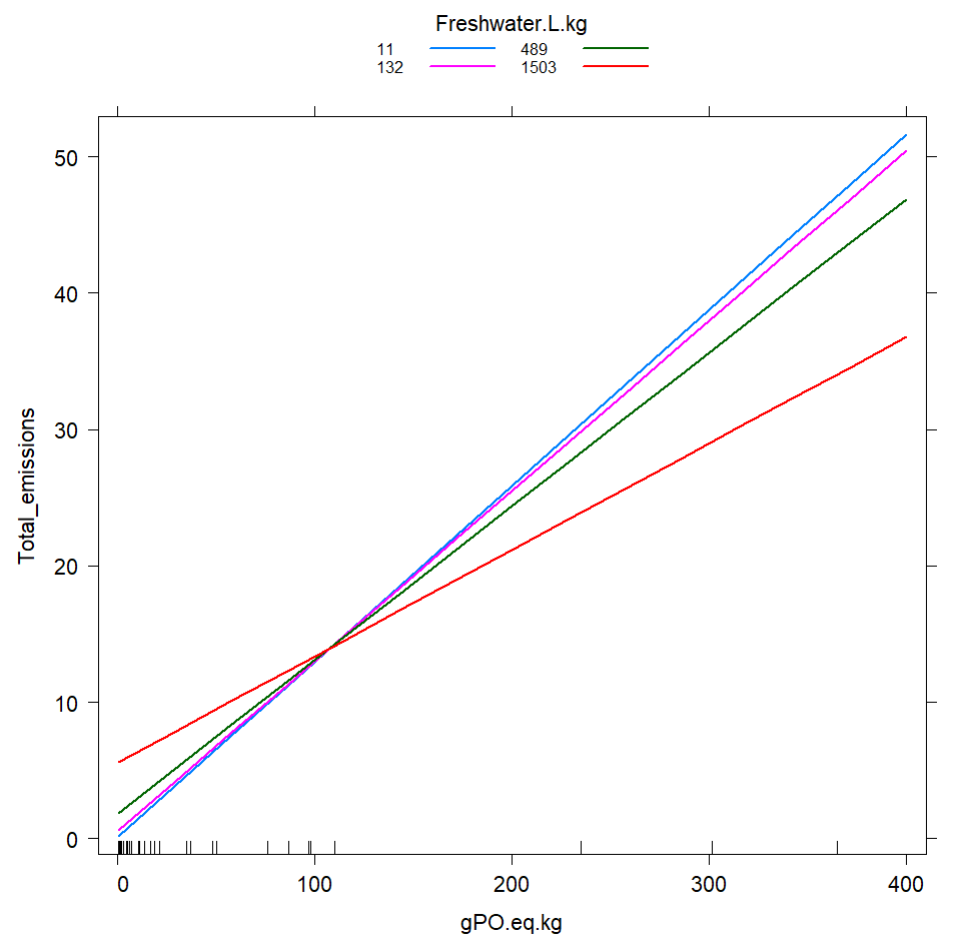
Figure 2. Effects plot of gPO.eq and freshwater.
3.4. Discussion
It is worth considering the environmental improvement of the food production process. Food production significantly impacts the environment, and choosing more environmentally friendly types of food for consumption and output can dramatically reduce environmental pollution.
This study analyzes different environmental pollution and different carbon emissions of different foods by statistical models. This study classifies foods into different categories, including plant-based foods, animal-based foods, and protein-based foods. According to the dataset, the study examines which foods, including plant- and animal-based food, negatively impacts the environment. This study uses a rating system to rate foods and determine which foods best preserve the environment. Moreover, by rating and categorizing together, the article can conclude which food categories are more environmentally polluting. The carbon footprint stage categories in the dataset include packing, retail, transport, processing, animal feed, land use change, and farming. The study also discusses which stages are more likely to contribute to greenhouse gas emissions. Finally, This study ranked the carbon footprints of plant foods, animal foods, and protein plants in the categories and discussed which stages of carbon emissions they each tend to contribute more.
Foods are classified into three main categories: plant-based, animal-based, and protein-based. The classification criteria for animal and plant-based proteins is mainly to observe whether the number of the animal-feed stage carbon footprint is 0. If the number is 0, the food is classified as plant-based. If otherwise classified as animal-based food, the food categories will be checked before using these categories for the study.
The study determines which food category, including animal-based and plant-based food, was more polluting by comparing the mean difference in total carbon emissions between animal-based and plant-based mean methods. According to the Table-1above, the mean of emissions for animal-based food was 16.39 (Kg CO2 - equivalents per kg product), while the mean of emissions for plant-based food was 2.82(Kg CO2 - equivalents per kg product). By comparing animal foods' mean emissions with plant foods' mean emissions, the study shows that animal foods have an overall 5.81 times higher CO2 emission capacity than plant foods. Also, the median carbon emissions of animal food are about five times higher than plant foods. Again this gives the initial guess that animal food is more polluting. Animal-based food has a greater capacity to emit more carbon per kg than plant-based food. (Table 1)
By comparing different values of Freshwater withdrawals per kilogram (liters per kilogram) in Fig. 2, whether the correlation between Eutrophying emissions per kilogram (gPO₄eq per kilogram ) and whether the correlation of total_emssion has an effect. This study concluded that for different values of Freshwater withdrawals per kilogram (liters per kilogram), the correlation between total emission and Eutrophying emissions per kilogram (gPO₄eq per kilogram) do differ in their correlation. Therefore, the study considers it easier to study the relationship between two factors and make conclusions than other confounding variables. (Figure 2)
3.5. Evaluation of foods
Tables 4-9 are for the food recommendations and ratings. According to the scoring method and classification in the method section, the food is divided into five different types and scored by six contamination objects. The food is divided into Perfect, Recommended, Normal, and Not Recommended recommendation criteria. The brackets after the food name represent the score received.
Table 4. Index points for each food product.
gPO.eq | Freshwater | CO2 | Land use | Scarce Water | Total | |
Oatmeal | 3 | 3 | 2 | 3 | 3 | 14 |
Rice | 4 | 5 | 3 | 3 | 4 | 19 |
Potatoes | 1 | 1 | 2 | 1 | 1 | 6 |
Cassava | 1 | 1 | 3 | 2 | 1 | 8 |
Cane Sugar | 3 | 3 | 2 | 2 | 3 | 13 |
Beet Sugar | 2 | 2 | 1 | 2 | 2 | 9 |
... | ... | ... | ... | ... | ... | ... |
Table 5. Recommended categories of carbohydrates food.
Carbohydrates | |||
5-10 Perfect | Potatoes(6) | Cassaval(8) | Beet Sugar(9) |
10-15 Recommended | Cane Sugar(6) | Oatmeal(14) | |
15-20 Normal | Rice(19) | ||
21+ Not Recommended |
Table 6. Recommended Categories of Protein Food.
Protein | ||||||
5-10 Perfect | ||||||
10-15 Recommended | ||||||
15-20 Normal | Milk(16) | Eggs(17) | Poultry Meat(19) | |||
21+ Not Recommended | Pig Meat(21) | Fish(farmed)(22) | Beef Herd(23) | Lamb & Mutton(24) | Cheese(24) | Beef(Beef Herd)(25) |
Table 7. Recommended categories of fruits and vegetable food.
Fruits & Veggies | |||||
5-10 Perfect | Onions & Leeks(7) | Root Vegetables(7) | Citrus Fruit(8) | Bananas(9) | Apples(9) |
10-15 Recommended | Brassicas(11) | Tomatoes(12) | Peas(13) | Berries & Grapes(13) | Other Pulses(15) |
15-20 Normal | Groundnuts(17) | Nuts(18) | |||
21+ Not Recommended |
Table 8. Recommended categories of oil and fat food.
Oil & Fat | ||
5-10 Perfect | Palm Oil(9) | |
10-15 Recommended | Rapeseed Oil(12) | |
15-20 Normal | Sunflower Oil(17) | Olive Oil(21) |
21+ Not Recommended |
Table 9. Recommended Categories of Drinks and Snacks Food.
Drinks & Snacks | ||
5-10 Perfect | ||
10-15 Recommended | ||
15-20 Normal | Coffee(17) | Dark Chocolate(20) |
21+ Not Recommended |
4. Conclusion
Finally, the study categorized foods by screening contaminated objects and then divided the total number of contaminated items into five intervals to make a rating of how environmentally friendly the food was and how much it was recommended. Each food item was divided into five levels of contamination, corresponding to a score of one to five, and then the different contamination scores were summed to obtain the score of the food. The final score also corresponds to the five recommendation ranges. The study divided the food into several categories for people to reference. Animal-based food is considered more contaminated; according to the study's rating, animal-based food is more in the ranks of the not recommended. According to the obtained correlation and the overall carbon emission of animal-based food is much larger than that of plant-based food, the values of various pollution objects of animal-based food are higher than that of plant-based food. The study believes these food recommendations can encourage people to choose more environmentally friendly food. The study also considers that these references will allow researchers to distinguish those foods that should be optimized for technology in production activities to achieve fewer carbon emissions and pollution.
References
[1]. Gaoming Jiang. Do you know how to produce the food you eat? China Academy of Sciences, 2021.
[2]. Xuxia Wang, Hongmei Shang. Pollution problems and preventive measures in apple production. Agricultural Planting Network, 2021.
[3]. Sandra Quijas, Patricia Balvanera. Biodiversity and ecosystem services. Science Direct, 2013.
[4]. Puja Mondal. Types of Environmental Impacts: Direct, Indirect, Cumulative, Induced Impact. Moi University, 2012.
[5]. Christina Hartmann, GiannA Lazzarini, Angela Funk, Michael Siegrist. Measuring consumers’ knowledge of the environmental impact of foods. 2021.
[6]. Palaniappa Krishnan. Environmental Impact of Food Production and Consumption. Bioresources Engineering Department, University of Delaware, 2018.
[7]. Hannah Ritchie, Max Roser. Environmental impact of food production. Oxford Martin School, University of Oxford, 2022.
[8]. Jiawen Dan. Scientific and technologies progress is an important means to solve ecological and environmental problems. Hunan Polytechnic of Environment and Biology, 2019.
[9]. Wanming Hu. Research on environmental pollution control technology in food production. Food Safety Guide, 2020.
[10]. UN News. Food systems account for over one-third of global greenhouse has emissions. United Nations, 2021.
Cite this article
Jiang,Y.;Tian,Y.;Yu,Y. (2023). Research on the types of environmental-friendly vegetables. Theoretical and Natural Science,6,484-491.
Data availability
The datasets used and/or analyzed during the current study will be available from the authors upon reasonable request.
Disclaimer/Publisher's Note
The statements, opinions and data contained in all publications are solely those of the individual author(s) and contributor(s) and not of EWA Publishing and/or the editor(s). EWA Publishing and/or the editor(s) disclaim responsibility for any injury to people or property resulting from any ideas, methods, instructions or products referred to in the content.
About volume
Volume title: Proceedings of the International Conference on Modern Medicine and Global Health (ICMMGH 2023)
© 2024 by the author(s). Licensee EWA Publishing, Oxford, UK. This article is an open access article distributed under the terms and
conditions of the Creative Commons Attribution (CC BY) license. Authors who
publish this series agree to the following terms:
1. Authors retain copyright and grant the series right of first publication with the work simultaneously licensed under a Creative Commons
Attribution License that allows others to share the work with an acknowledgment of the work's authorship and initial publication in this
series.
2. Authors are able to enter into separate, additional contractual arrangements for the non-exclusive distribution of the series's published
version of the work (e.g., post it to an institutional repository or publish it in a book), with an acknowledgment of its initial
publication in this series.
3. Authors are permitted and encouraged to post their work online (e.g., in institutional repositories or on their website) prior to and
during the submission process, as it can lead to productive exchanges, as well as earlier and greater citation of published work (See
Open access policy for details).
References
[1]. Gaoming Jiang. Do you know how to produce the food you eat? China Academy of Sciences, 2021.
[2]. Xuxia Wang, Hongmei Shang. Pollution problems and preventive measures in apple production. Agricultural Planting Network, 2021.
[3]. Sandra Quijas, Patricia Balvanera. Biodiversity and ecosystem services. Science Direct, 2013.
[4]. Puja Mondal. Types of Environmental Impacts: Direct, Indirect, Cumulative, Induced Impact. Moi University, 2012.
[5]. Christina Hartmann, GiannA Lazzarini, Angela Funk, Michael Siegrist. Measuring consumers’ knowledge of the environmental impact of foods. 2021.
[6]. Palaniappa Krishnan. Environmental Impact of Food Production and Consumption. Bioresources Engineering Department, University of Delaware, 2018.
[7]. Hannah Ritchie, Max Roser. Environmental impact of food production. Oxford Martin School, University of Oxford, 2022.
[8]. Jiawen Dan. Scientific and technologies progress is an important means to solve ecological and environmental problems. Hunan Polytechnic of Environment and Biology, 2019.
[9]. Wanming Hu. Research on environmental pollution control technology in food production. Food Safety Guide, 2020.
[10]. UN News. Food systems account for over one-third of global greenhouse has emissions. United Nations, 2021.