


1. Introduction
Since it first appeared in late 2019, the COVID-19 outbreak, which is brought on by the brand-new coronavirus SARS-COV-2, has posed a serious threat to global health. Epidemic models are essential for understanding the dynamics of infectious diseases and developing successful disease control and prevention techniques. The SIR model (Susceptible-Infectious-Recovered model), one of the many modelling techniques, has become a useful tool for examining the patterns of transmission of infectious disorders like COVID-19 [1]. This project investigates the SIR model’s use in analyzing the COVID-19 outbreak and discuss its benefits, drawbacks, and potential policy ramifications.
The SIR model divides the population into three compartments: suspectable individuals (S), infectious individuals (I), and recovered or removed persons (R). People, according to the hypothesis, switch between these compartments as the disease's dynamics alter [2]. The model is governed by a set of various equations that demonstrate the rate of change of each compartment over time.
The SIR model provides a simple yet efficient framework for studying infectious diseases [3]. It offers a framework for analyzing disease transmission patterns, establishing crucial epidemiological characteristics, and evaluating treatment efficacy by measuring interactions between susceptible, infected, and recovered individuals. Understanding these dynamics is very essential for making appropriate decisions about public health policy, resource allocation, and outbreak management techniques [4].
A variety of parameters are included in the SIR model to depict the aspects of the disease and population being examined. The basic reproductive number ( \( {R_{0}} \) ) represents the average number of secondary infections caused by a single sick individual in a completely susceptible group [5]. It provides useful information on the possibility of disease transmission. The length of infectiousness, the rate of transmission, and the rate of recovery are the other factors that influence the behavior of SIR model. Moreover, the SIR model has been widely used to understand the transmission dynamics of COVID-19. Fitting the model to actual data allows researchers to estimate critical parameters such as \( {R_{0}} \) , which assists in evaluating the virus's transmissibility [6]. Also, the SIR model allows for the analysis of a variety of events, such as the consequences of various intervention strategies, vaccination campaigns, and changes in population behavior [7]. It offers a valuable framework for forecasting the disease's future course and evaluating the effectiveness of management initiatives.
Although the SIR model provides useful information, it is critical to understand its limitations. Firstly, the model is based on a well-mixed population, which cannot fully capture the complicated patterns of actual interactions [8]. Secondly, it excludes geographical variances, demographic variability, and the influence of other factors such as age, comorbidities, and socioeconomic situations. Furthermore, the SIR model assumes homogeneous mixing and a constant transmission rate, which are not applicable to COVID-19 [9]. Despite these flaws, the SIR model is a good place to start when trying to figure out how illnesses emerge.
Significant policy implications result from learnings from using the SIR model on COVID-19. The model can help decision-makers assess the potential effects of various public health measures and direct the contribution of funding for screening, contact tracing, healthcare facilities, and vaccination programs [10]. The model can help with capacity planning by giving predictions of the epidemic peak, ensuring that healthcare systems can effectively handle the inflow of cases.
In general, the SIR model has shown to be an effective resource for comprehending the dynamics of infectious disease transmission, especially COVID-19. It enables the study of various situations, the estimate of crucial variables, and the forecasting of illness trajectories. Although the model has several drawbacks, its clarity and ease of use make it a good place to start when developing public health policies and treatments. The use of the SIR model and other sophisticated modelling techniques can help us better understand the illness and lessen its effects on public health as the COVID-19 pandemic continues to develop in some areas around the world.
2. Methods
The collection of relevant data is the initial stage in applying the SIR model to COVID-19. Researchers gathered epidemiological information on COVID-19 cases from dependable sources, including public databases, international organizations, national or regional health departments, and the World Health Organization. The information includes the number of confirmed cases, recoveries, and deaths in addition to any additional pertinent elements like population size or demographic data.
2.1. Assumptions
After collecting the data, researchers start to define the initial conditions of the three compartments based on the information on hand. In the case of COVID-19, the suspectable compartments (S) represents the population that has not yet infected by the disease, the infectious compartment (I) represents those who are infected at the moment, and the recovered compartment (R) represents those who have either recovered from the infection and build up an immunity to it or have been eliminated from the suspectable pool for other reasons, such as death.
The next step is to make several assumptions in order to simplify the analysis and facilitate mathematical modelling. These assumptions including:
2.1.1. Closed population. During the research period, there is no migration, birth, or death. This assumption makes it possible to analyze disease transmission within a fixed population more easily. For example, if there is an island with 100 people, no one leaves and no one new arrives, and there are no birth or deaths, then the population remains closed and fixed at 100 individuals. This simple example illustrates the concept of a closed population.
2.1.2. Homogeneous mixing and Constant parameters. People interact with one other in a uniform way within the population, which means that everyone has an equal probability of doing so. The assumption of homogeneous mixing simplifies calculations and provides a basic understanding of disease spread. Even though this assumption seems to be unrealistic, it still offers a helpful place to start when analyzing the dynamics of disease transmission.
The variables affecting disease transmission and recovery stay the same throughout the epidemic. These characteristics can, however, be changed to take into account modifications brought on by therapies or advances.
2.2. Equations
A set of ordinary differential equations (ODEs) explain the rate of change of each compartment over time in the SIR model. The following are the equations:
2.2.1. Rate of change of suspectable individuals. Denote the following:
\( \frac{dS}{dt}=-βSI\ \ \ (1) \)
where β denotes the transmission rate, S denotes the proportion of suspectable individuals, this paper denotes the proportion of infectious individuals. The term βSI represents the rate at which suspectable individuals become infected. It is obvious that the equation above represents the decrease in the number of suspectable individuals over time.
2.2.2. Rate of change of infectious individuals. Denote the following:
\( \frac{dI}{dt}=βSI-γI\ \ \ (2) \)
where \( γ \) denotes the recovery rate or the reciprocal of the average infectious period. The first term, \( βSI \) , denotes the rate at which suspectable individuals become infected, while the second term, \( γI \) , denotes the rate at which infectious individuals recover or are removed from the population. The equation above shows the change in the number of infectious individuals over time.
2.2.3. Rate of change of recovered individuals. Denote the following:
\( \frac{dR}{dt}=γI\ \ \ (3) \)
The term \( γI \) represents the rate at which infectious individuals recover and move into the recovered compartment.
These equations reflect the population’s interaction between suspectable, infectious, and recovered individuals. Researchers may model the transmission of COVID-19 and examine the influence of different factors and interventions on the epidemic curve by solving these equations numerically.
It is worth noting that the SIR model may be expanded to include other compartments, such as exposed (E) and hospitalized (H) individuals, in order to capture various elements of disease dynamics. Moreover, variants of the basic SIR model, such as the SEIR and SIRD model, account for varying phases of possibility of death.
Researchers can estimate factors such as the basic reproductive number (R_0) and evaluate the effectiveness of treatments such as social distancing measures, immunizations, or testing procedures by using the SIR model and associated equations to COVID-19 data. This allows for a better knowledge of the spread of COVID-19 and aids in the development of public health interventions and strategies.
3. Results and discussion
The SIR model simulations successfully predict the COVID-19 disease trajectories. As shown in figure 1 below:
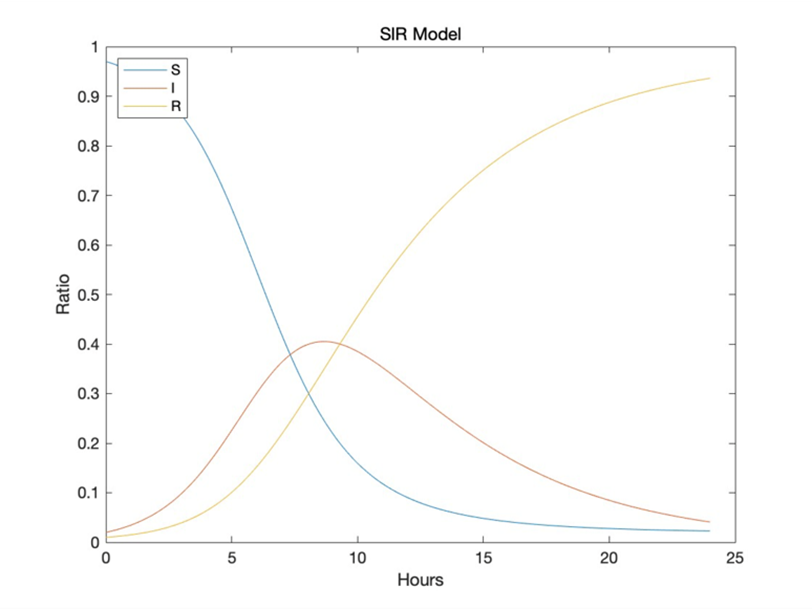
Figure 1. Ratio of SIR model with respect to time.
The model depicts the first exponential development phase of infectious, followed by a peak and a subsequent fall as suspectable individuals become infected and then recover. Moreover, the suspectable individuals decrease over time while the recovered individuals increase over the certain period.
The simulations closely mirror the reported epidemic curves, showing that the model accurately reflects the disease’s basic characteristics. Researchers’ ran simulations to see how actions might affect the spread of COVID-19. The data collected show that applying interventions such as social distancing measures, widespread testing, contact tracing, and vaccination campaigns can significantly limit viral transmission. The model demonstrates that these treatments result in a flattened epidemic curve, lowering the peak number of infections and preventing healthcare systems from overburdened. The model also emphasizes the importance of vaccinations, it shows that vaccinations minimize the number of vulnerable persons in the community, which limits viral transmission. According to SIR model projections, increased vaccination coverage reduces the frequency of disease and severe cases, reducing the pressure on healthcare systems.
Also, incubation of COVID-19 plays a significant role in the SIR model because it influences the timing and dynamics of disease transmission. The incubation period is the time between when a person becomes infected and when they begin to develop symptoms or become contagious. In the SIR model, this means that during the incubation period, individuals who have been infected but are not yet infectious are still categorized as suspectable. Figure 2 below shows the normal SIR model of COVID-19 without considering the factor of incubation in a population sample of 10000.
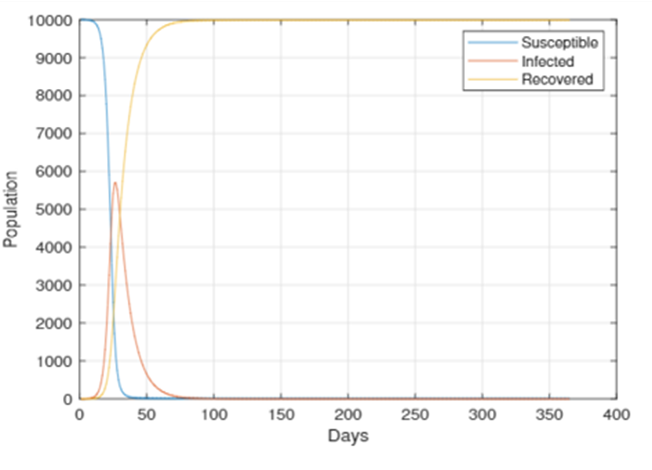
Figure 2. SIR simulation without considering incubation.
This paper compares this graph with the graph of SIR simulation considering the factor of incubation under the same conditions, which will be shown in figure 3 below.
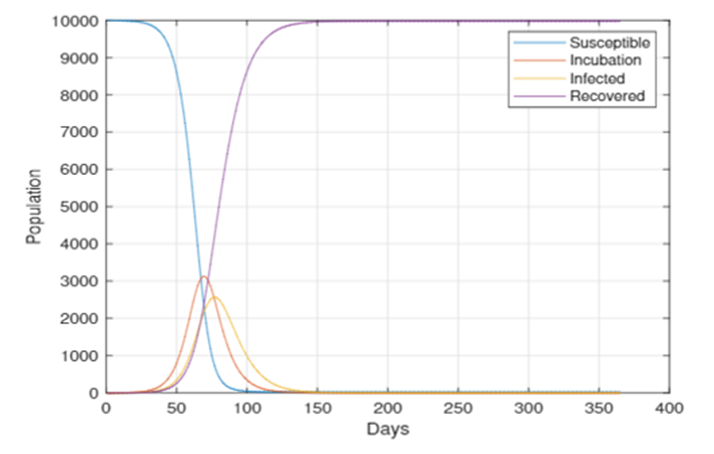
Figure 3. SIR simulation considering incubation.
By comparing Figure 2 and Figure 3, clearly there is a delay in the upward slope of the infectious in the graph. The reason is the time delay in the transition from the suspectable compartment to the infectious compartment. Also, the existence of an incubation period slows the rate at which new infectious emerge. When compared to Figure 3, this results in a slower growth in the number of infected people overtime. As a result, the epidemic curve appears flatter and longer in the SIR model graph. Moreover, the time required for the epidemic curve to reach its peak and fall is longer than in the absence of an incubation period, since people stay in the suspectable compartment during the incubation period, the number of suspectable people declines more slowly. Due to the help of control techniques like self-isolation and quarantine performed during incubation phase, infectious curve has a slower climb and a lower peak.
To validate the findings, researchers compare them to research that employed the SIR model on COVID-19 or other modelling methodologies. Across several trials, the comparison indicates consistent trends in disease trajectories and the impact of therapies. These findings verify the validity and dependability of the simulations and give strong evidence of effectiveness of treatments in preventing the spread of COVID-19.
While the SIR model gives useful insights, it also has its own limitations. For instance, the model is based on a closed population with homogeneous mixing, which may not precisely replicate real-world settings. The virus’s real spread can be impacted by a variety of factors, such as regional heterogeneity, age-specific interactions, and individual behavior. Furthermore, the model is predicated on constant parameters, which may not be the case during the COVID-19 epidemic. These constraints should be considered when interpreting the results and making practical decisions based on the model's predictions.
The findings have important implications for public health programs and policy. The simulations illustrate the efficacy of therapies in reducing the spread of COVID-19. Stay-at-home orders and gathering restrictions, for example, can significantly reduce the occurrence of infections and relieve burden on healthcare services. Testing and contact tracing techniques are crucial for identifying and isolating infected persons and thereby stopping transmission cycles. Vaccination campaigns are critical in reducing susceptibility and averting serious incidents. They underline the need of applying therapies early and regularly in order to properly regulate the development of COVID-19. These findings might be utilized by governments and health authorities to influence decision-making and develop evidence-based pandemic management plans. The simulations stress the importance of a comprehensive and integrated approach that mixes therapies in order to get the greatest results.
Moreover, the analysis stresses the need of timely and sustained intervention implementation. The simulations show that delaying the deployment of treatments or prematurely relaxing them might result in case resurgences. Continuous epidemiological monitoring and intervention adaption based on emerging data are critical for effective COVID-19 management.
When evaluating the data, it is also vital to keep the context and constraints of the SIR model in mind. While the model offers useful insights, it oversimplifies the complicated reality of disease transmission. When making practical judgments based on the model’s projections, consider factors such as developing variations, changing population habits, and the influence of non-pharmaceutical treatments. Future research can focus on incorporating more complex factors into the model, and behavior changes. Additionally, continuing data collection and integration with real-world data can increase the model’s accuracy and applicability.
Finally, the SIR model simulations give valuable insights on COVID-19 transmission patterns and the impact of treatments. The models properly anticipate disease trajectories and show the usefulness of treatments in limiting viral propagation, The ramifications of these findings for public health treatments and policy are significant. However, it is essential to understand the SIR model’s limitations as well as the dynamic character of the pandemic. Continued research, data collecting, and intervention adaption are vital for effectively controlling and reducing the COVID-19 pandemic.
4. Conclusion
In summary, the project used the SIR model on COVID-19 data and conclude several noteworthy discoveries. The SIR model predicted disease trajectories effectively, including the early exponential increase, peak, the subsequent drop of infections. The simulations indicate that measures such as social distancing, testing and contact tracing had a substantial influence on COVID-19 as well. By comparing the graphs of SIR models between the normal one and the one considering incubation period, the project illustrate the important influence of incubation period, which also emphasize the significance of self-isolation and quarantine. Also, addressing the limitations of the SIR model, such as its assumptions of a closed population and homogeneous mixing, would also be valuable. Further research should aim to develop more sophisticated models, incorporating real-world conditions and exploring the impact of emerging factors to further enhance our understanding and response to the ongoing pandemic.
References
[1]. Charles R T, Henrique L and Diodo F 2020 SARS-COV-2: SIR Model Limitations and Predictive Constraints. SYMMETRY.
[2]. Lawson A B and Kim J 2022 Bayesian Space-time SIR Modeling of COVID-19 in Two US States During the 2020-2021 Pandemic. MED. EPIDEMIOLOGY.
[3]. Martin N, Benard D M and Babu L 2020 Modelling of COVID-19 (Coronavirus) in Kenya Using SIR Model. MATHEMATICS TIRE.
[4]. Ranjan R 2020 Estimating The Final Epidemic Size For COVID-19 Outbreak Using Improved Epidemiological Models. MED.EPIDEMIOLOGY.
[5]. Dmitry A et al, 2020 Prediction of The COVID-19 Spread in Russia Based on SIR and SEIR Models of Epidemics. IFAC-PAPERSONLINE.
[6]. Qin Y, Wu B B and Yang W H 2021 Modeling and Analysis of Environment-aware COVID-19 Transmission. APPLICATION RESEARCH OF COMPUTERS.
[7]. Pedro F 2021 Epidemiology SIR with Regression, Arima, and Prophet in Forecasting COVID-19. ENGINEERING PROCEEDINGS.
[8]. Different Communities. CHAOS, SOLITONS, AND FRACTALS.
[9]. Lgor N 2021 Visible and Real Sizes of New COVID-19 Pandemic Waves in Ukraine. CHAOS, SOLITONS, AND FRACTALS.
[10]. Liu M, Raphael T and Yao S 2020 Forecasting The Spread Of COVID-19 Under Different Reopening strategies. SCIENTIFIC REPOETS.
Cite this article
Wu,J. (2023). The application of SIR model in COVID-19. Theoretical and Natural Science,9,38-44.
Data availability
The datasets used and/or analyzed during the current study will be available from the authors upon reasonable request.
Disclaimer/Publisher's Note
The statements, opinions and data contained in all publications are solely those of the individual author(s) and contributor(s) and not of EWA Publishing and/or the editor(s). EWA Publishing and/or the editor(s) disclaim responsibility for any injury to people or property resulting from any ideas, methods, instructions or products referred to in the content.
About volume
Volume title: Proceedings of the 3rd International Conference on Computing Innovation and Applied Physics
© 2024 by the author(s). Licensee EWA Publishing, Oxford, UK. This article is an open access article distributed under the terms and
conditions of the Creative Commons Attribution (CC BY) license. Authors who
publish this series agree to the following terms:
1. Authors retain copyright and grant the series right of first publication with the work simultaneously licensed under a Creative Commons
Attribution License that allows others to share the work with an acknowledgment of the work's authorship and initial publication in this
series.
2. Authors are able to enter into separate, additional contractual arrangements for the non-exclusive distribution of the series's published
version of the work (e.g., post it to an institutional repository or publish it in a book), with an acknowledgment of its initial
publication in this series.
3. Authors are permitted and encouraged to post their work online (e.g., in institutional repositories or on their website) prior to and
during the submission process, as it can lead to productive exchanges, as well as earlier and greater citation of published work (See
Open access policy for details).
References
[1]. Charles R T, Henrique L and Diodo F 2020 SARS-COV-2: SIR Model Limitations and Predictive Constraints. SYMMETRY.
[2]. Lawson A B and Kim J 2022 Bayesian Space-time SIR Modeling of COVID-19 in Two US States During the 2020-2021 Pandemic. MED. EPIDEMIOLOGY.
[3]. Martin N, Benard D M and Babu L 2020 Modelling of COVID-19 (Coronavirus) in Kenya Using SIR Model. MATHEMATICS TIRE.
[4]. Ranjan R 2020 Estimating The Final Epidemic Size For COVID-19 Outbreak Using Improved Epidemiological Models. MED.EPIDEMIOLOGY.
[5]. Dmitry A et al, 2020 Prediction of The COVID-19 Spread in Russia Based on SIR and SEIR Models of Epidemics. IFAC-PAPERSONLINE.
[6]. Qin Y, Wu B B and Yang W H 2021 Modeling and Analysis of Environment-aware COVID-19 Transmission. APPLICATION RESEARCH OF COMPUTERS.
[7]. Pedro F 2021 Epidemiology SIR with Regression, Arima, and Prophet in Forecasting COVID-19. ENGINEERING PROCEEDINGS.
[8]. Different Communities. CHAOS, SOLITONS, AND FRACTALS.
[9]. Lgor N 2021 Visible and Real Sizes of New COVID-19 Pandemic Waves in Ukraine. CHAOS, SOLITONS, AND FRACTALS.
[10]. Liu M, Raphael T and Yao S 2020 Forecasting The Spread Of COVID-19 Under Different Reopening strategies. SCIENTIFIC REPOETS.