


1. Introduction
Academic production is increasing at a rate that has never been seen before in the context of today's dynamic social and economic environment. As of 2022, Scopus had 84 million records, including open-access materials, conference papers, grant information, and patent links [1]. Researchers, especially those working across disciplines, need support in keeping up with the rapid pace of change in this environment [2].
The sheer volume and variety of scholarly work has made manual data collection and organization increasingly difficult. Scientists are aware of these challenges and have turned to computational tools for help. Eight systematic reviews were analyzed by Ross-White and Godfrey [3], yielding 17,378 abstracts. From these, 122 abstracts met the criteria for inclusion, yielding 142 publications. Similar methods were employed by Bannach-Brown et al., who, over the course of nine months, screened 33,184 data using two reviewers working in tandem [4]. Getting systematic reviews from another 10,000 publications would take 40 weeks, according to another study [5]. Given the time-consuming nature of the search process, any way to increase the speed at which relevant papers can be retrieved is much appreciated.
As a result, data analysis of licensed materials is now possible because to the growing trend of publishers providing full-text access to their content. This convenience has allowed for new ways to visualize bibliographic statistics through analysis of bibliographic elements such as publication year, item type, and title. Visualization methods like these let scholars see the big picture and comprehend how their citations go together. In addition, the credibility of a research work can be gauged in part by its citations. Therefore, beginning the search procedure with the bibliography rather than the title, abstract, or review can improve efficiency and provide more fruitful results.
Data visualizations are essential for providing quick insight into otherwise obscure information. Pie charts, scatter plots, and word clouds are all examples of descriptive visualization techniques that can be used to create visual representations of a paper's content that can help readers better understand the work. Researchers can save time on data analysis and interpretation by using visualizations to acquire quick understanding of key parts of the data [6]. In many scientific endeavours, graphs serve as the central focus. Creators of graphs demonstrate their expertise and convey their comprehension of data and findings, frequently drawing the attention of curious readers for the first time. The longer a viewer spends staring at a graph without understanding the data, the less likely they are to take anything away from the work [7].
Bibliographic trends in cited works shed light on the state of the art in several fields of study. Predictions of citation links between a query paper and prior works were proposed by Yu et al. using bibliographies [8]. Yu offers insights into the dynamics of knowledge diffusion and interconnections within the bibliographic network by taking into account a variety of parameters, including authors, topics, publication venues, and publication time .
In light of these factors, this study discusses the challenges that academics have in dealing with the ever-growing volume of published research. The intention is that this visual overview will help scholars better grasp the structure and quality of bibliographies and speed up the process of locating relevant publications. In an increasingly dynamic and interdisciplinary context, this paper takes an innovative strategy that begins the search process with the bibliography and use visualizations to deliver valuable insights and enhance the research process.
2. Introduction and significance of evidence synthesis
It is essential in fields like public health that choices and arguments be well informed, and this is where the evidence synthesis process comes in. The systematic review is a common approach to evidence synthesis because of the methodical search and screening procedures it employs to determine which papers should be included and which ones should be disregarded [9]. The evaluations usually provide context and commentary by referencing both included and excluded publications. The next phases, following the initial step of finding relevant research, are data extraction, bias evaluation, and quality assessment. Finally, meta-analysis is used to perform the evidence and quantitative synthesis.
When it comes to policy debates on public health, it is crucial to synthesize the available evidence. The purpose of this effort is to convert the bibliography into a data set for use in laboratory public health research [10]. For this, we will be using Python and other analysis tools. The project takes a Digital Object Identifier (DOI) as its starting point, and its first output is a bibliographic list with accompanying statistics, as well as the necessary code to repeat the procedure for any DOI. The initiative also aspires to map out a strategy for further study to increase both input and output capacities.
3. Methodology
The paper followed a methodical process throughout data collection, transformation, cleaning, and visualization from bibliographical sources. The method of operation is outlined here.
Gathering initial data is the first step. This research used a Digital Object Identifier (DOI) source to collect data and retrieve the bibliography, then manually extracted details such as publication year, item category, and author list from each reference.
In addition, data conversion. The rispy library was used to process RIS and BibTeX files into a comprehensible CSV for analysis. The data were converted into a structured, standardized format that could be further analyzed after the conversion procedure was complete.
Third, tidying up the data. The researchers in this study took great care to sanitize their data before using it. There are no more null or missing value (NA) entries in the database. This process ensured the completeness and accuracy of the dataset by removing any unnecessary or extraneous data. In addition, we compiled the names of every columns in the dataset and converted them to standard notations. The mapping procedure we used standardized the column names, making the data set more legible and consistent overall.
Fourth, displaying data visually. We performed analysis on the dataset using Seaborn and created several visual representations, including pie charts, scatter plots, and word clouds, to better understand its contents and draw conclusions. These representations gave us access to descriptive statistics and opened the door to discovering hidden patterns and associations in the data. In order to fully comprehend the nature of the collection, we created visual representations of publication dates, item kinds, and authorship lists.
4. Results and analysis
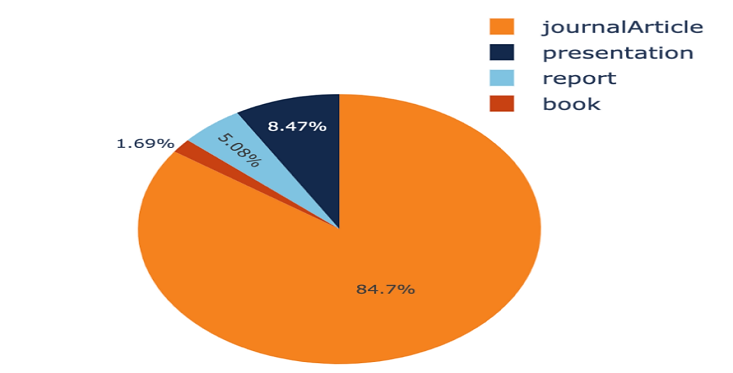
Figure1. The visualization of the publication types (original).
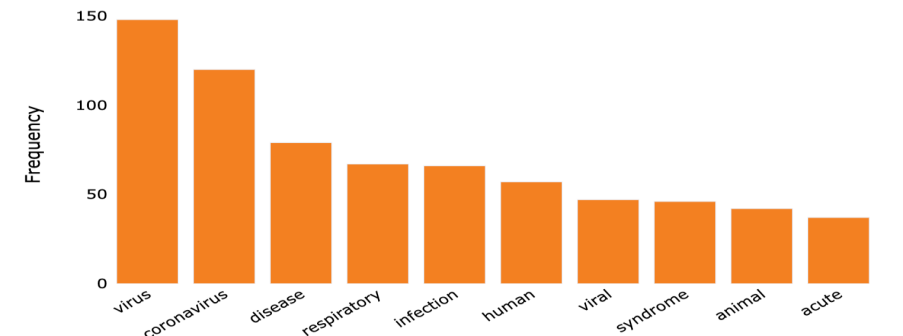
Figure 2. The most common words in the tags of the references (original).
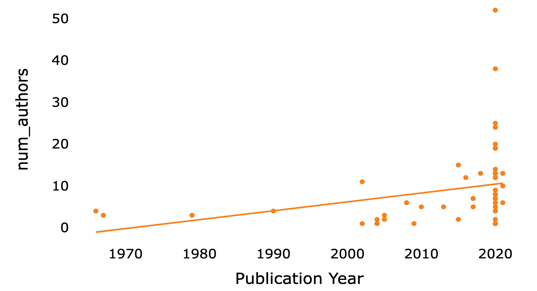
Figure 3. The scatter plot of number of authors vs publication year (original).
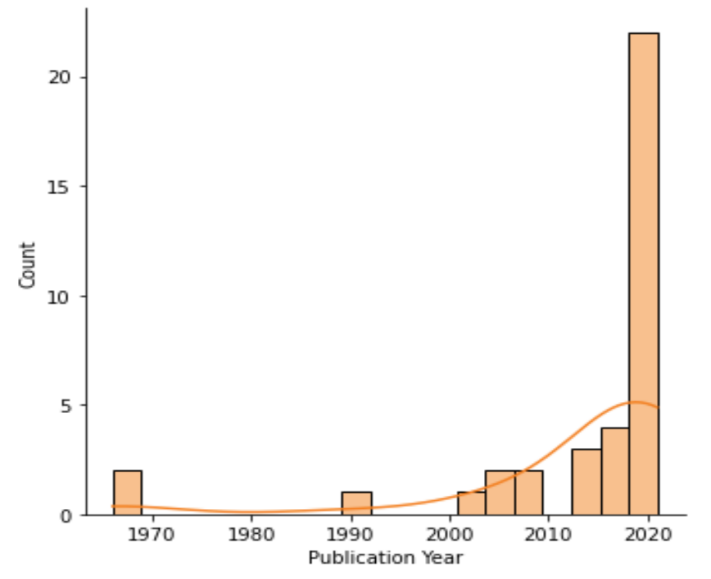
Figure 4. Statistics of the different publication years (original).
Table 1. Statistics of the different item types (original).
Key | Publication year | Author | Title | URL | |
Book | 1 | 1 | 1 | 0 | 1 |
Journal Article | 50 | 50 | 50 | 50 | 48 |
Presentation | 5 | 5 | 5 | 0 | 5 |
Report | 3 | 3 | 3 | 0 | 3 |
The purpose of the experiment was to compare our implementation to standard search strategies in systematic reviews. In light of this, we tried to provide descriptive statistics on a selection of papers for a given systematic review.
To prove the efficacy of our method, we used the Airborne Transmission of SARS-CoV-2 report from the National Academy of Sciences [11]. We used the Crossref API to look up an Electronic Identifier (EID) by title in order to compile this information. The EIDs were parsed from the JSON response that was generated by this API. We used these EIDs to query Elsevier's Abstract Retrieval API for bibliographical details, including Publication year, Author, Title, and URL.
We used Zotero, a free and open-source citation management, to import 59 publications from published reviews for our data collection. In Table 1, the various product categories are laid out clearly. To further aid in the clear display of this data, we've incorporated a pie chart (Figure 1).
In order to check out the papers' abstracts, titles, and keywords. To create a list of distinct keywords, we compared and merged word origins using a language model. The terms "virus" and "coronavirus" emerged as the most common topics discussed in the cited studies (figure 2). The varied and complicated research on text mining for lowering effort in systematic reviews makes it difficult to draw solid conclusions regarding the most successful strategy [12].
This scatterplot (figure 3) and a histogram mode with a KDE curve (figure 4) show the distribution of years. In order to visualize associations between data, such as the connection between publication year and other factors, the scatterplot is a useful visualization tool. It allows us to look for trends and correlations in the data. Most of the citations centered on 2020, highlighting the paper's timeliness and significance. Providing raw data versus inferential statistical models is important because they convey different meanings and interpretations [13].
In addition to the aforementioned data, we also tracked how many authors were included in each reference so that we could examine authorship patterns. To aid in locating writers who had several publications within the dataset, we also estimated the total number of times their names appeared in the gathered references. We also determined the ratio of single-authored works to those that involved many authors working together. This analysis sheds light on the extent to which the papers were written jointly.
5. Discussion
Compared to the previous study, the research question has made progress in the following areas.
5.1. Improvements in data collection methods
In order to enhance our data collection methods, we employed a diverse range of APIs from the Elsevier Developer Portal, including the Scopus API, Affiliation Search API, Author Search API, Scopus Abstract Retrieval API, Scopus Abstract Citations Count API, Affiliation Retrieval API, and Author Retrieval API. As a result of this combination, we were able to collect data from a wider variety of sources than ever before.
Furthermore, we also built a pipeline to retrieve XML-formatted full-text content from the Crossref text and data mining API as part of this project. The main goal of this pipeline was to develop a reusable infrastructure for collecting and analyzing full-text information from academic journals. We set out to evaluate the strengths and weaknesses of APIs and NLP libraries by documenting and testing them extensively.
5.2. In-depth data analysis
Prioritizing the collection of crucial information, such as the literature category and publication year, was a top priority throughout the data analysis process. We then looked to fill in the gaps by collecting data such the document's title, ISBN, ISSN, DOI, and URL (albeit not all documents had these fields filled in). We found instances of duplicating data from several APIs, however the details varied. To fix this problem, we used other APIs, especially the abstract retrieval site, to get back any lost information.
This paper cleaned up the data by gleaning keywords from abstracts using the Rapid Automatic Keyword Extraction (RAKE) technique. Extraction of keywords from abstracts is widespread practice in information retrieval systems because of the ease with which they may be defined, revised, memorized, and shared. RAKE's graph-based technique has been carefully tested on scientific abstracts. The RAKE technique presented in this chapter is an unsupervised, domain-agnostic, and language-agnostic method for extracting keywords from individual documents.
6. Conclusion
This study introduces a coding structure that makes computable bibliographies easier to search for and analyze. Our code retrieves relevant documents from the bibliography and generates visualizations that provide a comprehensive overview and understanding of bibliographic data, including publication year, item type, and title. We also analyzed data showing the distribution of single-author versus co-authored works, as well as the frequency with which certain writers were cited.
The experiment validated the efficiency of our implementation compared to the standard search strategies employed in systematic reviews. Scatter plots, histograms, and pie charts, all of which we used, proved to be helpful visualizations that cut down on the time spent analyzing and understanding the data.
The overarching goal of this study was to develop a new strategy for accessing relevant publications and to help researchers better comprehend bibliographies through the use of visualizations.
The project has progressed to the point where multiple scripts were written to use the API for getting references from Scopus, although at the moment, Zotero is still being used. This is due to the fact that importing each bibliography into Zotero manually takes time and work but results in a more thorough collection of data.
In the future, we plan to reach out to more people who are interested in collecting visualization information and concentrate on integrating data gathering and data visualization for the project.
Acknowledgement
I want to express my gratitude to Professor Jodi for her guidance in providing the initial study direction and weekly instructions. I am also grateful to Yuanxi Fu for her valuable thoughts and to the Information Quality Lab for their feedback on my research process and poster. JS & YF are supported by NSF 2046454.
References
[1]. Bannach-Brown, A. et al. 2018. “The Use of Text-Mining and Machine Learning Algorithms in Systematic Reviews: Reducing Workload in Preclinical Biomedical Sciences and Reducing Human Screening Error.” : 255760. https://www.biorxiv.org/content/10.1101/255760v1 (June 20, 2023).
[2]. Börner, Katy, Andreas Bueckle, and Michael Ginda. 2019. “Data Visualization Literacy: Definitions, Conceptual Frameworks, Exercises, and Assessments.” Proceedings of the National Academy of Sciences 116(6): 1857–64.
[3]. “Graphical Abstracts | Proceedings of the 33rd Annual International Conference on the Design of Communication.” https://dl.acm.org/doi/10.1145/2775441.2775465 (June 20, 2023).
[4]. Hsiao, Tzu-Kun, Yuanxi Fu, and Jodi Schneider. 2020. “Visualizing Evidence-Based Disagreement over Time: The Landscape of a Public Health Controversy 2002–2014.” Proceedings of the Association for Information Science and Technology 57(1): e315.
[5]. “Is There an Optimum Number Needed to Retrieve to Justify Inclusion of a Database in a Systematic Review Search? - Ross‐White - 2017 - Health Information & Libraries Journal - Wiley Online Library.” https://onlinelibrary-wiley-com.proxy2.library.illinois.edu/doi/full/10. 1111/hir.12185 (June 20, 2023).
[6]. Lehane, Elaine et al. 2019. “Evidence-Based Practice Education for Healthcare Professions: An Expert View.” BMJ Evidence-Based Medicine 24(3): 103–8.
[7]. Midway, Stephen R. 2020. “Principles of Effective Data Visualization.” Patterns 1(9): 100141.
[8]. O’Mara-Eves, Alison et al. 2015. “Using Text Mining for Study Identification in Systematic Reviews: A Systematic Review of Current Approaches.” Systematic Reviews 4(1): 5.
[9]. Prather, Kimberly A. et al. 2020. “Airborne Transmission of SARS-CoV-2.” Science 370(6514): 303–4.
[10]. “Scopus | The Largest Database of Peer-Reviewed Literature | Elsevier.” https://www.elsevier. com/en-gb/solutions/scopus (June 20, 2023).
[11]. Siddaway, Andy P., Alex M. Wood, and Larry V. Hedges. 2019. “How to Do a Systematic Review: A Best Practice Guide for Conducting and Reporting Narrative Reviews, Meta-Analyses, and Meta-Syntheses.” Annual Review of Psychology 70: 747–70.
[12]. Trinquart, Ludovic, David Merritt Johns, and Sandro Galea. 2016. “Why Do We Think We Know What We Know? A Metaknowledge Analysis of the Salt Controversy.” International Journal of Epidemiology 45(1): 251–60.
[13]. Yu, Xiao, Quanquan Gu, Mianwei Zhou, and Jiawei Han. 2012. “Citation Prediction in Heterogeneous Bibliographic Networks.” In Proceedings of the 2012 SIAM International Conference on Data Mining (SDM), Proceedings, Society for Industrial and Applied Mathematics, 1119–30. https://epubs.siam.org/doi/abs/10.1137/1.9781611972825.96 (June 20, 2023).
Cite this article
Ye,Z. (2023). Computable bibliography: Using data analysis and data visualization to characterize a bibliography. Theoretical and Natural Science,12,55-60.
Data availability
The datasets used and/or analyzed during the current study will be available from the authors upon reasonable request.
Disclaimer/Publisher's Note
The statements, opinions and data contained in all publications are solely those of the individual author(s) and contributor(s) and not of EWA Publishing and/or the editor(s). EWA Publishing and/or the editor(s) disclaim responsibility for any injury to people or property resulting from any ideas, methods, instructions or products referred to in the content.
About volume
Volume title: Proceedings of the 2023 International Conference on Mathematical Physics and Computational Simulation
© 2024 by the author(s). Licensee EWA Publishing, Oxford, UK. This article is an open access article distributed under the terms and
conditions of the Creative Commons Attribution (CC BY) license. Authors who
publish this series agree to the following terms:
1. Authors retain copyright and grant the series right of first publication with the work simultaneously licensed under a Creative Commons
Attribution License that allows others to share the work with an acknowledgment of the work's authorship and initial publication in this
series.
2. Authors are able to enter into separate, additional contractual arrangements for the non-exclusive distribution of the series's published
version of the work (e.g., post it to an institutional repository or publish it in a book), with an acknowledgment of its initial
publication in this series.
3. Authors are permitted and encouraged to post their work online (e.g., in institutional repositories or on their website) prior to and
during the submission process, as it can lead to productive exchanges, as well as earlier and greater citation of published work (See
Open access policy for details).
References
[1]. Bannach-Brown, A. et al. 2018. “The Use of Text-Mining and Machine Learning Algorithms in Systematic Reviews: Reducing Workload in Preclinical Biomedical Sciences and Reducing Human Screening Error.” : 255760. https://www.biorxiv.org/content/10.1101/255760v1 (June 20, 2023).
[2]. Börner, Katy, Andreas Bueckle, and Michael Ginda. 2019. “Data Visualization Literacy: Definitions, Conceptual Frameworks, Exercises, and Assessments.” Proceedings of the National Academy of Sciences 116(6): 1857–64.
[3]. “Graphical Abstracts | Proceedings of the 33rd Annual International Conference on the Design of Communication.” https://dl.acm.org/doi/10.1145/2775441.2775465 (June 20, 2023).
[4]. Hsiao, Tzu-Kun, Yuanxi Fu, and Jodi Schneider. 2020. “Visualizing Evidence-Based Disagreement over Time: The Landscape of a Public Health Controversy 2002–2014.” Proceedings of the Association for Information Science and Technology 57(1): e315.
[5]. “Is There an Optimum Number Needed to Retrieve to Justify Inclusion of a Database in a Systematic Review Search? - Ross‐White - 2017 - Health Information & Libraries Journal - Wiley Online Library.” https://onlinelibrary-wiley-com.proxy2.library.illinois.edu/doi/full/10. 1111/hir.12185 (June 20, 2023).
[6]. Lehane, Elaine et al. 2019. “Evidence-Based Practice Education for Healthcare Professions: An Expert View.” BMJ Evidence-Based Medicine 24(3): 103–8.
[7]. Midway, Stephen R. 2020. “Principles of Effective Data Visualization.” Patterns 1(9): 100141.
[8]. O’Mara-Eves, Alison et al. 2015. “Using Text Mining for Study Identification in Systematic Reviews: A Systematic Review of Current Approaches.” Systematic Reviews 4(1): 5.
[9]. Prather, Kimberly A. et al. 2020. “Airborne Transmission of SARS-CoV-2.” Science 370(6514): 303–4.
[10]. “Scopus | The Largest Database of Peer-Reviewed Literature | Elsevier.” https://www.elsevier. com/en-gb/solutions/scopus (June 20, 2023).
[11]. Siddaway, Andy P., Alex M. Wood, and Larry V. Hedges. 2019. “How to Do a Systematic Review: A Best Practice Guide for Conducting and Reporting Narrative Reviews, Meta-Analyses, and Meta-Syntheses.” Annual Review of Psychology 70: 747–70.
[12]. Trinquart, Ludovic, David Merritt Johns, and Sandro Galea. 2016. “Why Do We Think We Know What We Know? A Metaknowledge Analysis of the Salt Controversy.” International Journal of Epidemiology 45(1): 251–60.
[13]. Yu, Xiao, Quanquan Gu, Mianwei Zhou, and Jiawei Han. 2012. “Citation Prediction in Heterogeneous Bibliographic Networks.” In Proceedings of the 2012 SIAM International Conference on Data Mining (SDM), Proceedings, Society for Industrial and Applied Mathematics, 1119–30. https://epubs.siam.org/doi/abs/10.1137/1.9781611972825.96 (June 20, 2023).