


1. Background of the Study
The Code of Governance for Listed Companies issued by the China Securities Regulatory Commission (CSRC) clearly states that listed companies should associate executive compensation with corporate performance and individual performance. At present, many enterprises in China have implemented a performance-based compensation system, and the application of performance-based pay is becoming more and more widespread. Executive compensation performance sensitivity refers to the extent to which executive compensation changes with company performance, i.e., the degree of closeness between executive compensation and company performance [1], including both the relevance of pay performance and the size of the degree of relevance [2]. If it works properly, it will produce surprisingly good results, and vice versa, it will lead to bad results. A large number of studies have shown that pay-for-performance positively affects employees' work attitudes (including work engagement [3], job satisfaction [4], pay equity [5-6], etc.); work behaviours (organisational citizenship behaviours [7], etc.); and work outcomes (employee performance levels [8], etc.), as well as firms' investment efficiency [9], and firm performance [10-11]. However, from the perspective of corporate innovation, can the performance-based design of executive incentives still achieve positive results? The research of existing scholars on executive compensation performance sensitivity and corporate innovation has not reached a consistent conclusion. Based on the optimal contract theory, some scholars believe that linking executive compensation to corporate performance can reduce the principal-agent problem and lead executives to make innovative decisions in favour of corporate development [12-13]. The other part of scholars believe that corporate innovation is characterised by high risk, long lead time and lag, and that paying executives on the basis of performance will cause executives to cut down on innovation inputs for the sake of short-term performance improvement, which is not conducive to corporate innovation [14-15]. These two distinct research conclusions are mostly based on the economic perspective, focusing on solving the principal-agent problem to explain the impact of pay performance sensitivity on corporate innovation, but neglecting the fact that pay performance sensitivity may have an impact on the psychology of executives and thus on corporate innovation. However, intrinsic motivation is an important psychological mechanism connecting between extrinsic incentives and innovative behaviour [16-17]. Survey results show that our employees have high negative emotions at work, and monetary stress is the most significant stressor in the workplace. So, how does executive pay performance sensitivity affect executive psychology and how does it further influence corporate innovation?
In addition, corporate innovation does not happen out of nowhere and must be responsive to the environment in which the organisation operates [18]. The world is currently in a period of great political, economic, capital and technological change, and in particular, the trade friction between the United States and China and the new coronavirus pneumonia epidemic starting in 2020, all of which inevitably bring great uncertainty to the business environment of domestic and foreign firms. How, then, does executive pay performance sensitivity affect corporate innovation in an uncertain environment?
In view of this, this paper examines the impact of executive pay performance sensitivity on firm innovation and further analyses whether this impact varies according to the nature of the industry in the context of environmental uncertainty. The possible contributions are as follows: (1) to explore in depth the intrinsic mechanism by which executive pay performance sensitivity affects executives' psychology and behaviour and then corporate innovation from the perspectives of cognitive psychology and behavioural psychology; (2) to analyse the differences in the impact of executive pay performance sensitivity on corporate innovation based on the different characteristics of industries, and to test whether the inhibitory effect of executive pay performance sensitivity on corporate innovation varies according to the intrinsic motivation for corporate innovation in the industry. differently. (3) In the context of environmental uncertainty, the impact of executive compensation performance sensitivity on corporate innovation is demonstrated, which not only has a positive significance in evaluating the incentive effect of pay-for-performance in China, but also helps enterprises to formulate a scientific incentive system for executive compensation in response to the environmental uncertainty, and promotes the high-quality development of innovation.
2. Theoretical Analysis and Research Hypotheses
2.1. Executive Pay Performance Sensitivity and Corporate Innovation
The effect of executive compensation performance sensitivity on corporate innovation can be explained through two major perspectives. First, based on the cognitive psychology perspective, performance pay inhibits employees' intrinsic motivation to innovate. The theory of constituent components of creativity states that the strong intrinsic motivation an individual has for a work task is more important for creativity than the professional knowledge skills and various creative techniques an individual possesses [19]. However, cognitive appraisal theory emphasises that extrinsic motivation can change the psychological state of employees from the inside out and inhibit their intrinsic motivation [20] for the following reasons: firstly, pay-performance sensitivity creates overreasoning. Pay performance sensitivity can weaken employees' perceived level and become an external attribution of their hard work, impairing their endogenous interest in and value of innovative work [21]; second, pay performance sensitivity can inhibit employees' self-determination and sense of autonomy [22]. Second, pay performance sensitivity can inhibit employees' self-determination and sense of autonomy [22]. Human beings are inherently in pursuit of freedom and self-determination, and pay performance sensitivity is based on rewarding the completion of performance tasks, which presents control over employees' self-determination and undermines their intrinsic motivation; and third, there are "invisible costs" of pay performance sensitivity. Thirdly, pay performance sensitivity has "hidden costs". Pay performance sensitivity tends to make employees focus on the value of rewards, and tends to favour routine production and operation activities that are easier to obtain rewards, rather than innovative activities that require divergent thinking [23]. Secondly, based on the behavioural psychology perspective, pay-for-performance can stimulate employees' rejection of innovative behaviours. The theory of learned diligence states that individuals are born with an aversion to hard work and frustration [24]. Corporate innovation differs from traditional rule-based work tasks in that it is a new exploration of uncharted territory, a creative endeavour for which traditional pay-for-performance is inapplicable [25], and the optimal pay incentive scheme for this type of work must be able to show a relatively large degree of tolerance for early failures, and a significant incentive for long-term success [26]. An employee will be reluctant to engage in innovative activities if he is penalised for lower profits as a result of first failure [15]. Eisenberger and Aselage (2009) [17] also pointed out that pay for performance increases the performance pressure on employees and awakens their aversion and anxiety, which leads to conservative ways of accomplishing performance rather than daring to innovate.
In summary, executive pay performance sensitivity weakens executives' intrinsic motivation and creativity, enhances executives' job aversion tendencies and occupational anxiety, and thus reduces corporate innovation. Therefore, Hypothesis 1 is proposed:
H1: Executive pay performance sensitivity has a significant inhibitory effect on corporate innovation.
2.2. The Moderating Effect of Environmental Uncertainty
The external environment is the cornerstone of the enterprise's survival and long-term development, and it is one of the main factors that enterprises need to consider when making innovation decisions. In recent years, the global economy has shown a lack of growth momentum, anti-globalisation trend is gradually intensifying, new technologies continue to emerge and trade protectionism is becoming more and more serious and other issues, which have increased the risk of business operations, and a high degree of uncertainty has become the most important feature of the external environment. Based on the theory of real options, it has been argued that the investment in corporate innovation can be regarded as an option, and that high environmental uncertainty increases the marginal investment cost, and enterprises tend to delay investment to avoid losses, thus environmental uncertainty is unfavourable to corporate innovation [27-28]. However, some studies have pointed out that, based on the "Knight's uncertainty" proposition, environmental changes make existing products unable to satisfy customer and market needs, which increases the risks faced by firms, but also provides unprecedented opportunities for firms to innovate, forcing firms to develop new products to cope with the environmental changes, and thus increase R&D investment [ 29-30]. 29-30].
This paper argues that in an environment of high uncertainty, the stronger the firm's willingness to survive and seek growth, forcing executives to favour innovation to gain competitive advantage in order to improve firm performance. In such a situation, executives' intrinsic motivation to innovate is stronger, and the inhibitory effect of pay performance sensitivity on corporate innovation is weakened. Conversely, in an environment of low uncertainty, executives do not have strong intrinsic motivation to change the firm's recent situation, and in order to avoid risks, executives will reduce their investment in R&D and innovation out of pay performance sensitivity. Therefore, Hypothesis 2 is proposed:
H2: The higher the environmental uncertainty, the less significant is the inhibitory effect of executive pay performance sensitivity on corporate innovation.
2.3. The Moderating Role of High-Tech Industries
As the value and importance of technological innovation to different industries are significantly different, the demand for innovation by enterprises in different industries is also significantly different. Traditional industries have relatively mature production technologies, standardised products and low industry dynamics, so there is little external pressure and insufficient intrinsic demand for enterprise innovation. In contrast, high-tech industries are technology-intensive, and innovation is an important ability to measure enterprise value and improve competitive advantage. It has been pointed out that the increase in market value of high-tech enterprises due to corporate innovation is four times higher than that of non-high-tech enterprises [31]. Frenkel et al. (2001) [32], taking enterprises in Germany and Israel as their research samples, found that the level of innovation and the frequency of innovation in high-tech industries were significantly higher than that in traditional industries after dividing the types of industries. Meanwhile, Balkin et al. (2000) [33] and Makri et al. (2006) [34] found that in high-tech enterprises, executive compensation increases with the enhancement of corporate innovation, and there is a strong positive correlation between the two, however, this positive correlation is weakened or non-existent in non-high-tech enterprises.
To sum up, in high-tech enterprises, executives have stronger motivation to improve enterprise performance and promote enterprise development through innovation, which weakens the inhibitory effect of pay performance sensitivity on enterprise innovation; while in non-high-tech enterprises, the "crowding out effect" of pay performance sensitivity on executives' intrinsic motivation is more obvious, which suppresses In non-high-tech enterprises, the "crowding out effect" of pay performance sensitivity on executives' intrinsic motivation is more obvious, thus inhibiting enterprise innovation. Therefore, hypothesis 3 is proposed:
H3: Compared with non-high-tech enterprises, the inhibitory effect of executive pay performance sensitivity on enterprise innovation is not significant in high-tech enterprises.
2.4. Dual Moderating Effect of Environmental Uncertainty and High-Tech Industry
Prospect theory points out that people have a strong sensitivity to losses. Although high-tech enterprises have stronger intrinsic motivation to innovate to improve their competitive advantage, the increase of environmental uncertainty will inhibit the innovation investment of high-tech enterprises for the following two main reasons: firstly, the increase of environmental uncertainty will increase the business risk of enterprises, and the high-tech enterprises may suffer from financial resource constraints [35], and the shortage of funds impedes the implementation of enterprise innovation strategy. Second, increased environmental uncertainty will also weaken executives' judgement and prediction ability of external information, increasing the possibility of investment project failure, resulting in executives being more cautious in making innovation investment decisions [36]. Therefore, when environmental uncertainty is high, high-tech enterprises will hold off innovation behaviour and wait until the environment is clearer before making decisions. In summary, Hypothesis 4 is proposed:
H4: With the increase of environmental uncertainty, the inhibitory effect of high-tech enterprises' executive compensation performance sensitivity on corporate innovation becomes significant.
The theoretical hypothesis model of this paper is shown in Figure 1:
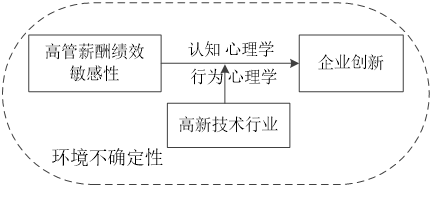
Figure 1. Theoretical Hypothesis Model
3. Research Design
3.1. Sample Selection and Data Source
This paper selects A-share listed companies in China's Shanghai and Shenzhen cities from 2015 to 2020 as the research sample, and in order to ensure the quality of the data, ST, *ST, PT companies with abnormal operation, financial and insurance companies, and companies with incomplete data are excluded, and all the continuous variables are trimmed according to the ratio of 1% in order to avoid the influence of extreme values. After censoring the samples, 3838 samples were finally obtained. The corporate financial data and corporate governance data were obtained from the CSMAR (Cathay Pacific) database, and the corporate innovation data were obtained from the CNRDS (China Research Data Service Platform) database. The data were analysed using Stata 15.0 operating software.
3.2. Definition of Variables
(1) Executive compensation performance sensitivity
Drawing on the studies of Chen et al. (2011) [37] and Liu Tao et al. (2013) [38], using the concept of elasticity in the integral, Δexecutive compensation / Δcompany performance is taken as a measure of executive pay performance sensitivity. Where Income denotes the total compensation of the top three executives, Performance denotes the net profit of the firm, and Ni denotes the total number of sample firms in firm i's industry. Equation (1) is the unindustry-adjusted executive pay performance sensitivity, and equation (2) is the industry-adjusted executive pay performance sensitivity.
\( SPS1=\frac{Incomeit-Incomeit-1}{Performanceit-Performanceit-1} \) (1)
\( SPS2 = AdjSPSit = SPS1it - \frac{1}{Ni}\sum_{k=1}^{Ni}SPS1kt \) (2)
(2) Corporate innovation
Drawing on Yuan et al. (2015) [39] and Liu et al. (2019) [40], the natural logarithm of listed companies' R&D investment is used to measure firm innovation.
(3) Environmental uncertainty
Referring to the approach of Huihui Shen, Peng Yu and Liansheng Wu (2012) [41], the standard deviation of sales revenue is used to measure external environmental uncertainty. In order to accurately measure environmental uncertainty, it is necessary to exclude sales revenues due to firms' steady growth, i.e., using data from the past five years of each firm, the model (3) is run using the OLS method so as to estimate abnormal sales revenues for the past five years of each firm:
Sale = φ 0 + φ 1 Year + ε (3)
Where Sale denotes the sales revenue and Year denotes the year; Year is 1 if the observation of the sample is from the past 4th year, 2 if the observation of the sample is from the past 3rd year, and so on; Year is 5 if the observation of the sample is from the current year.The residuals of the model (3) are the abnormal sales revenues; firstly, the unindustry-adjusted environmental uncertainty is computed, i.e., by dividing the standard deviation of abnormal sales revenues of each company in the past five years divided by the average of sales revenues in the past five years; then, calculate the industry environmental uncertainty, i.e., the median of the unindustry-adjusted environmental uncertainty of all the companies in the same industry in the same year; and finally, calculate the industry-adjusted environmental uncertainty, i.e., divide the unindustry-adjusted environmental uncertainty of each company by the industry environmental uncertainty. The environmental uncertainty EU in this paper is expressed as a dummy variable, taking environmental uncertainty above the annual mean as 1 and 0 otherwise.
(4) High-tech industry
Referring to the practice of Li Tao and Chen Qing (2020) [42] and the industries published by the National Bureau of Statistics (NBS) in the Format for Compiling and Publishing Statistics on High-Tech Industries, we include chemical raw materials and chemical products manufacturing, pharmaceutical manufacturing, chemical fibre manufacturing, non-ferrous metal smelting and rolling processing industry, metal products industry, electrical machinery and equipment manufacturing, computer, communication and other electronic equipment manufacturing, Instrumentation Manufacturing, Software and Information Technology Services, General Equipment Manufacturing, Telecommunications, Radio and Television and Satellite Transmission Services 11 industries are classified as high-tech industries with HTI=1, and the others are non-high-tech industries with HTI=0.
(5) Control variables
Synthesising the existing literature on the research on the impact of corporate innovation, this paper selects the following variables as control variables. The definition and measure of each variable are shown in Table 1.
Table 1. List of Variables
Symbol |
Variable Name |
Variable Explanation |
|
Dependent Variable |
INNO |
Corporate Innovation |
Natural logarithm of R&D investment |
Explanatory Variable |
SPS1 |
Executive Compensation Performance Sensitivity |
See Equation (1) |
SPS2 |
Environmental Uncertainty |
See Equation (2) |
|
Moderating Variable |
EU |
High-tech Industry |
Dummy variable, take 1 if environmental uncertainty exceeds the annual mean, otherwise 0 |
HTI |
Board Size |
Take 1 if in the high-tech industry, otherwise 0 |
|
Control Variable |
Board |
Proportion of Independent Directors |
Natural logarithm of the number of board members |
Outdir |
Dual Roles (Chairman and CEO) |
The proportion of independent directors in the company |
|
Dual |
Property Nature |
Chairman and General Manager hold the same position, take 1 if the same person, otherwise 2 |
|
Soe |
Company Size |
Take 1 for state-owned enterprises, otherwise 0 |
|
Asset |
Debt-to-Asset Ratio |
Natural logarithm of total company assets |
|
Lev |
Shareholding Concentration |
Total liabilities divided by total assets |
|
Shrcr |
Cash Flow Ratio |
The number of shares held by the largest shareholder divided by the total number of shares |
|
OCF |
Executive Stockholding Ratio |
The ratio of net cash flow from operating activities to total assets |
|
CG |
Management Stockholding Ratio |
The number of shares held by executives divided by the total number of shares |
|
MStock |
Listing Duration |
The ratio of the number of shares held by the management to the total number of shares |
|
IPOage |
Government Subsidy |
Natural logarithm of the number of years the company has been listed |
|
Amount |
Return on Equity (ROE) |
Natural logarithm of the amount of government subsidy |
|
ROE |
Growth |
Net profit divided by net assets |
|
Grow |
Year |
Net profit growth rate |
|
Year |
Industry |
Dummy variable |
|
Indus |
Corporate Innovation |
Dummy variable |
3.3. Model Construction
Based on the research hypotheses and variable design, in conjunction with previous studies, this paper constructs the following models:
\( INNO=β0+β1SPS+\sumβj*Control+ε \) (3)
\( INNO=β0+β1SPS+β2HTI+β3SPS*HTI+\sumβj*Control+ε \) (4)
Model (3) is used to test the relationship between executive compensation performance sensitivity and corporate innovation, Model (4) is used to test the moderating effect of the high-tech industry, and group regression is used to test the moderating effect of environmental uncertainty.
4. Empirical Analysis
4.1. Descriptive Statistics
Table 2. Descriptive Statistical Analysis of Variables
Variable Name |
Number of Observations |
Mean |
Standard Deviation |
Minimum Value |
Maximum Value |
INNO |
3838 |
18.004 |
1.369 |
13.138 |
21.613 |
SPS1 |
3838 |
0.007 |
0.285 |
-4.348 |
12.758 |
SPS2 |
3838 |
-0.004 |
0.285 |
-4.345 |
12.694 |
EU |
3838 |
0.248 |
0.432 |
0 |
1 |
HTI |
3838 |
0.550 |
0.498 |
0 |
1 |
Board |
3838 |
2.119 |
0.196 |
1.609 |
2.708 |
Outdir |
3838 |
0.377 |
0.054 |
0.333 |
0.571 |
Dual |
3838 |
1.694 |
0.461 |
1 |
2 |
Soe |
3838 |
0.229 |
0.420 |
0 |
1 |
Asset |
3838 |
22.213 |
1.203 |
19.511 |
26.026 |
Lev |
3838 |
0.396 |
0.190 |
0.047 |
0.931 |
Shrcr |
3838 |
33.337 |
14.553 |
8.772 |
75.005 |
OCF |
3838 |
0.046 |
0.064 |
-0.186 |
0.239 |
CG |
3838 |
0.086 |
0.139 |
0 |
0.621 |
MStock |
3838 |
0.171 |
0.195 |
0 |
0.698 |
IPOage |
3838 |
2.211 |
0.396 |
0.693 |
2.890 |
Amount |
3838 |
13.474 |
2.603 |
7.601 |
19.641 |
ROE |
3838 |
0.064 |
0.108 |
-0.477 |
0.368 |
Grow |
3838 |
-0.244 |
3.616 |
-24.204 |
12.502 |
From Table 2, it can be seen that the mean of INNO is 18.004, with a standard deviation of 1.369, a minimum value of 13.138, and a maximum value of 21.613. This indicates that companies are increasingly valuing innovation, but it is worth noting that the amount of R&D investment is still generally low, and there are significant differences in R&D investment among different companies. The means of SPS1 and SPS2 are 0.007 and -0.004, respectively, with a standard deviation of 0.285, indicating that the overall executive compensation performance sensitivity of companies is relatively low. The mean and standard deviation of EU are 0.248 and 0.432, respectively, suggesting that the external environment faced by listed companies is quite dynamic. The mean of HTI is 0.550, and the proportion of high-tech industries in the sample reaches 55%. In terms of control variables, the standard deviations of Asset, ROE, Soe, Outdir, Dual, Lev, and OCF are relatively small, and the maximum and minimum values are within a certain range. The distribution of each control variable is relatively concentrated, with no severe deviation occurring.
4.2. Correlation Analysis
Through the Pearson correlation test of all variables, it was found that INNO is significantly negatively correlated with SPS1 and SPS2, a result that is consistent with the expected hypothesis, laying the foundation for subsequent empirical analysis. In addition, the correlation coefficient between SPS1 and SPS2 is relatively large, but they are two different measures of executive compensation performance sensitivity and are not included in the same model. Among the control variables, the correlation coefficients of Asset with INNO, Outdir with Board, and Asset with Lev all exceeded 0.5. After testing for the variance inflation factor, it was found that the VIF values were all below 10, indicating that there is no multicollinearity among the variables, and the model can proceed with regression analysis.
4.3. Regression Results
(1) Executive Compensation Performance Sensitivity and Corporate Innovation
To analyse the relationship between executive compensation performance sensitivity and corporate innovation, regression analysis was conducted on the sample according to Model (1) established in the previous text, and group regression was performed according to environmental uncertainty. The regression results are shown in Table 3:
Table 3. Regression Results of the Impact of Executive Compensation Performance Sensitivity on Corporate Innovation
Variable |
Independent Variable: SPS1 |
Independent Variable: SPS1 |
||||
Full Sample |
High Environmental Uncertainty |
Low Environmental Uncertainty |
Full Sample |
High Environmental Uncertainty |
Low Environmental Uncertainty |
|
SPS |
-0.125** |
0.077 |
-0.146*** |
-0.119** |
0.062 |
-0.137** |
(-2.33) |
(0.36) |
(-2.73) |
(-2.22) |
(0.29) |
(-2.57) |
|
Board |
-0.062 |
0.009 |
-0.096 |
-0.063 |
0.010 |
-0.096 |
(-0.59) |
(0.04) |
(-0.81) |
(-0.59) |
(0.04) |
(-0.81) |
|
Outdir |
0.371 |
-0.288 |
0.653 |
0.370 |
-0.285 |
0.653 |
(1.04) |
(-0.37) |
(1.64) |
(1.04) |
(-0.37) |
(1.64) |
|
Dual |
-0.049 |
-0.078 |
-0.040 |
-0.049 |
-0.078 |
-0.040 |
(-1.19) |
(-0.88) |
(-0.87) |
(-1.19) |
(-0.88) |
(-0.88) |
|
Soe |
-0.038 |
-0.005 |
-0.026 |
-0.038 |
-0.005 |
-0.026 |
(-0.81) |
(-0.04) |
(-0.50) |
(-0.82) |
(-0.05) |
(-0.51) |
|
Asset |
0.806*** |
0.837*** |
0.800*** |
0.806*** |
0.837*** |
0.800*** |
(41.71) |
(19.90) |
(36.89) |
(41.72) |
(19.90) |
(36.90) |
|
Lev |
-0.463*** |
-0.465** |
-0.440*** |
-0.463*** |
-0.464** |
-0.439*** |
(-4.37) |
(-2.08) |
(-3.68) |
(-4.38) |
(-2.07) |
(-3.68) |
|
Shrcr |
-0.003*** |
-0.005* |
-0.003** |
-0.003*** |
-0.005* |
-0.003** |
(-2.73) |
(-1.72) |
(-2.35) |
(-2.74) |
(-1.72) |
(-2.35) |
|
OCF |
0.787*** |
0.733 |
0.630** |
0.786*** |
0.734 |
0.630** |
(3.03) |
(1.42) |
(2.09) |
(3.03) |
(1.42) |
(2.09) |
|
CG |
0.214 |
0.552 |
0.095 |
0.213 |
0.550 |
0.092 |
(1.15) |
(1.34) |
(0.46) |
(1.14) |
(1.33) |
(0.44) |
|
MStock |
0.109 |
0.102 |
0.120 |
0.109 |
0.104 |
0.121 |
(0.83) |
(0.35) |
(0.84) |
(0.84) |
(0.35) |
(0.84) |
|
IPOage |
0.025 |
-0.291** |
0.112** |
0.025 |
-0.291** |
0.112** |
(0.52) |
(-2.33) |
(2.20) |
(0.51) |
(-2.32) |
(2.20) |
|
Amount |
0.034*** |
0.051*** |
0.026*** |
0.034*** |
0.051*** |
0.026*** |
(5.25) |
(3.68) |
(3.64) |
(5.25) |
(3.68) |
(3.63) |
|
ROE |
1.629*** |
0.900*** |
2.087*** |
1.629*** |
0.900*** |
2.085*** |
(9.11) |
(2.82) |
(9.42) |
(9.10) |
(2.82) |
(9.42) |
|
Grow |
-0.012** |
-0.003 |
-0.019*** |
-0.012** |
-0.003 |
-0.019*** |
(-2.49) |
(-0.38) |
(-3.05) |
(-2.49) |
(-0.38) |
(-3.05) |
|
C |
-1.039** |
-1.130 |
-1.096** |
-1.040** |
-1.129 |
-1.097** |
(-2.21) |
(-1.09) |
(-2.09) |
(-2.21) |
(-1.09) |
(-2.09) |
|
Year |
Control |
Control |
Control |
Control |
Control |
Control |
Indus |
Control |
Control |
Control |
Control |
Control |
Control |
N |
3838 |
953 |
2885 |
3838 |
953 |
2885 |
R2 |
0.533 |
0.509 |
0.555 |
0.533 |
0.509 |
0.555 |
F Value |
120.28*** |
27.95*** |
98.76*** |
120.25*** |
27.94*** |
98.71*** |
Note: *, **, *** denote significant at 10%, 5%, and 1% significance levels, respectively.
As can be seen from Table 3, the regression coefficients of SPS1 and SPS2 in the full sample are -0.125 and -0.119, respectively, which are significant and negative at the 5% significance level, which indicates that executive compensation performance sensitivity can significantly inhibit corporate innovation.H1 is verified. The regression coefficients of SPS and INNO are not significant when the environmental uncertainty is high, and the regression coefficients and t-values of SPS and t-values of SPS are -0.146 (t=-2.73) and -0.137 (t=-2.57) respectively when the environmental uncertainty is low, which are significantly negatively correlated at 1% and 5% levels, which indicates that the more the environment with lower uncertainty, the more the sensitivity of executive compensation performance on corporate innovation is the more significant the inhibitory effect on corporate innovation, while when environmental uncertainty increases, the inhibitory effect of executive compensation performance sensitivity on corporate innovation is not obvious.H2 is verified.
(2) The moderating effect of high-tech industry
In order to further explore whether the effect of executive pay performance sensitivity on corporate innovation varies by industry. The cross-multiplier term of SPS*HTI is brought into model (2) for regression, and the regression results are shown in Table 4:
Table 4. Moderating Effect of High and New Technology Industries
Variable |
Independent Variable: SPS1 |
Independent Variable: SPS1 |
|||||
Full Sample |
High Environmental Uncertainty |
Low Environmental Uncertainty |
Full Sample |
High Environmental Uncertainty |
Low Environmental Uncertainty |
||
SPS |
-0.204*** |
-1.398 |
-0.198*** |
-0.190*** |
-0.874 |
-0.187*** |
|
(-3.38) |
(-1.36) |
(-3.43) |
(-3.15) |
(-0.99) |
(-3.22) |
||
HTI |
0.307*** |
0.084 |
0.362*** |
0.312*** |
0.102 |
0.367*** |
|
(8.73) |
(1.06) |
(9.25) |
(8.87) |
(1.30) |
(9.38) |
||
SPS*HTI |
0.394*** |
1.555 |
0.378*** |
0.355*** |
1.005 |
0.345** |
|
(3.13) |
(1.48) |
(2.69) |
(2.83) |
(1.10) |
(2.48) |
||
Board |
-0.005 |
0.031 |
-0.013 |
-0.007 |
0.021 |
-0.014 |
|
(-0.05) |
(0.14) |
(-0.11) |
(-0.06) |
(0.09) |
(-0.12) |
||
Outdir |
0.476 |
-0.130 |
0.667* |
0.476 |
-0.167 |
0.668* |
|
(1.35) |
(-0.17) |
(1.70) |
(1.35) |
(-0.21) |
(1.71) |
||
Dual |
-0.053 |
-0.081 |
-0.051 |
-0.053 |
-0.077 |
-0.051 |
|
(-1.32) |
(-0.92) |
(-1.14) |
(-1.31) |
(-0.87) |
(-1.13) |
||
Soe |
-0.039 |
0.006 |
-0.036 |
-0.039 |
0.005 |
-0.036 |
|
(-0.85) |
(0.06) |
(-0.70) |
(-0.85) |
(0.05) |
(-0.71) |
||
Asset |
0.816*** |
0.834*** |
0.811*** |
0.816*** |
0.838*** |
0.811*** |
|
(42.62) |
(19.70) |
(37.94) |
(42.61) |
(19.87) |
(37.93) |
||
Lev |
-0.427*** |
-0.450** |
-0.404*** |
-0.426*** |
-0.458** |
-0.402*** |
|
(-4.07) |
(-2.01) |
(-3.43) |
(-4.07) |
(-2.04) |
(-3.42) |
||
Shrcr |
-0.003** |
-0.005* |
-0.003** |
-0.003** |
-0.005* |
-0.003** |
|
(-2.49) |
(-1.70) |
(-2.17) |
(-2.50) |
(-1.70) |
(-2.18) |
||
OCF |
0.863*** |
0.689 |
0.770*** |
0.864*** |
0.690 |
0.772*** |
|
(3.36) |
(1.34) |
(2.59) |
(3.36) |
(1.34) |
(2.60) |
||
CG |
0.183 |
0.523 |
0.062 |
0.182 |
0.540 |
0.061 |
|
(0.99) |
(1.27) |
(0.30) |
(0.99) |
(1.31) |
(0.30) |
||
MStock |
0.106 |
0.097 |
0.118 |
0.106 |
0.093 |
0.118 |
|
(0.82) |
(0.33) |
(0.83) |
(0.83) |
(0.32) |
(0.83) |
||
IPOage |
0.002 |
-0.298** |
0.085* |
0.002 |
-0.300** |
0.084* |
|
(0.05) |
(-2.38) |
(1.68) |
(0.05) |
(-2.40) |
(1.67) |
||
Amount |
0.032*** |
0.050*** |
0.024*** |
0.032*** |
0.050*** |
0.024*** |
|
(5.01) |
(3.66) |
(3.38) |
(5.01) |
(3.64) |
(3.38) |
||
ROE |
1.551*** |
0.917*** |
1.959*** |
1.554*** |
0.914*** |
1.962*** |
|
(8.76) |
(2.88) |
(8.97) |
(8.77) |
(2.86) |
(8.98) |
||
Grow |
-0.011** |
-0.003 |
-0.018*** |
-0.011** |
-0.003 |
-0.018*** |
|
(-2.31) |
(-0.35) |
(-2.89) |
(-2.32) |
(-0.35) |
(-2.90) |
||
C |
-1.368*** |
-1.158 |
-1.439*** |
-1.369*** |
-1.207 |
-1.440*** |
|
(-2.93) |
(-1.11) |
(-2.77) |
(-2.93) |
(-1.15) |
(-2.78) |
||
Year |
Control |
Control |
Control |
Control |
Control |
Control |
|
Indus |
Control |
Control |
Control |
Control |
Control |
Control |
|
N |
3838 |
953 |
2885 |
3838 |
953 |
2885 |
|
R2 |
0.543 |
0.511 |
0.570 |
0.543 |
0.510 |
0.569 |
|
F Value |
118.80*** |
26.55*** |
99.08*** |
118.68*** |
26.49*** |
98.98*** |
|
Note: *, **, *** denote significant at 10%, 5%, 1% significance level respectively.
As shown in Table 4, from the full sample, the coefficients of SPS*HTI are 0.394, 0.355, p<0.01. It can be seen that the industry characteristics of high-tech enterprises can hedge the negative impact of executive pay performance sensitivity on corporate innovation, i.e., in high-tech enterprises, the negative impact of executive performance pay on corporate innovation is not significant, and H3 is verified. When environmental uncertainty is low, the coefficient and t-value of SPS*HTI are 0.378 (t=2.69) and 0.345 (t=2.48) respectively When environmental uncertainty is high, the coefficient of SPS*HTI is insignificant, which indicates that the lower the environmental uncertainty is, the less obvious the inhibitory effect of executive pay performance sensitivity on enterprise innovation in high and new-tech enterprises is, and that with the increase of environmental uncertainty, the the inhibitory effect of high-tech enterprises' executive compensation performance sensitivity on enterprise innovation becomes significant.H4 is verified.
4.4. Robustness Test
(1) Endogeneity test
In empirical analyses, the endogeneity problem affects the precision of empirical findings. In this study, there may be an interaction between executive pay performance sensitivity and corporate innovation. On the one hand, executive pay performance sensitivity affects corporate innovation; on the other hand, corporate innovation also affects firm performance and thus executive pay performance sensitivity. In this bidirectional causal relationship, the empirical conclusion that executive pay performance sensitivity inhibits corporate innovation may not be entirely accurate. For this reason, drawing on the study of Zhang Honghui and Zhang Linyi (2017) [43], we establish two regression models, substituting executive pay performance sensitivity and corporate innovation lagged one period into the model, respectively, and after removing the missing values of lagged variables, the regression results are shown in Table 5.
Table 5. Endogeneity Problem Test
Variable |
Dependent variable is INNO |
Dependent variable is SPS |
||
(1) |
(2) |
(3) |
(4) |
|
SPS |
-0.180*** |
-0.185*** |
||
(-2.99) |
(-3.06) |
|||
INNO |
0.001 |
0.001 |
||
(0.25) |
(0.21) |
|||
Board |
-0.105 |
-0.105 |
0.021 |
0.010 |
(-0.76) |
(-0.76) |
(0.65) |
(0.32) |
|
Outdir |
0.476 |
0.476 |
0.113 |
0.093 |
(1.02) |
(1.02) |
(1.05) |
(0.86) |
|
Dual |
-0.107** |
-0.108** |
0.020 |
0.021* |
(-1.99) |
(-1.99) |
(1.63) |
(1.70) |
|
Soe |
0.038 |
0.038 |
-0.005 |
-0.004 |
(0.60) |
(0.61) |
(-0.34) |
(-0.30) |
|
Asset |
0.796*** |
0.796*** |
-0.000 |
0.003 |
(31.20) |
(31.21) |
(-0.02) |
(0.38) |
|
Lev |
-0.577*** |
-0.578*** |
0.004 |
-0.001 |
(-4.04) |
(-4.05) |
(0.12) |
(-0.02) |
|
Shrcr |
-0.002 |
-0.002 |
0.000 |
0.000 |
(-1.47) |
(-1.48) |
(0.94) |
(0.77) |
|
OCF |
0.483 |
0.483 |
-0.098 |
-0.105 |
(1.39) |
(1.39) |
(-1.23) |
(-1.31) |
|
CG |
0.079 |
0.078 |
0.054 |
0.060 |
(0.32) |
(0.32) |
(0.95) |
(1.05) |
|
MStock |
0.241 |
0.240 |
-0.042 |
-0.046 |
(1.40) |
(1.40) |
(-1.07) |
(-1.16) |
|
IPOage |
0.035 |
0.035 |
-0.001 |
0.000 |
(0.49) |
(0.49) |
(-0.04) |
(0.01) |
|
Amount |
0.030*** |
0.030*** |
0.001 |
0.000 |
(3.46) |
(3.45) |
(0.39) |
(0.05) |
|
ROE |
2.633*** |
2.631*** |
-0.035 |
-0.031 |
(9.36) |
(9.36) |
(-0.53) |
(-0.47) |
|
Grow |
0.006 |
0.006 |
0.001 |
0.001 |
(0.81) |
(0.81) |
(0.39) |
(0.51) |
|
C |
-0.454 |
-0.454 |
-0.161 |
-0.187 |
(-0.72) |
(-0.72) |
(-1.12) |
(-1.29) |
|
Year |
Control |
Control |
Control |
Control |
Indus |
Control |
Control |
Control |
Control |
N |
2225 |
2225 |
2225 |
2225 |
R2 |
0.538 |
0.538 |
0.011 |
0.013 |
F Value |
75.05*** |
75.07*** |
0.73 |
0.86 |
Note: *, **, and *** indicate significant at 10%, 5%, and 1% significance levels, respectively.
The results in Table 5 show that SPS and INNO are significantly negatively correlated at the 1% level; the regression coefficient of INNO and SPS is not significant, which indicates that executive pay performance sensitivity influences corporate innovation rather than corporate innovation influences executive pay performance sensitivity, and the endogeneity issue does not have an impact on the conclusions of this paper.
(2) Replacement of moderating variables
This paper changes the measure of environmental uncertainty, when the environmental uncertainty is higher than the annual median, EU = 1, otherwise EU = 0, brought into the above model to re-regression, the results are shown in Table 6 and Table 7.
Table 6. Regression Results of Executive Compensation Performance Sensitivity Affecting Corporate Innovation (Robustness Test)
Variables |
Independent variable is SPS1 |
Independent variable is SPS2 |
||
Higher Environmental Uncertainty |
Lower Environmental Uncertainty |
Higher Environmental Uncertainty |
Lower Environmental Uncertainty |
|
SPS |
0.017 |
-0.170*** |
0.038 |
-0.167*** |
(0.14) |
(-2.98) |
(0.31) |
(-2.93) |
|
Board |
-0.188 |
0.077 |
-0.188 |
0.078 |
(-1.24) |
(0.53) |
(-1.24) |
(0.53) |
|
Outdir |
-0.371 |
1.292*** |
-0.372 |
1.292*** |
(-0.72) |
(2.68) |
(-0.72) |
(2.68) |
|
Dual |
-0.083 |
-0.033 |
-0.083 |
-0.033 |
(-1.44) |
(-0.57) |
(-1.44) |
(-0.58) |
|
Soe |
-0.054 |
0.021 |
-0.054 |
0.020 |
(-0.78) |
(0.33) |
(-0.78) |
(0.33) |
|
Asset |
0.843*** |
0.792*** |
0.843*** |
0.792*** |
(30.74) |
(29.01) |
(30.73) |
(29.01) |
|
Lev |
-0.378*** |
-0.640*** |
-0.378*** |
-0.639*** |
(-2.66) |
(-4.03) |
(-2.66) |
(-4.03) |
|
Shrcr |
-0.005*** |
-0.003* |
-0.005*** |
-0.003* |
(-3.02) |
(-1.69) |
(-3.02) |
(-1.69) |
|
OCF |
0.621* |
0.456 |
0.622* |
0.455 |
(1.82) |
(1.12) |
(1.82) |
(1.12) |
|
CG |
0.466* |
-0.131 |
0.465* |
-0.134 |
(1.81) |
(-0.49) |
(1.81) |
(-0.50) |
|
MStock |
0.227 |
0.046 |
0.228 |
0.047 |
(1.24) |
(0.25) |
(1.25) |
(0.26) |
|
IPOage |
0.098 |
-0.015 |
0.099 |
-0.016 |
(1.27) |
(-0.25) |
(1.27) |
(-0.26) |
|
Amount |
0.043*** |
0.022** |
0.043*** |
0.022** |
(4.77) |
(2.43) |
(4.76) |
(2.42) |
|
ROE |
1.195*** |
2.374*** |
1.195*** |
2.372*** |
(5.30) |
(7.96) |
(5.30) |
(7.95) |
|
Grow |
-0.014** |
-0.005 |
-0.014** |
-0.005 |
(-2.23) |
(-0.69) |
(-2.23) |
(-0.68) |
|
C |
-1.628** |
-0.964 |
-1.625** |
-0.966 |
(-2.42) |
(-1.47) |
(-2.41) |
(-1.47) |
|
Year |
Control |
Control |
Control |
Control |
Indus |
Control |
Control |
Control |
Control |
N |
2000 |
1838 |
2000 |
1838 |
R2 |
0.536 |
0.562 |
0.536 |
0.562 |
F Value |
66.74*** |
64.15*** |
66.75*** |
64.13*** |
Note: *, **, and *** indicate significant at 10%, 5%, and 1% significance levels, respectively.
As can be seen from Table 6, the coefficient of SPS is not significant when environmental uncertainty is high, and the significant of SPS is negative when environmental uncertainty is low, and H2 passes the robustness test.
Table 7. Moderating Effect of High and New Technology Industries (Robustness Test)
Independent variable is SPS1 |
Independent variable is SPS2 |
|||
Variables |
Higher Environmental Uncertainty |
Lower Environmental Uncertainty |
Higher Environmental Uncertainty |
Lower Environmental Uncertainty |
SPS |
0.011 |
-0.267*** |
0.055 |
-0.263*** |
(0.08) |
(-4.16) |
(0.41) |
(-4.08) |
|
HTI |
0.206*** |
0.398*** |
0.204*** |
0.403*** |
(4.10) |
(8.09) |
(4.06) |
(8.19) |
|
SPS*HTI |
0.036 |
0.465*** |
-0.102 |
0.449*** |
(0.11) |
(3.60) |
(-0.31) |
(3.48) |
|
Board |
-0.169 |
0.181 |
-0.171 |
0.179 |
(-1.11) |
(1.26) |
(-1.13) |
(1.25) |
|
Outdir |
-0.205 |
1.205** |
-0.214 |
1.207** |
(-0.40) |
(2.55) |
(-0.41) |
(2.55) |
|
Dual |
-0.085 |
-0.043 |
-0.085 |
-0.043 |
(-1.48) |
(-0.77) |
(-1.49) |
(-0.77) |
|
Soe |
-0.046 |
0.015 |
-0.046 |
0.015 |
(-0.66) |
(0.25) |
(-0.66) |
(0.25) |
|
Asset |
0.853*** |
0.797*** |
0.853*** |
0.797*** |
(31.09) |
(29.81) |
(31.07) |
(29.79) |
|
Lev |
-0.343** |
-0.619*** |
-0.341** |
-0.617*** |
(-2.41) |
(-3.98) |
(-2.40) |
(-3.97) |
|
Shrcr |
-0.005*** |
-0.003* |
-0.005*** |
-0.003* |
(-2.75) |
(-1.80) |
(-2.75) |
(-1.80) |
|
OCF |
0.668* |
0.615 |
0.673** |
0.615 |
(1.96) |
(1.55) |
(1.97) |
(1.55) |
|
CG |
0.446* |
-0.130 |
0.444* |
-0.131 |
(1.74) |
(-0.49) |
(1.73) |
(-0.50) |
|
MStock |
0.198 |
0.077 |
0.198 |
0.077 |
(1.09) |
(0.43) |
(1.09) |
(0.43) |
|
IPOage |
0.069 |
-0.030 |
0.069 |
-0.030 |
(0.88) |
(-0.50) |
(0.88) |
(-0.50) |
|
Amount |
0.042*** |
0.021** |
0.042*** |
0.021** |
(4.59) |
(2.39) |
(4.59) |
(2.40) |
|
ROE |
1.146*** |
2.294*** |
1.148*** |
2.298*** |
(5.10) |
(7.86) |
(5.10) |
(7.87) |
|
Grow |
-0.013** |
-0.004 |
-0.013** |
-0.004 |
(-2.15) |
(-0.47) |
(-2.15) |
(-0.48) |
|
C |
-1.888*** |
-1.227* |
-1.870*** |
-1.224* |
(-2.80) |
(-1.91) |
(-2.77) |
(-1.90) |
|
Year |
Control |
Control |
Control |
Control |
Indus |
Control |
Control |
Control |
Control |
N |
2000 |
1838 |
2000 |
1838 |
R2 |
0.540 |
0.581 |
0.540 |
0.580 |
F-value |
63.98*** |
65.52*** |
63.99*** |
65.46*** |
Note: *, **, *** denote significant at 10%, 5%, and 1% significance levels, respectively.
As shown in Table 7, the coefficient of SPS*HTI is not significant when environmental uncertainty is high, and the coefficient of SPS*HTI is significantly positive at 1% level when environmental uncertainty is low, and H4 passes the robustness test.
(3) Replacing other control variables
The shareholding ratio of the company's top three shareholders and the number of employees are used to measure the ratio of large shareholders' holdings and enterprise size, respectively, and the replaced control variables are brought into the above model to be regressed again. According to the test results, the coefficients and significance of the main effect and the moderating effect do not differ significantly, indicating that the above findings are robust. To save space, the results are not listed here.
5. Conclusions and Recommendations
5.1. Conclusion and Insights
This paper explores the impact of executive pay performance sensitivity on corporate innovation and the moderating role of high-tech industries in the context of environmental uncertainty, with a sample of A-share listed companies in Shanghai and Shenzhen from 2015 to 2020. The findings show that (1) from the perspective of corporate innovation, the effectiveness of executive performance pay design will be weakened and adversely affect corporate innovation. (2) Along with the increase of environmental uncertainty, the intrinsic need of enterprises to carry out innovation increases, and the unfavourable effect of performance-based executive compensation design on innovation is not obvious. (3) Since executives of high-tech enterprises have strong intrinsic motivation to carry out innovation, the inhibitory effect of performance-based executive compensation design on innovation is not obvious. That is to say, there is a certain substitutability between the impact of executives' intrinsic motivation and external performance-based pay incentives on corporate innovation. When executives themselves have strong motivation to innovate, the inhibitory effect of executive compensation performance sensitivity on corporate innovation is insignificant, but when executives themselves do not have have strong motivation to innovate, the inhibitory effect of executive compensation performance sensitivity on corporate innovation is significant. (4) Although high-tech enterprises have strong motivation to innovate, the inhibitory effect of executive compensation performance sensitivity on enterprise innovation will be significantly enhanced with the improvement of environmental uncertainty.
Based on the above conclusions, the following suggestions are made:
(1) From the perspective of promoting corporate innovation, the executive compensation contract should not only emphasise the correlation between compensation and short-term financial performance, but can better motivate executives to pay attention to corporate innovation by means of equity incentives, option incentives, and job promotions. In constructing the selection of indicators for evaluating corporate performance, non-financial performance indicators such as market share, employee training, innovation inputs, innovation outputs (including the number of patents, the number of new products, etc.), etc. can be added on the basis of financial performance indicators. (2) In order to better promote corporate innovation, companies should focus on promoting executive innovation through the dual role of intrinsic motivation and external incentives. In the environment of low uncertainty and in non-high-tech enterprises, they should focus on strengthening the intrinsic motivation of executives to innovate; in the environment of high uncertainty and in high-tech enterprises, they can moderately improve the performance-based compensation design, which can promote the improvement of the overall performance of the enterprise without inhibiting the innovation of the enterprise. (3) High-tech enterprises should appropriately adjust the performance sensitivity of executive compensation according to changes in the environment. With the increase of environmental uncertainty, enterprise resource constraint pressure and innovation risk increase, high-tech enterprises should also moderately weaken the sensitivity between executive compensation and enterprise performance, so as to wake up more executives' intrinsic motivation for innovation.
5.2. Deficiencies and Prospects
Restricted by objective conditions, this study inevitably has the following shortcomings: (1) Due to objective reasons, this paper selects net profit to measure corporate performance, and only investigates the impact of the correlation between executive compensation and corporate financial performance on corporate innovation, and fails to comprehensively consider the impact of the different types of executive compensation and corporate market performance, long-term performance, etc. on corporate innovation. (2) Environmental uncertainty can be divided into environmental dynamics and environmental hostility, and this paper fails to divide the dimensions to explore in depth the role of different dimensions of environmental uncertainty in the sensitivity of executive compensation performance in affecting corporate innovation.
References
[1]. Holmstrom, B., & Milgrom, P. (1987). Aggregation and linearity in the provision of intertemporal incentives. Econometrica: Journal of the Econometric Society, 55(2), 303-328.
[2]. Lu, R. (2008). Analysis of management power, compensation, and performance sensitivity: Empirical evidence from Chinese listed companies. Contemporary Finance & Economics, (07), 107-112.
[3]. Chang, E. (2006). Individual pay for performance and commitment HR practices in South Korea. Journal of World Business, 41(4), 368-381.
[4]. Heywood, J. S. (2006). Performance pay and job satisfaction. Journal of Industrial Relations, 48(4), 523-540.
[5]. Chang, E., & Hahn, J. (2006). Does pay-for-performance enhance perceived distributive justice for collectivistic employees? Personnel Review, 35(4), 397-412.
[6]. Ma, X., Zhu, L., Zhang, W., & Xu, M. (2011). The impact of compensation management elements on employees' organizational fairness: An interpretation based on the perspective of business model value sharing. Journal of Southeast University (Philosophy and Social Science Edition), 13(02), 39-45+80+127.
[7]. Zhang, M. (2012). The relationship between performance pay, organizational citizenship behavior, and task performance (Doctoral dissertation, Nanjing University of Science and Technology).
[8]. Paarsch, H. J., & Shearer, B. S. (2004). Male-female productivity differentials: The role of ability and incentives. CIRANO Working Papers.
[9]. Liu, X., Shi, D., & Liu, D. (2014). Managerial compensation, compensation performance sensitivity, and company inefficiency investment: An empirical study based on the dynamic panel system GMM model. Journal of Hunan University of Commerce, 21(04), 49-55.
[10]. Abowd, J. M. (1990). Does performance-based managerial compensation affect corporate performance? ILR Review, 43(3), 52-73.
[11]. McConaughy, D. L., & Mishra, C. S. (1996). Debt, performance-based incentives, and firm performance. Financial Management, 37-51.
[12]. Chang, X., Fu, K., Low, A., et al. (2015). Non-executive employee stock options and corporate innovation. Journal of Financial Economics, 115(1), 168-188.
[13]. Fang, J., Yu, C., Wang, R., & Yang, M. (2016). Performance-sensitive executive compensation contracts and corporate innovation activities. Industrial Economy Research, (04), 51-60.
[14]. Guo, S., Zhang, W., & Li, Z. (2017). Ownership nature, technological innovation investment, and executive compensation. Business Economics, 36(07), 93-98.
[15]. Xie, W. (2018). An empirical study on the impact of performance pay on corporate innovation. Finance & Trade Economics, 39(09), 141-156.
[16]. Amabile, T. M. (1996). Creativity and innovation in organizations. Boston: Harvard Business School Press.
[17]. Eisenberger, R., & Aselage, J. (2009). Incremental effects of reward on experienced performance pressure: Positive outcomes for intrinsic interest and creativity. Journal of Organizational Behavior, 30(1), 95-117.
[18]. Lueg, R., & Borisov, B. G. (2014). Archival or perceived measures of environmental uncertainty? Conceptualization and new empirical evidence. European Management Journal, 32(4), 658-671.
[19]. Amabile, T. M. (1983). The social psychology of creativity. New York: Springer-Verlag.
[20]. Amabile, T. M., & Pillemer, J. (2012). Perspectives on the social psychology of creativity. The Journal of Creative Behavior, 46(1), 3-15.
[21]. Condry, J. (1977). Enemies of exploration: Self-initiated versus other-initiated learning. Journal of Personality and Social Psychology, 35(7), 459-477.
[22]. Koestner, R., Ryan, R. M., Bernieri, F., et al. (1984). Setting limits on children's behavior: The differential effects of controlling vs. informational styles on intrinsic motivation and creativity. Journal of Personality, 52(3), 233-248.
[23]. Jiang, W., & Yao, W. (2015). Corporate innovation and executive compensation-performance sensitivity: An empirical study based on state-owned listed companies. Economic Management, 37(05), 63-73.
[24]. Yang, T., Ma, J., & Feng, X. (2017). A review and prospect of the relationship between performance pay and employee creativity. Science & Technology Progress and Policy, 34(15), 154-160.
[25]. Ederer, F., & Manso, G. (2013). Is pay for performance detrimental to innovation? Management Science, 59(7), 1496-1513.
[26]. Manso, G. (2011). Motivating innovation. The Journal of Finance, 66(5), 1823-1860.
[27]. Zhu, D. (2019). The impact of equity incentives on corporate innovation activities under uncertain environments. Economic Management, 41(02), 55-72.
[28]. Li, S., & Hong, W. (2020). Environmental uncertainty, transparency, and corporate innovation. Journal of Industrial Technological Economics, 39(08), 44-52.
[29]. Brouwer, M. (2000). Entrepreneurship and uncertainty: Innovation and competition among the many. Small Business Economics, 15(2), 149-160.
[30]. Han, Q., & Min, Y. (2018). Environmental uncertainty, managerial overconfidence, and R&D investment. Journal of Central South University (Social Science Edition), 24(06), 132-139.
[31]. Zhang, N., Xu, L., Dai, Z., & Li, Y. (2019). Product market competition, intellectual property protection, and corporate innovation investment. Financial Science, (11), 54-66.
[32]. Frenkel, A., Shefer, D., Koschatzky, K., et al. (2001). Firm characteristics, location, and regional innovation: A comparison between Israeli and German industrial firms. Regional Studies, 35(5), 415-429.
[33]. Balkin, D. B., Markman, G. D., & Gomez-Mejia, L. R. (2000). Is CEO pay in high-technology firms related to innovation? Academy of Management Journal, (6), 1118-1129.
[34]. Makri, M., Lane, P. J., & Gomez-Mejia, L. R. (2006). CEO incentives, innovation, and performance in technology-intensive firms: A reconciliation of outcome and behavior-based incentive schemes. Strategic Management Journal, (11), 1057-1080.
[35]. Baum, C. F., Caglayan, M., Stephan, A., et al. (2008). Uncertainty determinants of corporate liquidity. Economic Modelling, 25(5), 833-849.
[36]. Zhai, S., & Bi, X. (2016). Environmental uncertainty, management confidence, and corporate ambidextrous innovation investment. Journal of Zhongnan University of Economics and Law, (05), 91-100+159.
[37]. Chen, L., Lin, P., Song, F., et al. (2011). Managerial incentives, CEO characteristics, and corporate innovation in China’s private sector. Journal of Comparative Economics, 39(2), 176-190.
[38]. Liu, T., Mao, D., & Song, H. (2013). Institutional investors: Choosing governance or intervening governance—An endogenous study based on pay-performance sensitivity. Journal of Shanxi University of Finance and Economics, 35(11), 95-105.
[39]. Yuan, J., Cheng, C., & Hou, Q. (2015). Environmental uncertainty and corporate technological innovation—An empirical study based on Chinese listed companies. Management Review, 27(10), 60-69.
[40]. Liu, J., Luo, F., & Wang, J. (2019). Environmental uncertainty and corporate innovation investment—The moderating role of government subsidies and industry-finance integration. Economic Management, 41(08), 21-39.
[41]. Shen, H. H., Yu, P., & Wu, L. S. (2012). State-owned equity, environmental uncertainty, and investment efficiency. Economic Research Journal, 47(07), 113-126.
[42]. Li, T., & Chen, Q. (2020). Heterogeneous institutional investors, firm nature, and technological innovation. Industrial Technology Economics, 39(03), 30-39.
[43]. Zhang, H. H., & Zhang, L. Y. (2017). The effectiveness of compensation contracts, risk-taking, and corporate governance. Journal of Shanxi University of Finance and Economics, 39(09), 104-114.
Cite this article
Yue,X.;Qi,H. (2024). The Impact of Executive Compensation Performance Sensitivity on Corporate Innovation in an Uncertain Environment. Journal of Applied Economics and Policy Studies,6,51-66.
Data availability
The datasets used and/or analyzed during the current study will be available from the authors upon reasonable request.
Disclaimer/Publisher's Note
The statements, opinions and data contained in all publications are solely those of the individual author(s) and contributor(s) and not of EWA Publishing and/or the editor(s). EWA Publishing and/or the editor(s) disclaim responsibility for any injury to people or property resulting from any ideas, methods, instructions or products referred to in the content.
About volume
Journal:Journal of Applied Economics and Policy Studies
© 2024 by the author(s). Licensee EWA Publishing, Oxford, UK. This article is an open access article distributed under the terms and
conditions of the Creative Commons Attribution (CC BY) license. Authors who
publish this series agree to the following terms:
1. Authors retain copyright and grant the series right of first publication with the work simultaneously licensed under a Creative Commons
Attribution License that allows others to share the work with an acknowledgment of the work's authorship and initial publication in this
series.
2. Authors are able to enter into separate, additional contractual arrangements for the non-exclusive distribution of the series's published
version of the work (e.g., post it to an institutional repository or publish it in a book), with an acknowledgment of its initial
publication in this series.
3. Authors are permitted and encouraged to post their work online (e.g., in institutional repositories or on their website) prior to and
during the submission process, as it can lead to productive exchanges, as well as earlier and greater citation of published work (See
Open access policy for details).
References
[1]. Holmstrom, B., & Milgrom, P. (1987). Aggregation and linearity in the provision of intertemporal incentives. Econometrica: Journal of the Econometric Society, 55(2), 303-328.
[2]. Lu, R. (2008). Analysis of management power, compensation, and performance sensitivity: Empirical evidence from Chinese listed companies. Contemporary Finance & Economics, (07), 107-112.
[3]. Chang, E. (2006). Individual pay for performance and commitment HR practices in South Korea. Journal of World Business, 41(4), 368-381.
[4]. Heywood, J. S. (2006). Performance pay and job satisfaction. Journal of Industrial Relations, 48(4), 523-540.
[5]. Chang, E., & Hahn, J. (2006). Does pay-for-performance enhance perceived distributive justice for collectivistic employees? Personnel Review, 35(4), 397-412.
[6]. Ma, X., Zhu, L., Zhang, W., & Xu, M. (2011). The impact of compensation management elements on employees' organizational fairness: An interpretation based on the perspective of business model value sharing. Journal of Southeast University (Philosophy and Social Science Edition), 13(02), 39-45+80+127.
[7]. Zhang, M. (2012). The relationship between performance pay, organizational citizenship behavior, and task performance (Doctoral dissertation, Nanjing University of Science and Technology).
[8]. Paarsch, H. J., & Shearer, B. S. (2004). Male-female productivity differentials: The role of ability and incentives. CIRANO Working Papers.
[9]. Liu, X., Shi, D., & Liu, D. (2014). Managerial compensation, compensation performance sensitivity, and company inefficiency investment: An empirical study based on the dynamic panel system GMM model. Journal of Hunan University of Commerce, 21(04), 49-55.
[10]. Abowd, J. M. (1990). Does performance-based managerial compensation affect corporate performance? ILR Review, 43(3), 52-73.
[11]. McConaughy, D. L., & Mishra, C. S. (1996). Debt, performance-based incentives, and firm performance. Financial Management, 37-51.
[12]. Chang, X., Fu, K., Low, A., et al. (2015). Non-executive employee stock options and corporate innovation. Journal of Financial Economics, 115(1), 168-188.
[13]. Fang, J., Yu, C., Wang, R., & Yang, M. (2016). Performance-sensitive executive compensation contracts and corporate innovation activities. Industrial Economy Research, (04), 51-60.
[14]. Guo, S., Zhang, W., & Li, Z. (2017). Ownership nature, technological innovation investment, and executive compensation. Business Economics, 36(07), 93-98.
[15]. Xie, W. (2018). An empirical study on the impact of performance pay on corporate innovation. Finance & Trade Economics, 39(09), 141-156.
[16]. Amabile, T. M. (1996). Creativity and innovation in organizations. Boston: Harvard Business School Press.
[17]. Eisenberger, R., & Aselage, J. (2009). Incremental effects of reward on experienced performance pressure: Positive outcomes for intrinsic interest and creativity. Journal of Organizational Behavior, 30(1), 95-117.
[18]. Lueg, R., & Borisov, B. G. (2014). Archival or perceived measures of environmental uncertainty? Conceptualization and new empirical evidence. European Management Journal, 32(4), 658-671.
[19]. Amabile, T. M. (1983). The social psychology of creativity. New York: Springer-Verlag.
[20]. Amabile, T. M., & Pillemer, J. (2012). Perspectives on the social psychology of creativity. The Journal of Creative Behavior, 46(1), 3-15.
[21]. Condry, J. (1977). Enemies of exploration: Self-initiated versus other-initiated learning. Journal of Personality and Social Psychology, 35(7), 459-477.
[22]. Koestner, R., Ryan, R. M., Bernieri, F., et al. (1984). Setting limits on children's behavior: The differential effects of controlling vs. informational styles on intrinsic motivation and creativity. Journal of Personality, 52(3), 233-248.
[23]. Jiang, W., & Yao, W. (2015). Corporate innovation and executive compensation-performance sensitivity: An empirical study based on state-owned listed companies. Economic Management, 37(05), 63-73.
[24]. Yang, T., Ma, J., & Feng, X. (2017). A review and prospect of the relationship between performance pay and employee creativity. Science & Technology Progress and Policy, 34(15), 154-160.
[25]. Ederer, F., & Manso, G. (2013). Is pay for performance detrimental to innovation? Management Science, 59(7), 1496-1513.
[26]. Manso, G. (2011). Motivating innovation. The Journal of Finance, 66(5), 1823-1860.
[27]. Zhu, D. (2019). The impact of equity incentives on corporate innovation activities under uncertain environments. Economic Management, 41(02), 55-72.
[28]. Li, S., & Hong, W. (2020). Environmental uncertainty, transparency, and corporate innovation. Journal of Industrial Technological Economics, 39(08), 44-52.
[29]. Brouwer, M. (2000). Entrepreneurship and uncertainty: Innovation and competition among the many. Small Business Economics, 15(2), 149-160.
[30]. Han, Q., & Min, Y. (2018). Environmental uncertainty, managerial overconfidence, and R&D investment. Journal of Central South University (Social Science Edition), 24(06), 132-139.
[31]. Zhang, N., Xu, L., Dai, Z., & Li, Y. (2019). Product market competition, intellectual property protection, and corporate innovation investment. Financial Science, (11), 54-66.
[32]. Frenkel, A., Shefer, D., Koschatzky, K., et al. (2001). Firm characteristics, location, and regional innovation: A comparison between Israeli and German industrial firms. Regional Studies, 35(5), 415-429.
[33]. Balkin, D. B., Markman, G. D., & Gomez-Mejia, L. R. (2000). Is CEO pay in high-technology firms related to innovation? Academy of Management Journal, (6), 1118-1129.
[34]. Makri, M., Lane, P. J., & Gomez-Mejia, L. R. (2006). CEO incentives, innovation, and performance in technology-intensive firms: A reconciliation of outcome and behavior-based incentive schemes. Strategic Management Journal, (11), 1057-1080.
[35]. Baum, C. F., Caglayan, M., Stephan, A., et al. (2008). Uncertainty determinants of corporate liquidity. Economic Modelling, 25(5), 833-849.
[36]. Zhai, S., & Bi, X. (2016). Environmental uncertainty, management confidence, and corporate ambidextrous innovation investment. Journal of Zhongnan University of Economics and Law, (05), 91-100+159.
[37]. Chen, L., Lin, P., Song, F., et al. (2011). Managerial incentives, CEO characteristics, and corporate innovation in China’s private sector. Journal of Comparative Economics, 39(2), 176-190.
[38]. Liu, T., Mao, D., & Song, H. (2013). Institutional investors: Choosing governance or intervening governance—An endogenous study based on pay-performance sensitivity. Journal of Shanxi University of Finance and Economics, 35(11), 95-105.
[39]. Yuan, J., Cheng, C., & Hou, Q. (2015). Environmental uncertainty and corporate technological innovation—An empirical study based on Chinese listed companies. Management Review, 27(10), 60-69.
[40]. Liu, J., Luo, F., & Wang, J. (2019). Environmental uncertainty and corporate innovation investment—The moderating role of government subsidies and industry-finance integration. Economic Management, 41(08), 21-39.
[41]. Shen, H. H., Yu, P., & Wu, L. S. (2012). State-owned equity, environmental uncertainty, and investment efficiency. Economic Research Journal, 47(07), 113-126.
[42]. Li, T., & Chen, Q. (2020). Heterogeneous institutional investors, firm nature, and technological innovation. Industrial Technology Economics, 39(03), 30-39.
[43]. Zhang, H. H., & Zhang, L. Y. (2017). The effectiveness of compensation contracts, risk-taking, and corporate governance. Journal of Shanxi University of Finance and Economics, 39(09), 104-114.