


1. Introduction
With the continuous growth of the global and Chinese automobile markets, the automotive manufacturing industry is undergoing unprecedented transformation. In recent years, the Chinese automobile market has shown strong growth momentum, with total vehicle sales in China expected to exceed 32 million units in 2024. Notably, the new energy vehicle (NEV) market is experiencing explosive growth, with annual sales expected to reach over 11.5 million units, and market penetration steadily increasing. This trend not only reflects a strong consumer demand for environmentally friendly and energy-efficient vehicles but also indicates a gradual shift in the automotive manufacturing industry towards electrification, intelligence, and large-scale production [1].
In this context, BYD Company Limited, as a leading company in China’s NEV industry, has drawn considerable attention for its development trajectory and market performance. Since 2019, BYD has achieved rapid growth in its NEV business, and in 2020, it announced a halt to the production of fuel-powered vehicles, fully transitioning to the NEV sector—becoming the first Fortune Global 500 company to make this shift. Through the continuous launch of multiple new energy vehicle models and ongoing innovations in battery technology, intelligent driving, and connected smart networks, BYD has not only strengthened its leadership position in the NEV industry but has also actively expanded its presence in international markets, with its products reaching numerous countries and regions worldwide.
However, the rapid market growth and relentless technological advancements have also introduced unprecedented competitive pressure for BYD and other automotive manufacturers. On one hand, both domestic and international car brands are fiercely competing in the NEV field. Traditional automotive giants such as Volkswagen and Toyota are accelerating their shift towards electrification, while emerging players like Xpeng and Li Auto are swiftly rising with agile mechanisms and innovative products, making the competitive landscape increasingly complex and dynamic. On the other hand, consumer demand for automobile products is becoming increasingly diverse and personalized [2], with higher expectations for quality, performance, and intelligence. These changes undoubtedly present significant challenges to the innovation and market adaptability of automakers like BYD.
Against this backdrop, studying BYD Company Limited's innovation strategies and competitive approaches in the face of electrification and intelligence trends holds significant value for exploring the transformation and development of the automotive manufacturing industry. This paper aims to conduct an in-depth analysis of BYD’s financial statements, predict the company's development prospects, and provide a comprehensive evaluation.
2. I. DuPont Analysis
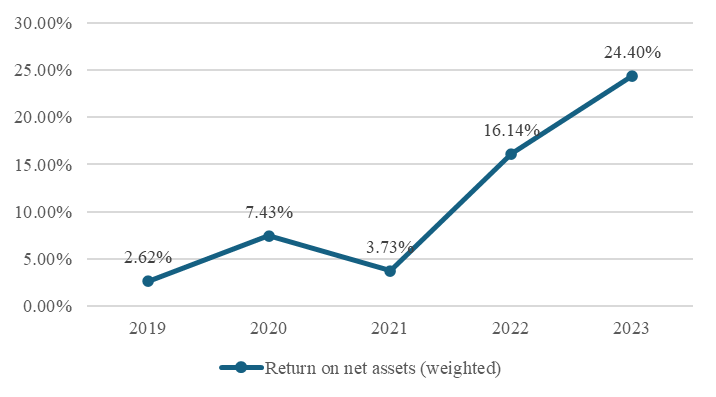
Figure 1. BYD Company Limited Return on Equity (Weighted)
(Data Source: Derived from a third-party securities trading platform (Flush))
The return on equity (ROE) increased significantly from 2.62% in 2019 to 24.40% in 2023, indicating a substantial improvement in BYD's profitability. ROE is a key metric that measures the efficiency with which a company uses shareholders' funds to generate profit, suggesting that BYD has been able to utilize its assets more effectively to deliver higher returns.
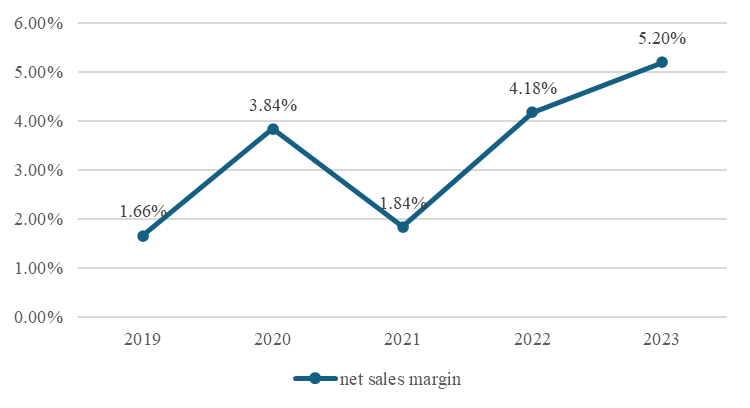
Figure 2. BYD Company Limited Net Profit Margin
(Data Source: Derived from a third-party securities trading platform (Flush))
The net profit margin rose from 1.66% in 2019 to 5.20% in 2023. Although the increase is less significant than that of ROE, it still reflects BYD's progress in cost control and profitability enhancement.
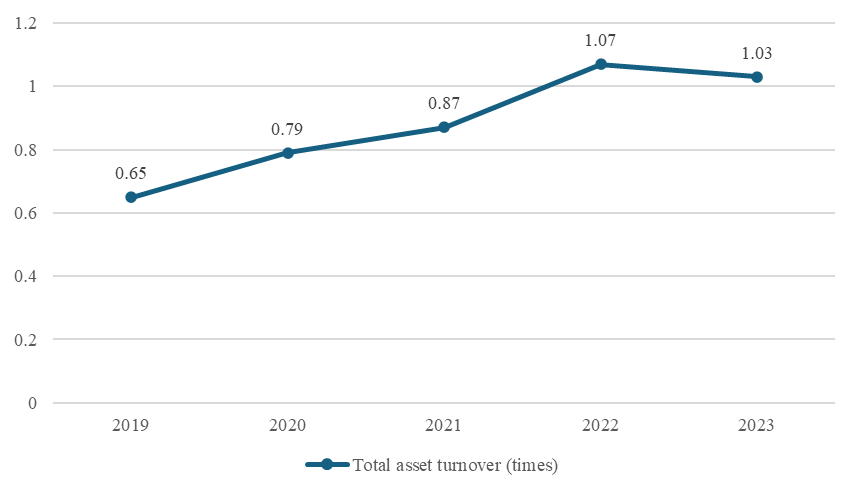
Figure 3. BYD Company Limited Total Asset Turnover
(Data Source: Derived from a third-party securities trading platform (Flush))
The asset turnover ratio increased from 0.65 in 2019 to 1.07 in 2021 but slightly declined to 1.03 in 2023. This indicates that BYD improved its operational efficiency between 2019 and 2021, allowing it to convert its assets into sales revenue more rapidly. However, the slight decline in 2023 might be attributed to market conditions or supply chain challenges.
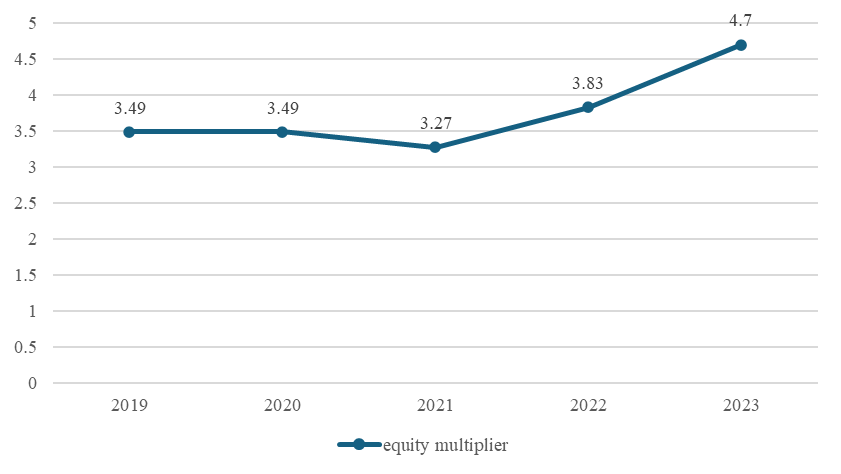
Figure 4. BYD Company Limited Equity Multiplier
Data Source: Derived from a third-party securities trading platform (Flush)
The equity multiplier rose from 3.49 in 2019 to 4.70 in 2023, showing an increase in BYD’s financial leverage. The equity multiplier, which is the ratio of total assets to shareholders' equity, reflects the extent to which a company is financed by debt. A higher equity multiplier indicates that the company has utilized more debt to expand its asset base, which may increase financial risk but can also potentially boost ROE.
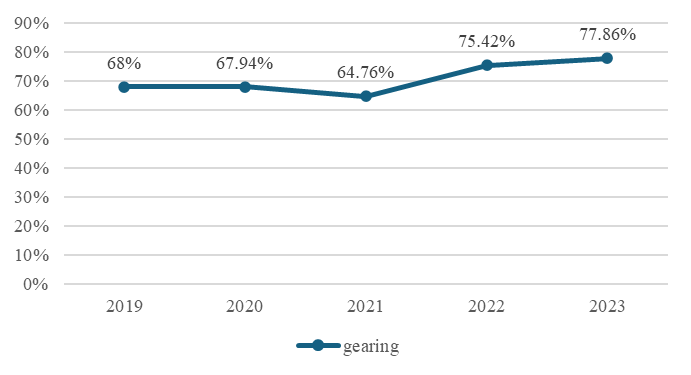
Figure 5. BYD Company Limited Debt-to-Asset Ratio
(Data Source: Derived from a third-party securities trading platform (Flush))
BYD’s debt-to-asset ratio saw a slight decline from 2019 to 2021, followed by an increase from 2021 to 2023. This fluctuation reflects the company’s adjustment of its financial structure in response to market conditions and its strategic needs. It also indicates that debt financing holds a considerable share of the capital structure, with this ratio fluctuating between 64% and 78%. A high debt-to-asset ratio means that the company has raised a significant amount of funds through borrowing to support its operations and expansion plans. However, a high debt ratio also entails greater financial risk, as the company must cover higher interest expenses and faces increased repayment pressures during unfavorable economic conditions.
3. Analysis of Profitability Quality
3.1. Revenue Quality Analysis
Table 1. Cash-to-Revenue Ratio for BYD Company Limited
Unit: 100 million CNY
Item | 2019 | 2020 | 2021 | 2022 | 2023 |
Cash Received from Sales and Services | 1,071.66 | 1,386.67 | 2,026.66 | 4,132.09 | 5,727.05 |
Revenue | 1277.39 | 1565.98 | 2161.42 | 4240.6 | 6023.15 |
Cash-to-Revenue Ratio | 0.838945 | 0.885497 | 0.937652 | 0.974412 | 0.95084 |
Data Source: Annual Reports
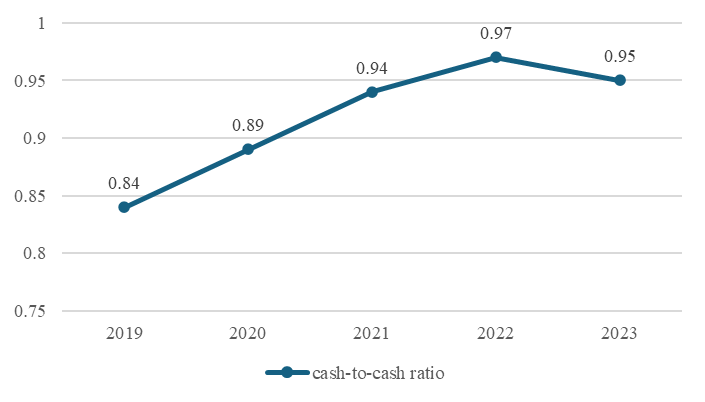
Figure 6. Cash-to-Revenue Ratio of BYD Company Limited
From 0.84 in 2019 to 0.97 in 2022, BYD’s cash-to-revenue ratio has steadily increased, indicating an improved ability to convert operating income into cash inflows. This suggests that the company’s collection policies have become more effective, accounts receivable management is well-executed, or that market demand for its products and services is strong, enabling swift recovery of sales revenue.
A cash-to-revenue ratio closer to 1 signifies that almost all of the company's operating revenue is collected in cash, representing exceptionally high revenue quality. BYD reached 0.97 in 2022, very close to this ideal, demonstrating strong cash flow generation and effective financial management.
Although the cash-to-revenue ratio slightly declined to 0.95 in 2023, this may be due to various factors, such as changes in market conditions, supply chain adjustments, or modifications in sales strategy. If this decline is temporary and the company can implement effective adjustments, its revenue quality can still be maintained at a high level.
In conclusion, BYD’s revenue quality is continuously improving and remains at a high level.
3.2. Profit Quality Analysis
Table 2. Cash Profit Ratio of BYD Company Limited
Unit: 100 million CNY
Item | 2019 | 2020 | 2021 | 2022 | 2023 |
Net Cash Flow from Operating Activities | 147.41 | 453.93 | 654.67 | 1,408.38 | 1,697.25 |
Net Profit | 21.19 | 60.14 | 39.67 | 177.13 | 313.44 |
Cash Profit Ratio | 6.956583 | 7.547888 | 16.5029 | 7.951109 | 5.414912 |
Data Source: Annual Reports
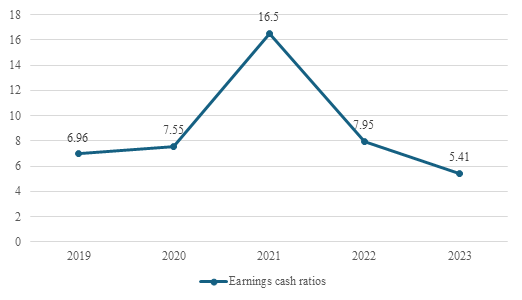
Figure 7. Cash Profit Ratio of BYD Company Limited
The cash profit ratio of BYD has shown significant fluctuations over the past five years. It rose from 6.96 times in 2019 to 16.5 times in 2021, reflecting a substantial improvement in profit quality during these years, possibly due to the rapid growth in the new energy vehicle market and the strong demand for the company's products. However, this ratio declined in 2022 and 2023, which may have been influenced by various factors, such as changes in the market environment, rising costs, and increased investments.
Thus, while BYD’s profit quality has shown significant fluctuations over the past five years, the overall trend indicates growth in net profit and net cash flow from operating activities, highlighting the company’s strong profitability and cash flow management capabilities.
3.3. R&D Expense Ratio
Table 3. R&D Expense Ratio of BYD Company Limited
Unit: 10,000 CNY
Item | 2019 | 2020 | 2021 | 2022 | 2023 |
R&D Expenses | 562,937.20 | 746,486.10 | 799,097.40 | 1,865,445.30 | 3,957,494.50 |
Revenue | 12,773,852.30 | 15,659,769.10 | 21,614,239.50 | 42,406,063.50 | 60,231,535.40 |
R&D Expense Ratio | 0.044069493 | 0.047669036 | 0.036970877 | 0.043990061 | 0.065704692 |
Data Source: Annual Reports
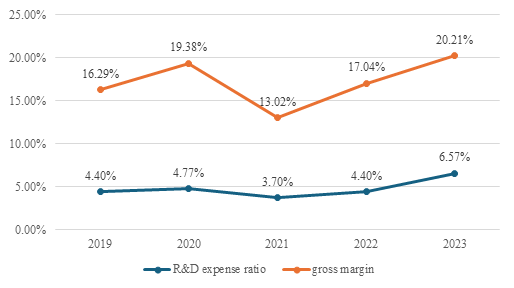
Figure 8. Relationship Between R&D Expense Ratio and Gross Profit Margin
Both BYD's R&D expense ratio and gross profit margin have shown some fluctuations over the five-year period. The R&D expense ratio remained relatively stable from 2019 to 2021 but declined in 2022 before significantly rising to 6.57% in 2023. Meanwhile, the gross profit margin also experienced similar fluctuations, increasing from 16.29% in 2019 to 20.21% in 2023. Thus, there is a positive correlation between R&D expenses and gross profit margin. Although the R&D expense ratio and gross profit margin fluctuated in certain years, they generally exhibited an upward trend.
The substantial increase in the R&D expense ratio from 2022 to 2023, accompanied by a significant rise in the gross profit margin, suggests that BYD has successfully transformed its increased R&D investment into higher product value and profitability. This indicates a clear impact of technological differentiation. Through continuous technological innovation and product upgrades, BYD has been able to launch more competitive products that meet diverse consumer demands, enabling it to achieve a higher premium in the market.
3.4. Sales Expense Ratio
Table 4. Sales Expense Ratio of BYD Company Limited
Unit: 10,000 CNY
Item | 2019 | 2020 | 2021 | 2022 | 2023 |
Sales Expenses | 434,589.70 | 505,561.30 | 608,167.80 | 1,506,067.60 | 2,521,139.50 |
Revenue | 12,773,852.30 | 15,659,769.10 | 21,614,239.50 | 42,406,063.50 | 60,231,535.40 |
Sales Expense Ratio | 0.03402182 | 0.032284084 | 0.028137367 | 0.035515383 | 0.041857467 |
Data Source: Annual Reports
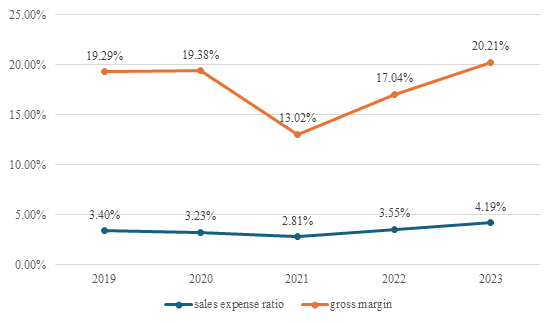
Figure 9. Relationship Between Sales Expense Ratio and Gross Profit Margin
From 3.40% in 2019 to 4.19% in 2023, BYD's sales expense ratio has shown an overall upward trend, with a particularly noticeable increase from 2022 to 2023. This may indicate that the company has been increasing its investments in marketing, sales channel expansion, or customer service. Meanwhile, the gross profit margin fluctuated between 16.29% and 20.21%, experiencing significant variation, especially with a marked decline in 2021, but generally trending upwards.
4. Asset Quality Analysis
4.1. Overall Asset Status
Table 5. Five-Year Asset Composition of BYD Company Limited
Unit: 100 million CNY
Item | 2019 | 2020 | 2021 | 2022 | 2023 | Average |
Monetary Funds | 126.50 | 144.45 | 504.57 | 514.71 | 1,090.94 | 476.234 |
Trading Financial Assets | 0.34 | 0.00 | 56.06 | 206.27 | 95.63 | 71.66 |
Notes and Accounts Receivable | 439.34 | 412.16 | 362.51 | 388.28 | 618.66 | 444.19 |
Receivables Financing | 70.09 | 88.62 | 87.43 | 128.94 | 55.65 | 86.146 |
Prepayments | 3.63 | 7.24 | 20.37 | 82.24 | 22.15 | 27.126 |
Other Receivables | 15.61 | 10.51 | 14.11 | 19.10 | 27.58 | 17.382 |
Contract Assets | 69.87 | 53.46 | 84.93 | 135.53 | 26.60 | 74.078 |
Inventory | 255.72 | 313.96 | 433.55 | 791.07 | 876.77 | 534.214 |
Current Portion of Non-current Assets | 10.61 | 12.51 | 12.32 | -- | -- | 7.088 |
Other Current Assets | 77.96 | 73.13 | 85.25 | 131.36 | 132.15 | 99.97 |
Long-term Receivables | 12.40 | 18.05 | 11.70 | 11.19 | 82.38 | 27.144 |
Long-term Equity Investments | 40.60 | 54.66 | 79.05 | 154.85 | 176.47 | 101.126 |
Other Equity Instrument Investments | 19.22 | 14.20 | 29.14 | 44.19 | 53.27 | 32.004 |
Other Non-current Financial Assets | 0.47 | 2.85 | 2.34 | 21.47 | 26.96 | 10.818 |
Investment Property | 0.97 | 0.94 | 0.88 | 0.85 | 0.83 | 0.894 |
Fixed Assets | 494.43 | 545.85 | 612.21 | 1,318.80 | 2,309.04 | 1,056.066 |
Construction in Progress | 106.75 | 61.12 | 202.77 | 446.22 | 347.26 | 232.824 |
Right-of-use Assets | 7.30 | 9.46 | 15.73 | 31.37 | 96.79 | 32.13 |
Intangible Assets | 126.50 | 118.04 | 171.05 | 232.23 | 372.36 | 204.036 |
Development Expenditures | 57.48 | 48.86 | 26.05 | 16.83 | 5.41 | 30.926 |
Goodwill | 0.66 | 0.66 | 0.66 | 0.66 | 44.28 | 9.384 |
Long-term Deferred Expenses | 1.32 | 0.67 | 0.77 | 4.58 | 40.63 | 9.594 |
Deferred Tax Assets | 15.15 | 17.69 | 19.13 | 36.87 | 65.84 | 30.936 |
Other Non-current Assets | 3.49 | 1.08 | 125.21 | 210.45 | 152.74 | 98.594 |
Total Assets | 1,956.42 | 2,010.17 | 2,957.80 | 4,938.61 | 6,795.48 | 3731.696 |
Data Source: Annual Reports
As shown in the table, a substantial proportion of BYD Company Limited's total assets consists of monetary funds, notes and accounts receivable, inventory, fixed assets, and intangible assets.
4.2. Analysis of the Quality of Monetary Funds
Table 6. Cash Holdings Ratio of BYD Company Limited
Unit: 100 million CNY
Item | 2019 | 2020 | 2021 | 2022 | 2023 |
Cash Turnover Days (days) | 138.49 | 85.70 | 24.88 | -14.76 | -32.87 |
Total Cash Outflow from Operating Activities | 989.81 | 1,033.29 | 1,479.52 | 3,005.42 | 4,420.93 |
Cash Holdings | 380.77 | 245.98 | 102.25 | -- | -- |
Average Monetary Funds | 476.234 | 476.234 | 476.234 | 476.234 | 476.234 |
Cash Holdings / Average Monetary Funds (%) | 80% | 51.65% | 21.47% | -- | -- |
Data Source: Annual Reports
BYD’s cash holdings ratio has shown a declining trend. In 2019, the cash holdings ratio was as high as 80%, indicating that the company had a relatively low share of monetary funds, which could have posed a liquidity risk due to insufficient cash holdings. In 2020, the ratio decreased to 51.65%, suggesting a moderate level of cash holdings. This balance allowed the company to meet its operational cash needs and maintain a slight surplus for speculative purposes. However, in 2021, the cash holdings ratio declined further to 21.47%, resulting in excess cash that may not have been fully utilized for speculative needs, indicating an abundance of idle funds.
As a leading company in the new energy vehicle industry, BYD requires substantial financial support for its daily operations. Maintaining a high level of cash holdings is beneficial for ensuring liquidity and meeting the funding needs of day-to-day operations. Additionally, it is crucial to maintain a cash reserve to mitigate potential market risks and uncertainties. The data shows that BYD’s cash holdings are sufficient, enhancing its capability to respond to market changes. With BYD’s plans for large-scale expansion in 2023, maintaining a high level of cash holdings will support these activities. Therefore, the proportion of monetary funds within total current assets is reasonable.
4.3. Analysis of the Quality of Receivables
Table 7. Provision Rates for Bad Debts on Accounts Receivable of BYD Company Limited
Aging | Provision Rate for Accounts Receivable (%) |
Within 1 year | 1.30 |
1-2 years | 4.84 |
2-3 years | 6.79 |
3-4 years | 8.42 |
4-5 years | 43.12 |
Over 5 years | 100.00 |
Data Source: Annual Reports and third-party securities trading platform (Flush)
The provision rate for receivables within 1 year is 1.30%, indicating that the company perceives low risk in collecting short-term receivables. The rate increases to 4.84% for receivables aged 1-2 years, reflecting a higher collection risk with age. For receivables aged 2-3 years, the provision rate rises to 6.79%, further indicating potential risk in collecting these older receivables. For receivables aged 3-4 years, the rate reaches 8.42%, demonstrating a more cautious approach for these longer-aged accounts. The rate for receivables aged 4-5 years jumps significantly to 43.12%, highlighting substantial concern and uncertainty regarding collection. For receivables over 5 years, the provision rate is set at 100%, suggesting that the company expects almost no recoverability, thus fully provisioning for these accounts as bad debts.
Table 8. Aging Details of Accounts Receivable for BYD Company Limited
Unit: 10,000 CNY
Year | Within 1 Year | 1-2 Years | 2-3 Years | 3-4 Years | 4-5 Years | Over 5 Years |
2019 | 3,234,258.90 | 925,673.40 | 173,100.20 | 68,821.40 | 1,367.60 | 1,069.20 |
2020 | 2,498,693.50 | 1,167,711.80 | 365,714.80 | 80,439.20 | ||
2021 | 2,159,777.80 | 815,142.60 | 501,735.60 | 186,172.70 | 22,031.40 | 7,950.10 |
2022 | 2,791,592.50 | 612,123.60 | 381,027.70 | 140,341.20 | 100,924.10 | 29,964.30 |
2023 | 5,571,711.90 | 206,278.40 | 307,463.30 | 190,509.80 | 50,300.70 | 116,554.50 |
Data Source: Annual Reports and third-party securities trading platform (Flush)
Table 9 Aging and Bad Debt Analysis of Accounts Receivable for BYD Company Limited in 2023
Unit: 10,000 CNY
Item | Within 1 Year | 1-2 Years | 2-3 Years | 3-4 Years | 4-5 Years | Over 5 Years |
Accounts Receivable Balance | 5,571,711.90 | 206,278.40 | 307,463.30 | 190,509.80 | 50,300.70 | 116,554.50 |
Bad Debt Provision Rate (%) | 1.3 | 4.84 | 6.79 | 8.42 | 43.12 | 100 |
Bad Debt Provision | 72,664.20 | 9,986.10 | 20,890.00 | 16,037.40 | 21,691.50 | 116,554.50 |
Net Accounts Receivable | 5,499,047.7 | 196,292.3 | 286,573.3 | 174,472.4 | 28,609.2 | 0.0 |
Data Source: Annual Reports and third-party securities trading platform (Flush)
Short-term receivables (within 1 year) carry a low collection risk, reflecting high quality. In the 1-2 years category, the provision rate for bad debts is 4.84%, which is relatively low and suggests a high likelihood of collection, though some allowance for bad debts has been made, indicating a certain level of risk. As receivables age, the provision rate rises to 6.79% for 2-3 years, indicating increased difficulty in collection, though still within a manageable level. At the 3-4 years mark and beyond, the bad debt provision rate increases significantly, especially for receivables over 5 years, where almost all are fully provisioned, indicating a high collection risk and lower quality.
The aging analysis method clearly shows that the quality of accounts receivable declines as the aging period increases. Short-term receivables are of higher quality, while long-term receivables carry a higher risk of bad debt.
4.4. Analysis of the Quality of Inventory
Table 10. Composition of Inventory for BYD Company Limited
Unit: 10,000 CNY
Item | 2019 | 2020 | 2021 | 2022 | 2023 |
Finished Goods | 1,025,962.50 | 1,698,056.30 | 1,861,691.40 | 3,279,593.30 | 4,118,376.10 |
Work in Progress | 1,101,956.20 | 1,005,284.20 | 1,446,702.70 | 2,696,761.90 | 3,052,042.80 |
Raw Materials | 368,053.60 | 426,805.10 | 919,097.70 | 1,746,276.60 | 1,539,580.90 |
Consumables | 106,330.40 | 83,048.60 | 223,454.70 | 326,703.50 | 393,074.50 |
Total Inventory | 2,602,302.70 | 3,213,194.20 | 4,450,946.50 | 8,049,335.30 | 9,103,074.30 |
The value of finished goods increased from 1,025,962.50 ten thousand CNY in 2019 to 4,118,376.10 ten thousand CNY in 2023, indicating a substantial rise in product inventory. This could be a result of increased market demand or an accumulation of unsold products following capacity expansion. High inventory levels of finished goods may tie up significant capital, increasing financial costs, but also reflect the company's optimistic outlook on future market demand. The value of work-in-progress (WIP) fluctuated from 1,101,956.20 ten thousand CNY in 2019 to 3,052,042.80 ten thousand CNY in 2023. This suggests that the company maintains a certain level of WIP to support continuous production and quickly respond to market changes. The value of raw materials rose from 368,053.60 ten thousand CNY in 2019 to 1,746,276.60 ten thousand CNY in 2022, then slightly declined to 1,539,580.90 ten thousand CNY in 2023. This indicates the company's strong flexibility and adaptability in procurement, adjusting its purchasing strategy in response to market changes. However, high raw material levels may carry risks associated with market price fluctuations and rising storage costs. The value of consumables varied significantly, though efficient utilization of these materials is critical for improving production efficiency and reducing costs.
Table 11. Inventory Write-down Provisions for BYD Company Limited in 2023
Unit: 10,000 CNY
Item | Opening Balance | Current Year Provision | Reduction | Ending Balance | Item | Opening Balance | Current Year Provision |
Finished Goods | 1,002,252 | 1,569,325 | (100,276) | 2,471,301 | Finished Goods | 1,002,252 | 1,569,325 |
Work in Progress | 155,347 | 185,525 | (56,445) | 284,427 | Work in Progress | 155,347 | 185,525 |
Raw Materials | 204,714 | 488,384 | (109,548) | 583,550 | Raw Materials | 204,714 | 488,384 |
Consumables | 23,841 | 9,663 | (18,787) | 14,717 | Consumables | 23,841 | 9,663 |
Total | 1,386,154 | 2,252,897 | (285,056) | 3,353,995 | Total | 1,386,154 | 2,252,897 |
Data Source: Annual Reports
The provision for inventory write-downs for finished goods increased from an opening balance of 1,002,252 ten thousand CNY to 2,471,301 ten thousand CNY by year-end, representing an approximately 1.5-fold increase. This indicates that the company has made substantial provisions for the risk of inventory devaluation, reflecting its sensitivity and caution regarding market changes. Inventory write-down provisions for work in progress, raw materials, and consumables also increased to varying extents, showing the company’s prudent approach in overall inventory management.
4.5. Analysis of the Quality of Fixed Assets
Table 12. Depreciation Policy for Fixed Assets of BYD Company Limited
Asset Category | Estimated Useful Life (years) | Residual Value Rate (%) | Annual Depreciation Rate (%) | Depreciation Method |
Buildings and Structures | 5-70 | 0%-5% | 1.4%-20.0% | Straight-line method |
Machinery and Equipment | 3-12 | 0%-5% | 7.9%-33.3% | Straight-line method |
Transportation Equipment | 3-5 | 0%-5% | 19.0%-33.3% | Straight-line method |
Office and Other Equipment | 10 or less | 0%-5% | 9.5% or above | Straight-line method |
Data Source: Annual Reports
Table 13. Basic Information on Fixed Assets of BYD Company Limited
Unit: 10,000 CNY
Item | 2019 | 2020 | 2021 | 2022 | 2023 |
Original Value of Fixed Assets | 8,960,243.40 | 10,070,333.40 | 11,246,164.00 | 19,403,465.00 | 32,507,401.00 |
Accumulated Depreciation | 3,954,992.20 | 4,554,160.70 | 5,112,085.80 | 6,203,494.80 | 9,405,682.00 |
Net Value of Fixed Assets | 5,005,251.20 | 5,516,172.70 | 6,134,078.20 | 13,199,970.20 | 23,101,719.00 |
Net Value as a Percentage of Total Assets | 25.58% | 27.44% | 20.74% | 26.73% | 34.00% |
Data Source: Third-party securities trading platform (Flush)
The original value of BYD’s fixed assets has shown a significant upward trend over the past few years, rising from 8,960,243.40 ten thousand CNY in 2019 to 32,507,401.00 ten thousand CNY in 2023. This indicates the company's active investment in expanding production capacity and enhancing technological capabilities.
Table 14. Changes in Fixed Assets of BYD Company Limited
Unit: 10,000 CNY
Item | 2019 | 2020 | 2021 | 2022 | 2023 |
Beginning Balance of Fixed Assets | 7,756,236.40 | 8,960,243.40 | 10,070,333.40 | 11,246,164.00 | 19,403,465.00 |
Ending Balance of Fixed Assets | 8,960,243.40 | 10,070,333.40 | 11,246,164.00 | 19,403,465.00 | 32,507,401.00 |
Fixed Asset Renewal Rate | 15.52% | 12.39% | 11.68% | 72.53% | 67.53% |
Data Source: Third-party securities trading platform (Flush)
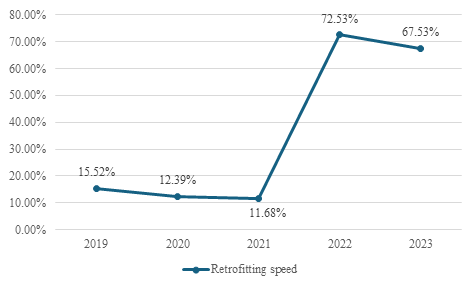
Figure 10. Fixed Asset Renewal Rate of BYD Company Limited
The renewal rate of BYD’s fixed assets has fluctuated over the years. In 2022, the renewal rate reached 72.53%, significantly higher than in previous years, reflecting high investment in technological innovation and equipment upgrades. This investment supports improved production efficiency and product quality. However, a high renewal rate can also exert pressure on capital, necessitating careful planning for optimal use of funds.
In summary, the quality of BYD’s fixed assets is generally high. The company has shown considerable initiative in fixed asset investment, maintaining a continuous growth in asset scale while enhancing asset quality through ongoing technological innovation and equipment upgrades.
4.6. Analysis of the Quality of Intangible Assets
Table 15. Amortization Policy for Intangible Assets of BYD Company Limited
Category | Useful Life | Basis for Determination | Amortization Method |
Land Use Rights | 30-99 years | Duration of land use rights | Straight-line method |
Industrial Property and Proprietary Technology | 2-10 years | Shorter of patent duration or estimated useful life | Straight-line method |
Non-Patent Technology and Software | 1-5 years | Shorter of non-patent technology or software useful life | Straight-line method |
Customer Relationships | 5 years | Estimated benefit period of customer relationships | Straight-line method |
Data Source: Annual Reports
Table 16. Basic Information on Intangible Assets of BYD Company Limited
Unit: 10,000 CNY
Item | 2019 | 2020 | 2021 | 2022 | 2023 |
Patent Technology | 1,359,871.30 | 1,544,739.70 | 2,009,860.50 | 2,227,289.30 | 2,334,231.40 |
Non-Patent Technology | 85,389.30 | 103,469.10 | 116,567.60 | -- | -- |
Land Use Rights | 766,884.40 | 789,779.60 | 1,112,222.20 | 1,976,663.40 | 3,103,449.80 |
Others | -- | -- | -- | 160,869.30 | 702,170.50 |
Total | 2,212,145.00 | 2,437,988.40 | 3,238,650.30 | 4,364,822.00 | 6,139,851.70 |
Intangible Assets as a Percentage of Total Assets | 11.31% | 12.13% | 10.95% | 8.84% | 9.04% |
Data Source: Annual Reports and third-party securities trading platform (Flush)
The table shows a steady growth trend in the total intangible assets of the company in recent years. The increase is particularly significant in patent and non-patent technology assets, indicating BYD’s continued investment in research and development and innovation, which further strengthens its technological advantage and market position.
In summary, the quality of BYD’s intangible assets is high, reflecting strong technological innovation capabilities and significant market influence. The company’s amortization methods and reasonable amortization periods scientifically represent the consumption of intangible asset value over time, providing investors and stakeholders with reliable financial information.
5. Analysis of Cash Flow Quality
5.1. Adequacy of Cash Flow from Operating Activities
Table 17. Net Cash Flow from Operating Activities of BYD Company Limited
Unit: 100 million CNY
Item | 2019 | 2020 | 2021 | 2022 | 2023 |
Net Cash Flow from Operating Activities | 147.41 | 453.93 | 654.67 | 1,408.38 | 1,697.25 |
Data Source: Annual Reports
The net cash flow from operating activities of BYD from 2019 to 2023 shows a significant growth trend, indicating that BYD’s operating activities have been generating strong cash flows. This suggests that the funds from the daily sales of goods and services are sufficient to cover routine operational expenses, with an increasingly abundant cash flow position.
5.2. Reasonableness of Cash Flow from Operating Activities
5.2.1. Smoothness of Cash Inflows
Table 18. Changes in Cash Inflows from Operating Activities of BYD Company Limited in 2023
Unit: 100 million CNY
Item | Beginning Balance | Ending Balance | Increase | Growth Rate (%) |
Operating Revenue | 42,406.06 | 60,231.54 | 17,825.47 | 42.04 |
Accounts Receivable and Notes Receivable | 388.28 | 618.66 | 230.4 | 59.33 |
Contract Liabilities | 355.17 | 346.99 | -8.2 | -2.3 |
Cash Received from Sales of Goods and Services | 4,132.09 | 5,727.05 | 1,595.0 | 38.6 |
Data Source: Annual Reports
The increase in accounts receivable and notes receivable exceeds the growth in operating revenue, and the cash increase rate is lower than that of operating revenue. This indicates that the increase in operating revenue may primarily come from credit sales, with a slower collection of accounts receivable, leading to less smooth cash inflows.
5.2.2. Adaptability of Cash Outflows
Table 19. Changes in Cash Outflows from Operating Activities of BYD Company Limited in 2023
Unit: 100 million CNY
Item | Beginning Balance | Ending Balance | Increase | Growth Rate (%) |
Operating Costs | 40,118.73 | 56,768.11 | 16,649.38 | 41.5 |
Trade Payables | 372.47 | 529.08 | 156.62 | 42.05 |
Inventory | 791.07 | 876.77 | 85.7 | 10.83 |
Prepayments | 82.24 | 22.15 | -60.1 | -73.07 |
Cash Paid for Goods and Services | 2,208.43 | 3,134.33 | 925.9 | 41.93 |
Data Source: Annual Reports
The increase in operating costs is due to an increase in inventory purchases, which in turn is attributed to the increase in trade payables. The decrease in monetary funds combined with a reduction in prepayments suggests that the increase in trade payables outpaced the increase in inventory, indicating that most of the inventory increase has not yet been paid for, and actual cash payments were low. This indicates no excessive cash outflow, suggesting appropriate cash outflow management in operating activities.
5.3. Stability of Cash Flow from Operating Activities
Table 20. Changes in Net Cash Flow from Operating Activities of BYD Company Limited
Unit: 100 million CNY
Year | Beginning Balance | Ending Balance | Increase | Growth Rate (%) |
2019 | 125.23 | 147.41 | 22.2 | 17.71% |
2020 | 147.41 | 453.93 | 306.5 | 207.94% |
2021 | 453.93 | 654.67 | 200.7 | 44.22% |
2022 | 654.67 | 1,408.38 | 753.7 | 115.13% |
2023 | 1,408.38 | 1,697.25 | 288.9 | 20.51% |
Data Source: Annual Reports and third-party securities trading platform (Flush)
The net cash flow from operating activities of BYD has shown a steady upward trend over the past few years, indicating good stability. Although growth rates have fluctuated significantly between years, overall, BYD’s net cash flow from operating activities has consistently remained positive, reflecting strong cash generation capability from its operating activities.
5.4. Strategic Alignment of Cash Outflows from Investing Activities
Table 21. Cash Flow from Investing Activities of BYD Company Limited (Internal Investments)
Unit: 100 million CNY
Item | 2019 | 2020 | 2021 | 2022 | 2023 |
Cash Received from Disposal of Fixed Assets, Intangible Assets, and Other Long-term Assets | 4.13 | 2.59 | 8.26 | 2.68 | 4.71 |
Cash Paid for Purchase of Fixed Assets, Intangible Assets, and Other Long-term Assets | 206.27 | 117.74 | 373.44 | 974.57 | 1,220.94 |
Data Source: Annual Reports
BYD’s cash outflows for the purchase of fixed assets, intangible assets, and other long-term assets have increased year by year, especially from 2020 to 2023, where this figure rose significantly. This indicates that BYD is intensifying its internal investments to expand production capacity and improve technological capabilities in response to growing market demand.
Table 22. Cash Flow from Investing Activities of BYD Company Limited (External Investments)
Unit: 100 million CNY
Item | 2019 | 2020 | 2021 | 2022 | 2023 |
Net Cash Received from Disposal of Subsidiaries and Other Business Units | -0.06 | 0.98 | 2.22 | -- | 0.74 |
Net Cash Paid for Acquisition of Subsidiaries and Other Business Units | -- | -- | -- | -- | 140.78 |
Data Source: Annual Reports
The net cash paid for acquisitions of subsidiaries and other business units has increased, indicating that BYD is expanding its business scope and market influence through mergers and acquisitions.
Overall, BYD’s expansion strategy emphasizes both internal improvement and external growth, complementing each other to drive the company’s rapid development. Therefore, BYD’s expansion strategy exhibits a high degree of alignment, contributing to the company’s sustained and healthy growth.
5.5. Analysis of the Adaptability of Cash Flow from Financing Activities with the Combined Cash Flow from Operating and Investing Activities
Table 23. Cash Flow Statement of BYD Company Limited
Unit: 100 million CNY
Item | 2019 | 2020 | 2021 | 2022 | 2023 |
Net Cash Flow from Operating Activities | 147.41 | 453.93 | 654.67 | 1,408.38 | 1,697.25 |
Net Cash Flow from Investing Activities | -208.81 | -144.44 | -454.04 | -1,205.96 | -1,256.64 |
Cash Received from Absorbing Investments | 0.02 | 28.00 | 373.14 | 5.08 | 0.98 |
Cash Received from Borrowings | 584.78 | 406.34 | 328.72 | 276.36 | 453.04 |
Cash Received from Bond Issuance | 200.00 | 20.00 | -- | -- | -- |
Cash Inflows from Financing Activities | 797.96 | 454.34 | 701.86 | 311.75 | 454.30 |
Cash Paid for Debt Repayment | 685.99 | 671.24 | 498.79 | 440.49 | 272.31 |
Cash Paid for Dividends, Profits, or Interest | 43.89 | 36.86 | 26.19 | 16.33 | 41.02 |
Cash Outflows from Financing Activities | 731.86 | 743.41 | 541.24 | 506.64 | 326.13 |
Net Cash Flow from Financing Activities | 66.10 | -289.07 | 160.63 | -194.89 | 128.17 |
Net Cash Flow from Operating Activities + Net Cash Flow from Investing Activities - Cash Outflows from Financing Activities | -793.26 | -433.92 | -340.61 | -304.22 | 114.48 |
Net Increase in Cash and Cash Equivalents | 4.7 | 20.42 | 361.25 | 7.53 | 568.78 |
Data Source: Annual Reports
BYD is in a growth phase. For the years 2019-2022, the metric "Net Cash Flow from Operating Activities + Net Cash Flow from Investing Activities - Cash Outflows from Financing Activities" was less than zero, indicating that the cash flow generated by the company's operating and investing activities was insufficient to meet its financing needs. Consequently, the company had to raise external funds to cover this deficit, representing the total amount required from external financing. In 2023, however, "Net Cash Flow from Operating Activities + Net Cash Flow from Investing Activities - Cash Outflows from Financing Activities" became positive, indicating that the cash flow generated by operating and investing activities was sufficient to cover financing needs, enabling the company to achieve self-sufficiency without requiring external funding.
During 2019-2022, even though the company needed external funding, the net increase in cash and cash equivalents remained positive in some years. This demonstrates that the company was still able to maintain some cash inflows through financing activities and other means, thus meeting its funding requirements for operational and investment activities. By 2023, as cash flows from operating and investing activities increased, the net increase in cash and cash equivalents reached 568.78, further indicating a significant improvement in the company’s cash flow and financial stability.
In summary, BYD required external funding to meet its cash needs from 2019 to 2022, but achieved self-sufficiency in 2023, eliminating the need for external financing. Additionally, the net increase in cash and cash equivalents showed a rising trend, indicating ongoing improvements in the company’s cash flow. The adaptability of cash flows from financing activities with the combined cash flows from operating and investing activities has also gradually improved.
6. Forecast of Company Development Prospects
6.1. Continued Expansion of New Energy Vehicle Market Share
With the growing global awareness of environmental protection and ongoing advancements in new energy vehicle (NEV) technology, the NEV market is experiencing explosive growth. As a leading company in the NEV sector, BYD stands to benefit directly from this market expansion. Therefore, it is forecasted that BYD’s share in the NEV market will continue to grow, contributing to stable sales and revenue growth.
6.2. Driven by Technological Innovation and Product Development
BYD has been at the forefront of technological innovation and product development in the NEV field. The company consistently introduces competitive new products and optimizes the performance and quality of its existing products. This continuous technological innovation and product development will enhance BYD’s market competitiveness and lay a solid foundation for its future growth.
6.3. Dual Market Drivers: Domestic and International
BYD has achieved remarkable success in both domestic and international markets. In the domestic market, BYD commands a substantial share due to its brand influence and product advantages. Simultaneously, the company is actively expanding in overseas markets by establishing production bases and collaborating with local companies, thereby strengthening its competitiveness abroad [3]. This dual driver of domestic and international markets will provide BYD with more opportunities and momentum for future development.
6.4. Financial Stability
Analyzing BYD’s financial performance, the company demonstrates strong competitiveness in profitability, operational efficiency, financial leverage, profit quality, asset quality, and cash flow. Both operating revenue and net profit have shown steady growth. Although BYD’s debt-to-asset ratio is relatively high, most of it consists of operational liabilities, and the company has a substantial net cash flow from operating activities, indicating a strong debt repayment capability and financial stability. This financial stability will provide robust support for BYD’s future growth.
6.5. Supportive Policies
Numerous countries and regions worldwide are actively promoting NEVs and have implemented a range of supportive policies [4]. These policies will offer more development opportunities and market space for NEV companies like BYD. BYD will leverage these policy advantages to accelerate its NEV research, development, and marketing efforts, further consolidating its leadership position in the NEV sector.
In conclusion, due to its leading position in the NEV sector, the drive from technological innovation and product development, dual domestic and international market drivers, financial stability, clear strategic direction, and supportive policies, BYD’s future development prospects are highly promising. However, it is also essential to remain aware of the intensity of market competition and uncertainties. BYD must maintain sharp market insights and flexible operational strategies to address potential risks and challenges.
7. Comprehensive Evaluation
7.1. Brand Value
BYD demonstrates exceptional brand value [5], which is not only reflected in its large market scale and leading position but also in its rich brand heritage and ongoing innovation. As a leading company in the NEV industry, BYD has built a strong brand image through continuous technological innovation and product upgrades, earning widespread acclaim from global consumers.
7.2. Brand Influence
BYD’s influence in the global market continues to expand. In 2023, its overseas sales of new energy passenger vehicles exceeded 240,000 units [7], a year-on-year increase of 337%, making it the most exported Chinese NEV brand. This achievement not only underscores BYD's strong competitiveness in overseas markets but also reflects the successful implementation of its internationalization strategy.
7.3. Financial Status
BYD’s financial status is not only stable but also shows significant resilience and growth potential. Despite a relatively high debt-to-asset ratio, the company has ensured a stable financial structure through efficient fund management and asset operations, laying a solid foundation for long-term development. Additionally, BYD has excelled in cash flow management, with adequate operating cash flow providing robust support for navigating market fluctuations and seizing investment opportunities.
7.4. Operational Performance
In terms of operational performance, BYD has shown strong growth momentum. The rapid development of its NEV business has become the primary driver of performance growth, securing a leading position in the domestic market and achieving significant breakthroughs in international markets. Through continuous technological innovation and product iteration, BYD has enhanced product competitiveness and market share, further consolidating its leadership in the NEV industry.
7.5. Technological Innovation
BYD has made substantial investments in technological innovation, consistently introducing competitive NEV products. The company launched the industry’s first intelligent architecture integrating electrification and intelligence, known as "Xuanji," which incorporates BYD’s core technologies in electrification and intelligence, including Yi Sifang, DMO, e-Platform, YunNian, and the three-electric system. The application of these technologies not only enhances product performance and quality but also strengthens the company’s market competitiveness.
7.6. Product Development
BYD is equally committed to product development, with plans to launch multiple new models covering segments from 100,000 to 1 million CNY. Additionally, the company will carry out upgrades and redesigns for existing models to boost their market competitiveness.
7.7. Market Positioning
BYD’s global market positioning is becoming increasingly comprehensive. The company maintains its leading position in the domestic market while actively expanding in overseas markets, achieving significant results. In the future, BYD will continue to advance multi-brand synergistic development and global expansion, using technological innovation to drive high-quality brand growth.
BYD will uphold its development philosophy of "Technology as the King, Innovation as the Foundation," continuously improving product quality and service standards. Over the next few years, the company plans to introduce more competitive NEV products and technological solutions, providing higher-quality products and services to consumers worldwide. Additionally, BYD aims to strengthen collaboration and communication with international partners to collectively promote the advancement of the global NEV industry.
In conclusion, BYD excels in brand value, financial status, technological innovation, product development, and market positioning. As the global NEV market continues to expand and technology advances, BYD is well-positioned to maintain its leading role and achieve even greater success in the future.
References
[1]. Li, Y. (2024, October 12). BYD: Driving performance growth through scaling, premium positioning, and internationalization. Securities Daily, B02.
[2]. Wen, Y. (2024, October 6). Auto show observations: Personalization becomes a new trend in car consumption. Xining Evening News, A04.
[3]. Liu, W., Liu, W., & Lin, H. (2024, October 1). Greater subsidies spark higher consumer enthusiasm. Huizhou Daily, 006.
[4]. Zhao, J. (2024, September 30). Chinese car brands compete overseas with a 50% sales share. China Automotive News, 008.
[5]. Xu, Q. (2024). Research on BYD’s brand value assessment (Master’s thesis). Xi’an University of Technology. https://doi.org/10.27398/d.cnki.gxalu.2024.001757
Cite this article
Zeng,J. (2024). Financial Statement Analysis of BYD Company Limited. Journal of Applied Economics and Policy Studies,12,53-68.
Data availability
The datasets used and/or analyzed during the current study will be available from the authors upon reasonable request.
Disclaimer/Publisher's Note
The statements, opinions and data contained in all publications are solely those of the individual author(s) and contributor(s) and not of EWA Publishing and/or the editor(s). EWA Publishing and/or the editor(s) disclaim responsibility for any injury to people or property resulting from any ideas, methods, instructions or products referred to in the content.
About volume
Journal:Journal of Applied Economics and Policy Studies
© 2024 by the author(s). Licensee EWA Publishing, Oxford, UK. This article is an open access article distributed under the terms and
conditions of the Creative Commons Attribution (CC BY) license. Authors who
publish this series agree to the following terms:
1. Authors retain copyright and grant the series right of first publication with the work simultaneously licensed under a Creative Commons
Attribution License that allows others to share the work with an acknowledgment of the work's authorship and initial publication in this
series.
2. Authors are able to enter into separate, additional contractual arrangements for the non-exclusive distribution of the series's published
version of the work (e.g., post it to an institutional repository or publish it in a book), with an acknowledgment of its initial
publication in this series.
3. Authors are permitted and encouraged to post their work online (e.g., in institutional repositories or on their website) prior to and
during the submission process, as it can lead to productive exchanges, as well as earlier and greater citation of published work (See
Open access policy for details).
References
[1]. Li, Y. (2024, October 12). BYD: Driving performance growth through scaling, premium positioning, and internationalization. Securities Daily, B02.
[2]. Wen, Y. (2024, October 6). Auto show observations: Personalization becomes a new trend in car consumption. Xining Evening News, A04.
[3]. Liu, W., Liu, W., & Lin, H. (2024, October 1). Greater subsidies spark higher consumer enthusiasm. Huizhou Daily, 006.
[4]. Zhao, J. (2024, September 30). Chinese car brands compete overseas with a 50% sales share. China Automotive News, 008.
[5]. Xu, Q. (2024). Research on BYD’s brand value assessment (Master’s thesis). Xi’an University of Technology. https://doi.org/10.27398/d.cnki.gxalu.2024.001757