


1 Introduction
1.1 Introduction
Customer experience is at the center of competition in modern markets as consumers are no longer satisfied with the differentiation of traditional products and services [34]. Due to the previous technical limitations and human cognition, the product or service experience is very single, which are difficult to attract customers and become unattractive over time. Many companies have moved from a single marketing model to experiential marketing. This is mainly because many marketers believed that understanding consumers ‘overall experience with their products, services and brands can help them to further develop attractive marketing strategies [36]. Experiential marketing can improve consumers ‘understanding of the product or service from multiple customer experience, such as visual impact, auditory shock, taste attraction, tactile tenderness, and spiritual resonance. So, the customer experience becomes particularly important, and it would also be the central theme and starting point of this study.
1.2 Research Background
In the 21st century, the rapid development of science and technology lead to fierce competition in the market. In order to attract more consumers and improve the brand loyalty of old customers, companies must take a variety of means to create different experiences to meet the needs of consumers. Among them, the most effective way is experiential marketing. Experiential marketing is a new way to promote products, services, and brands to consumers [36]. While customer experience is the key for formulating experiential marketing strategy as it can enable consumers to effectively differentiate products, services, and brands from different companies in a highly competitive market [9]. If marketing managers can fully understand and be familiar with how consumers experience products, services, and brands, they can further design and provide more attractive experiences of products, services, and brands for them. At present, most companies have embraced the concept of customer experience and experiential marketing, such as service providers, retailers, and electronic product suppliers [20]. At the same time, other consumer and marketing related research has also focused on the concept of customer experience [36]. Therefore, this study also attempts to explore consumer’s brand identification and brand loyalty by understanding the customer experience of Samsung mobile phone users in China.
Generally, customer experience refers to the subjective reactions and internal feelings of consumers arising from direct or indirect contact with a company [27]. The customer experience generated by direct contact usually occurs during the customer’s purchase and use of a product or service [34]. While customer experience generated by indirect contact often related to the information and activities of products, services, and brands, such as news, advertisements, reviews, conferences, and sponsor events [34]. So, companies can create diverse products, service ways, and launch more creative campaigns to attract consumers, thereby enhancing their customer experience. While Schmitt [36] think that customer experience is closely related to consumers’ feelings, self-image, senses, curiosity, and intelligence. Companies that simply emphasize the practical value of their products no longer appeal to consumers. They should pay more attention to the multifaceted experience of consumers. Then, Ihtiyar, Barut and Ihtiyar [20] also indicated that customer experience consists of five categories that includes think, sense, relate, feel, and act. Each category represents a different consumer experience with a product, service, or brand. Many studies have explored the impact of customer experience, and they found it plays an important role in customer-brand relationship, customer satisfaction and brand equity [34]. So, this study also aims to investigate Chinese Samsung users’ view of their mobile phones, thereby exploring the relationship between customer experience (think, sense, relate, feel, and act), brand identification and brand loyalty.
1.3 Problem Statement
Although there is a large amount of literature related to customer experience or experiential marketing until now, the research goals and directions of these literatures are very different [34]. For example, some studies suggested that emotional experience significantly affects customer satisfaction, while behavioral experience significantly affects customer loyalty [25]. Then, other studies suggested that customer experience not just positively affects brand loyalty, but also positively affects various aspects of brand equity. Overall, the results of these studies have a certain uniqueness, so it is difficult to apply universally to different types of studies. Secondly, Schmitt and Zarantonello [37] indicated that customer experience is relatively conceptual and abstract, so its application in the research related to customer behavior is not mature enough, and many related researches are relatively old. Due to technological and economic development, the business environment in which the modern consumer operates is different from the past. So, the results of many past studies are difficult to apply to the current situation or to explain modern consumer behavior.
On the other hand, Ihtiyar, Barut and Ihtiyar [20] indicated that many current research on customer experience tends to ignore the observation and behavioral exploration of youth groups. Although some market research in the western countries has focused on exploring the customer experience of the youth group, there is less research on the customer experience of the youth group in emerging markets, such as Asia [20]. However, the youth group is the main contributor to market consumption in modern society, therefore, the focus of this study is to observe the youth group's experience with Samsung mobile phones. Finally, many existing literatures only verified the relationship between brand experience and brand identification or the relationship between brand identification and brand loyalty, while ignoring the role of customer experience and its five dimensions [1, 8, 6, 40]. Therefore, this study aims to explore whether customer experience can influence brand identification and further influence brand loyalty by understanding the five different experiences (think, sense, relate, feel, and act) of young Chinese users with Samsung mobile phones.
1.4 Research Questions
RQ1: Is there a relationship between Sense and Brand Identification?
RQ2: Is there a relationship between Feel and Brand Identification?
RQ3: Is there a relationship between Think and Brand Identification?
RQ4: Is there a relationship between Act and Brand Identification?
RQ5: Is there a relationship between Relate and Brand Identification?
RQ6: Is there a relationship between Brand Identification and brand Loyalty?
1.5 Research Objectives
The main purpose of this paper is to analyze the customer experience and find out the main factors that affects the brand identification and further explain brand loyalty. So, here is the detail about the research objectives:
RO1: Determine the relationship between Sense and the Brand Identification.
RO2: Determine the relationship between Feel and the Brand Identification.
RO3: Determine the relationship between Think and Brand Identification.
RO4: Determine the relationship between Act and Brand Identification.
RO5: Determine the relationship between Relate and the Brand Identification.
RO6: Determine the relationship between Brand Identification and brand loyalty.
1.6 Significance of Study
The main purpose of this study is to explore Chinese youth user’s experience of Samsung mobile phones, thereby examining the impact of customer experience on brand identification and the impact of brand identification on brand loyalty based on the Strategic Experiential Modules (SEMs). As the SEMs model includes five dimension of customer experience, such as think, sense, relate, feel, and act [35]. If this study can successfully prove that sense, relate, feel, and act has impact on brand identification, and brand identification has impact on brand loyalty, then it would be beneficial for companies to plan product strategy, marketing strategy and brand strategy. So, they can both attract more consumers and improve the loyalty of old customers. At the same time, it can help the marketing managers apply the experiential marketing better than before. Especially it can help marketing managers to accurately design customer experience strategies through different aspects based on the findings of this study, for example, formulate a marketing model that emphasizes a single experience, or formulate a diversified marketing model combining different experiences. Therefore, this study would be very helpful to both companies and marketing managers in the future. Finally, this study also can provide useful information to related research fields and help future research to formulate conceptual model in new way.
1.7 Operational Definition
1.7.1 Sense
The sensory experience of consumers can be achieved through vision, sound, touch, taste, and smell [35]. In this study, Sense is the sensory experience of consumer that generated by the vision, sound, and touch of Samsung mobile phone.
1.7.2 Feel
Feel is an affective experience refers to the emotions, feelings, moods that generated during the process of consumer shopping and using the products or enjoying the services [10]. In this study, Feel is the affective experience that refers to the moods and feelings that generated during the process of consumer using Samsung mobile phone
1.7.3 Think
Think can be understood as creating cognitive and problem-solving experience that can encourage and guide customer to think creatively [36]. In this study, Think is the cognitive experience provided by Samsung and its mobile phone that can guide customer to solve problems by creative thinking.
1.7.4 Act
Act can be interpreted as the physical experience that creating opportunities to enrich customer life patterns or change their life behavior and habits [35]. In this study, Act is the behavioral experience provided by Samsung mobile phone that help customers to enrich their life patterns by various technology functions.
1.7.5 Relate
Relate can created experiences related to the culture, the self-esteem and self-identity of consumers, which reflect the consumers’ aspirations to integrate into the social environment and community [36]. In this study, relate is the social experience that refers to Samsung mobile phone help consumers to connect with others and its brand image help them realize the self-identity in the society.
1.7.6 Brand Identification
Brand identification refers to the state of consumers perceive to be aligned with a particular brand [8]. In this study, brand identification refers to a consumer’s perceived status of being consistent with the Samsung brand, and using the Samsung brand to achieve their personal identity goals.
1.7.7 Brand loyalty
Brand loyalty refers to consumers’ commitment to repurchase a brand regardless of the influence of the environment and marketing efforts [30]. In this study, brand loyalty refers to consumers’ commitment to continue purchasing the products or services of Samsung brand in the future.
1.8 Summary
In this paper, it discussed the background and problems of the topic. Then, it proposed the research questions and objectives, significance of this study, as well as the operational definition of variables.
2 Literature Review
2.1 Introduction
This chapter would discuss the Strategic Experiential Modules (SEMs) and the independent variables of this study, such as sensory experience (Sense), emotional experience (Feel), creative cognitive experience (Think), physical experience, behavior, and lifestyle (Act), and social identity experience (Relate) based on the literature review. At the same time, it would also discuss the intermediating variable and dependent variables, such as brand identification and brand loyalty. Then, the conceptual framework of this study would be presented later in this chapter.
2.2 Strategic Experiential Modules (SEMs)
This study applies the Strategic Experience Modules (SEMs) and experience providers as the theoretical foundation, which is a model of experiential marketing that established by Schmitt [35]. It is widely used by marketing managers. According to Schmitt [35], in the SEMs, the modules can be used to create five types of customer experience for consumers, which includes creative cognitive or intellectual experience (Think), sensory experience (Sense), social-identity or relational experience (Relate), emotional or affective experience (Feel), physical or behavioral experience (Act). Among it, a module represents an experience. Since each module has different internal structures, forming processes, principles and goals, the different modules involve different psychological states and behaviors of consumers [35]. This means that only one module cannot provide consumers with all experiences, the overall customer experience must be generated by combining the different five modules.
In this model, consumers are considered as emotional or irrational decision makers because they are more concerned with a good experience in purchasing and using a product, instead of focusing on price and features only [28]. In a word, the creators of this model believed that consumers have shifted from rational consumption to experiential consumption. Then, Nagasawa [29] think that customer experience involves a perceptual aspect, companies should strive to provide attractive products, thoughtful services, and marketing activities throughout the entire process of customer purchases, so that customers can feel the value of things and stay deep impression. Therefore, in the SEMs, the experience provider is an essential existence. According to Schmitt [35], an experience provider can be anything, such as product displays, event experience venues, and brand logo. However, companies should maintain the coherence and persistence of the experience provider, thus making the best use of it to create a different experience for consumers [35]. In the SEMs, customer experience requires companies and brands to design and deliver products or services from the customer’s perspective [29]. For example, to understand consumers’ lifestyles, living habits and preferences. Therefore, companies should provide consumers with a variety of experiences from the above aspects, thereby promoting them to purchase products and services, identify brands and maintain brand loyalty.
2.3 Dependent Variable
2.3.1 Brand loyalty
Loyalty means that customers will repeatedly buy a certain product or service, while brand loyalty refers to consumers’ commitment to repurchase a brand regardless of the influence of the environment and marketing efforts [30, 41]. It shows that consumers are loyal to a particular brand in both attitude and behavior, especially attitude loyalty means that consumers are willing to spend more money to buy [23]. While Tao, Yue, and Ming [41] indicated that brand loyalty refers to consumers’ commitment to continue buying the same brand in the future, and it reflects consumers’ positive attitude towards the brand. Therefore, brand loyalty is of great significance to the success of the companies. In this study, brand loyalty refers to consumers’ commitment to continue purchasing the products or services of Samsung brand in the future.
Many companies want to build a brand that attracts and retains customers. According to Stokburger-Sauer, Ratneshwar&Sen [40], brand loyalty helps companies to improve financial performance and achieve sustainable growth. However, there are certain differences in the loyalty of different consumers to the same brand. This is mainly because brand loyalty changes over time, and a consumer may have different degrees of preference for multiple brands [41]. In general, brand loyalty can be affected by many factors, such as brand identification, brand attachment or experiential value [4]. While past studies indicated that brand identification has a strong influence on brand loyalty as it inhibits consumers from switching to other brands [40]. Therefore, this study intends to explore the relationship between customer experience and brand identity to further explain brand loyalty.
2.4 Independent variable
2.4.1 Sense
The sensory experience module (Sense) of SEMs can also be understood as the sensory marketing function of customer experience. According to Schmitt [35], sensory marketing is to absorb consumers senses, and the sensory experience of consumers can be achieved through vision, sound, touch, taste, and smell. According to Hulten, Broweus and Dijk [19], the above five senses are the basis for consumers to acquire sensory experience, and each sense can help consumers to further develop different sensory experiences. In this study, Sense is the sensory experience of consumer that generated by the vision, sound, and touch of Samsung mobile phone. This means that consumers’ senses will be attracted by the looks, styling, sound features and materials of Samsung phones. While Edem Amenuvor et al. [10] indicated that sensory experience also reflects consumers’ aesthetics of products. According to Musa et al, [28], sensory experience can be used to distinguish brands, products or different from other places to awaken customers, stimulate customer demand, and increase product value. When consumers are more attracted by the appearance of a product, their recognition of the product and the brand to which the product belongs would increase.
On the other hand, the key point of sense is the resonance point brought by the sensory experience of products, services, and brands. According to past studies, the cognitive consistency and sensory richness is the key principles of Sense [28, 35]. For example, young people’s current demands for mobile phones are large screens, high video resolution and easy portability, and the Samsung foldable phones just meet their needs. Therefore, they obtained the sensory experience from Samsung mobile phone and reached a cognitive consistency with the Samsung brand. Although there are few studies have verified the relationship between Sense and brand identification. Many studies indicated that brand experience has positive impact on brand identification [11, 40]. At the same time, Brakus, Schmitt and Zarantonello [5] indicated that sensory experience is a dimension of brand experience. So, based on above discussion, the potential impact of sensory experience (Sense)has led to the following assumptions:
H1: Sense positively affects brand identification.
2.4.2 Feel
The feel experience module (Feel) of SEMs can also be understood as the marketing of customers’ internal feelings and emotions that creating emotional inner experience, which is the purpose of feel experience [36]. According to Edem Amenuvor et al. [10], Feel is an affective experience that refers to the emotions, feelings, moods that generated during the process of consumer shopping and using the products or enjoying the services. The affective experience reflects the emotional relationship consumers build with products, brands, and companies [14]. In this study, Feel is the affective experience refers to the moods and feelings that generated during the process of consumer using Samsung mobile phone. According to Schmitt [36] customers’ feelings and emotions about products, services and brands can be divided into many categories, such as unconcerned, negative, or positive, calm, or strong. For example, a consumer’s feelings about a Samsung phone or its brand can range from hate to love, vice versa. The more positive the emotional experience of consumers get, the higher their recognition of the product and the brand to which it belongs.
The purpose of Feel is to stimulate customers’ emotions, so that customers will appear impulse consumption [29]. However, each customer has different personalities, so their emotional experience would be different from the same products, service, and brands. For example, young consumers prefer touch-screen phones because they may download a lot of software to use. On the contrary, older consumers hate this kind of phone because their eyesight has difficulty distinguishing the icons on the screen, they are indifferent to these software functions, and even feel irritable. Although few studies have examined the relationship between feel and brand identification, Roy, Sharma, Bose, and Singh [33] indicated that negative affective brand experience has positive impact on brand hate. This means that positive affective brand experience may have positive impact on brand love, which can also be improve the brand identification of consumers. Then, Brakus, Schmitt and Zarantonello [5] indicated that affective experience is a dimension of brand experience, while Ekinci, Chen and Kyeong [11] indicated that brand experience has positive impact on brand identification. So, based on above discussion, the potential impact of the emotional experience (Feel) leads to the following assumptions:
H2: Feel positively affects brand identification.
2.4.3 Think
The think experience module (Think) in SEMs can also be understand as creating cognitive and problem-solving experience that can encourage and guide customer to think creatively [36]. The goal of Think is to stimulate divergent and convergent thinking among consumers through various means, such as surprise activities [35]. For example, the technology products can often provide consumers with a rich intellectual experience, because many technologies it covers can arouse consumers’ curiosity and lead them to use the functions to solve problems. In this study, Think is the cognitive experience provided by Samsung and its mobile phone that can guide customer to solve problems by creative thinking. According to Xu [45], electronic products are the most thought-provoking for consumers, especially Apple provides consumers with a rich cognitive and intellectual experience from product functions to marketing. But Schmitt [35] indicated that Think marketing applies not only to all aspects of technology products, but also to product retailing and design in many other industries.
While Yu and Ko [46] indicated that thinking can cause consumers to re-evaluate products, brands, and companies. The more cognitive experience consumers get from Samsung phones and its brand, the higher their brand awareness and identification. Although few studies have verified the relationship between Think and brand identification, some studies have pointed out that brand experience has positive impact on brand identification [11, 16]. Then, other studies indicated that memorable brand experience led to high brand identification of consumers [6, 36, 40] indicated that intellectual experience is a dimension of brand experience. So, based on above discussion, the potential impact of cognitive experience (Think) leads to the following assumptions:
H3: Think positively affects brand identification.
2.4.4 Act
The Act module in SEMs can be interpreted as the physical experience that creating opportunities to enrich customer life patterns or change their life behavior and habits [35]. For example, companies show consumers a different way of life through their products or advertising. While Schmitt [36] indicated that Act is the physical experience from personal beliefs and their affirmation of the value of things. Then, Soliha, Aquinia, Hayuningtias, and Ramadhan [39], Act can provide consumers experience related to lifestyle and physical behavior, as well as interact with other people in their life. For example, celebrities are often chosen as product or brand models, their image, behavior, and lifestyle will encourage consumers to change their usual way of life and guide them to do things they have not tried before, thereby providing them with behavioral experience. In this study, Act is the behavioral experience provided by Samsung mobile phone that help customers to enrich their life patterns by various technology functions. According to Schmitt [35], lifestyle and behavioral changes can make a difference in consumers’ lives, which is emotional, inspirational, and motivational. The more behavioral experiences consumers get from a product, brand, and company, the more they identify that product, brand, and company.
The purpose of Act is to guide consumers’ physical behavior through interaction, lifestyle displays, thereby providing them with behavior experience [29]. When consumers enrich their life through interacting with products, their lives will be more positive and inspiring. As a result, consumers’ identification of the products and its brand will also increase. Some studies indicated that behavioral experience is also a dimension of brand experience [36]. Currently, few studies have verified the direct link between Act and brand identification. But many studies have confirmed that brand experience has positive correlation with brand identification [6, 11, 16]. So, this study believes that there is also a positive correlation between Act and brand identification. Hence, the potential impact of behavioral experience (Act) lead to the following assumptions:
H4: Act positively affects brand identification.
2.4.5 Relate
Relate is the relational experience in SEMs that can explain as conformity, which contains the other aspects of Act, Think, Feel and Sense [35]. Other studies indicated that relate is a social experience that shows the relationship between individuals and society, and the relationship between individuals and others [10]. Then, Schmitt [36] further explained that relate can created experiences related to the culture, the self-esteem and self-identity of consumers, which reflect the consumers’ aspirations to integrate into the social environment and community. In this study, relate is the social experience that refers to Samsung mobile phone help consumers to connect with others and its brand image help them realize the self-identity in the society. These experiences can be formed in any form, such as group relationships, the family, and the influence of mass media on consumers [10]. Relate reflects consumers’ private feelings and can help them to achieve self-actualization [29]. For example, Apple means innovation and advancement, and consumers gain a relational experience by using Apple products to show others an image of personal innovation and trendsetters. When consumers successfully present their personal image in society through a product or brand, their identification of that product or brand will increase.
Currently, few studies discuss the relationship between relation and brand identification. At the same time, past research did not incorporate relational experience into the dimension of brand experience [5, 36]. This may be because the four dimensions of Act, Think, Feel and Sense have been included in Relate, so there is no need to use it as a separate dimension of brand experience. However, many studies have confirmed that brand experience has positive impact on brand identification, and the four dimensions of brand experience may also positively affect brand identification [6, 11, 16]. Therefore, this study argues that relate may also have the same influence as an aggregate of the four dimensions. Hence, the potential impact of social identity experience (Relate) generated by groups or culture leads to the following assumptions:
H5: Relate positively affects brand identification.
2.5 Intermediating Variable
2.5.1 Brand Identification
Brand identification refers to the state of consumers perceive to be aligned with a particular brand [8]. This concept is derived from the social identity theory, which found that consumers can generate social identity with an item through direct and indirect interactions with it [22]. This is mainly because consumers have a sense of belonging to the brand and company in the process of interacting with the product [8]. According to past studies, consumers would use a single brand to achieve their identity goals if they feel that they have something in common with the brand, [7, 43]. This is mainly because the brand has a symbolic meaning, and the brand identification reflects the integration of the consumer and the brand [8]. In this study, brand identification refers to a consumer’s perceived status of being consistent with the Samsung brand, and using the Samsung brand to achieve their personal identity goals.
According to Balaji, Khong, and Chong [2], brand identification can effectively influence consumers’ attitudes and behaviors towards brands. Other past studies have pointed out that brand identification can positively influence consumers’ brand loyalty [17, 24]. At the same time, some studies indicated that brand identification not only motivates consumers to buy products from that brand, but also reduces the likelihood of consumers switching to other brands [8, 13]. This shows that brand identification does have a significant impact on brand loyalty. Recent study has also pointed out that brand identification is an important driver of brand loyalty as it can positively affect consumer's brand loyalty [4]. So, based on above discussion, the potential impact of brand identification leads to the following assumptions:
H6: Brand Identification positively affects brand loyalty.
2.6 Conceptual Framework
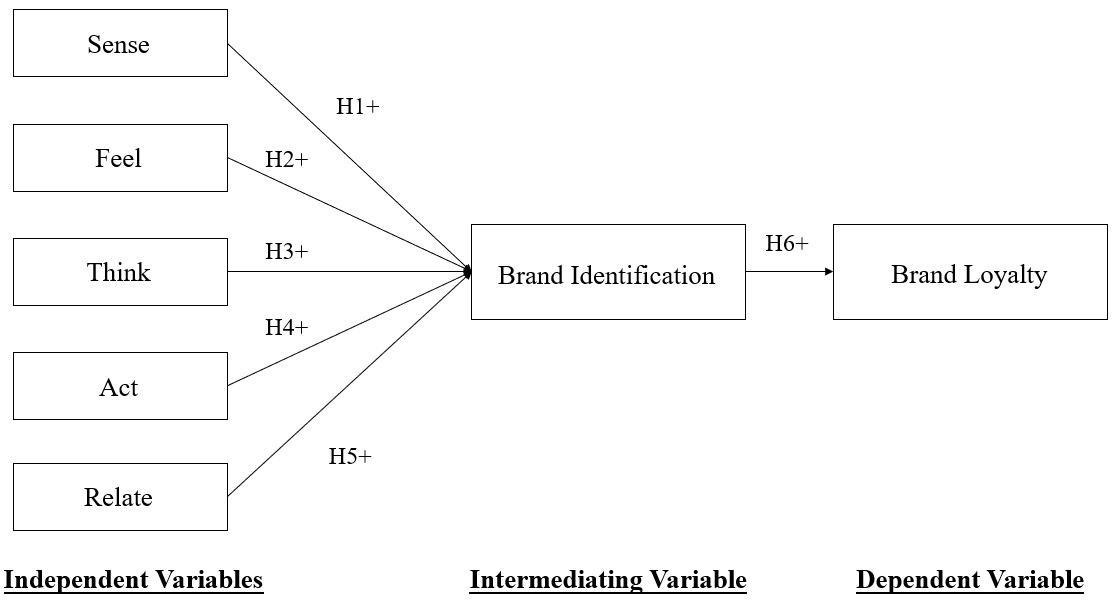
Figure 1. Conceptual Framework
2.7 Hypotheses
H1: Sense positively affects brand identification.
H2: Feel positively affects brand identification.
H3: Think positively affects brand identification.
H4: Act positively affects brand identification.
H5: Relate positively affects brand identification.
H6: Brand identification positively affects brand loyalty.
2.8 Summary
In conclusion, the second chapter discussed the definition of the five independent variables, one intermediate variable and one dependent variable with the supports of past literatures. The framework and hypothesis are formed based on findings of past studies.
3 Research Methodology
3.1 Introduction
This chapter mainly describes the design of this whole research process and the methods of data collection, including research design, target population, sampling method and sample size, data collection procedure, measurement of variables.
3.2 Research Design
The design of research is a blueprint or procedure for collecting, measuring, and interpreting research data from a given area of research and answering research questions [38]. It has been used to support investigators in conducting research activities to achieve the objectives of the study. This study would use quantitative method as it allows the investigator to collect data by distributing the questionnaires to respondents thereby getting the answer of questions and then process the data for analysis [38]. Then, it would conduct the cross-sectional study as it allows investigator to observe the behavior of the target population over a certain period [38]. So, the data collection time of this study was set from the end of June to the middle of July.
3.3 Target Population and Sampling Method
The purpose of this study is to explore the relationship between customer experience, brand identification and brand loyalty by observing the experience of Chinese young consumers with Samsung mobile phones. So, the target population of this study is the Chinese young consumers who own Samsung mobile phones. While Horng, Lee and Chen [38] segmented the youth group into 20 to 39 years old by analyzing human faces. Therefore, the ultimate target population for this study is the Chinese users aged 20 to 39 years old who own Samsung mobile phones. Then, sampling method is used to select the most appropriate individuals as the representative of the entire target population to participated in research [38]. Due to there is a large amount of Samsung mobile phone users in China, this study would conduct the non-probability sampling in order to collect the data in a short time. Among it, this study would use convenience sampling to obtain the required data for convenience and time saving. Because convenience sampling can allow the investigators to reach the target population in the easiest way [38].
3.4 Sample Size
There are some methods that can be used to confirm the sample size of research. Due to this study would use the PLS-Smart to do the data analysis, it would use the rule of thumb to confirm the sample size. This is mainly because the rule of thumb method has been accepted by the PLS-SEM model [26]. According to Hair, Hult, Ringle and Sarstedt [15], the sample size should be 10 times the formative index used to measure a structure or 10 times the maximum number of structural pathways for a structure. Barclay, Thompson, and Higgins [3] proposed the 10-time rule early. Then, other studies also indicated that the 10-time rule of thumb can be applied to PLS analysis as they validated it [32, 44]. Therefore, this study would use the 10-time rule of thumb to determine the sample size. Since this study contains a total of 21 items of variables, so the sample size plan would be 210.
3.5 Variable Measurement
In this study, there are eight sections of questionnaire. The section A would be the demographic information of respondents, such as monthly income, education level and gender. Then, there is a total 21 items of all variables that measured by 6-level Likert scale, in which 1(strongly disagree) to 6 (strongly agree). On the other, there are two items of Sense and Feel, three items of Think, Act and Related, which are all adopted from Lee, Lee, and Choi. Then, there are five items of brand identification and three items of brand loyalty that adopted from Stokburger-Sauer, Ratneshwar and Sen [40].
Table 1. Items of Variables
Section |
Variable |
Questions |
Source |
B |
Sense |
My mobile phone appeals to my senses. |
Lee, Lee&Choi, 2018 |
My mobile phone stimulates my senses. |
|||
C |
Feel |
My mobile phone evokes feelings in me. |
Lee, Lee&Choi, 2018 |
My mobile phone allows me to respond to others in an emotional manner. |
|||
D |
Think |
My mobile phone intrigues me. |
Lee, Lee&Choi, 2018 |
My mobile phone helps to stimulate my curiosity. |
|||
My mobile phone helps me think creatively. |
|||
E |
Act |
My mobile phone helps me think about my lifestyle. |
Lee, Lee&Choi, 2018 |
My mobile phone sends reminders to me of the activities I can do. |
|||
My mobile phone helps me think about my behavior |
|||
F |
Relate |
My mobile phone helps me think about bonds with other people. |
Lee, Lee&Choi, 2018 |
I can relate to other people using my mobile phone. |
|||
My mobile phone helps me think about relationships. |
|||
G |
Brand Identification |
I feel a strong sense of belonging to brand Xiaomi. |
Stokburger-Sauer, Ratneshwar&Sen, 2012 |
I identify strongly with brand Xiaomi. |
|||
Brand Xiaomi embodies what I believe in. |
|||
Brand Xiaomi is like a part of me. |
|||
Brand Xiaomi has a great deal of personal meaning for me |
|||
H |
Brand Loyalty |
I stick with brand Xiaomi because I know it is the best for me. |
Stokburger-Sauer, Ratneshwar&Sen, 2012 |
I will buy brand Xiaomi the next time I buy mobile phone. |
|||
I intend to keep purchasing brand Xiaomi. |
3.6 Data Collection
The questionnaire of this study would be formed by the survey website www. wjx. cn. Then, it would be distributed to target respondents through Internet with E-mail and WeChat. Respondents who receive the questionnaire can choose to fill in the questionnaire on their mobile phone or computer. When the questionnaire is completed, it will be directly included in the background of the Wen Juan Xing website. Then, this study would download all data in excel format and converts it to csv format for PLS-Smart analysis.
3.7 Data Analysis
3.7.1 Reliability Test
The reliability test was used to check the accuracy of the collected data. Cronbach’s alpha is a famous measurement scale that examines the internal consistency and reliability of the data [42]. According to the standard scale of Cronbach’s alpha is shown in Table 2, if theαvalue of variable between 0. 7 and 1, then the data will be acceptable.
Table 2. Standards of Reliability Test
Cronbach’s Alpha |
Strength of Association |
α>0. 9 |
Excellent |
α>0. 8 |
Good |
α>0. 7 |
Acceptable |
α>0. 6 |
Questionable |
α>0. 5 |
Poor |
α<0. 5 |
Unacceptable |
3.7.2 Validity Test
Validity tests were used to measure the internal validity among the variables of this study, thereby ensuring the validity and accuracy of the model structure. In the PLS-Smart analysis, the composite reliability (CR) and average variance extracted (AVE) of each factor should be greater than 0. 7 and 0. 5, respectively [12]. So, the data can achieve convergent validity. Secondly, the realization of discriminant validity needs to meet the following three conditions:(1) the single factor loading should be greater than 0. 7 and the cross loading; (2) the AVE square root of each factor should be greater than the correlation coefficient between the variables; (3) the value of factors should less than 0. 9 in the Heterotrait-Monotrait Ratio [12].
3.7.3 Regression Analysis
Regression analysis is a statistical approach used to determine the relationship between two variables [38]. The primary goal of univariate regression is to analyze the connection between a dependent variable and a single independent variable, while developing the linear relationship equation of dependent and independent variable. Multiple regression model used to determine the relationship between one dependent variable and more than two independent variables [21]. During this study, the multiple regression analysis can be used to test the conceptual model and hypothesis that developed of this study, which is the relationship between the sense, feel, think, act, relate and brand identification, as well as the relationship between the brand identification and brand loyalty.
3.8 Summary
This chapter discussed the research methods used in this study and presented the instrument of variables. Then, it introduced the analysis methods and the standards would be used in this study.
4 Data Analysis
4.1 Introduction
This chapter would describe the characteristics and relevant information of the respondents in this study. Then, it would present the various results of the data analysis in table form with detailed explanations.
4.2 Demographic Analysis
A total of 225 respondents participated in this study, including 56.4% females and 43.6% males. Among them, 36.0% of respondents aged 30 to 34 and 32.4% of respondent aged 25 to 29. 19.1% of respondents aged 20 to 24 and 12.4% of respondents aged 35 to 39. In the part of education level, 66.7% of respondents have a bachelor’s degree. Then, 18.7% of respondents have diploma and 11.6% of them have master degree. But only 2.2% of respondents are high school or below, and 0.9% of them are PhD and above. Then, there are 61.3% married respondents, 35.1% single respondents, and only 3.6% of them were divorced. Fourthly, 50.2% respondents have monthly income of CNY5, 001-10, 000, followed by 22.2% of respondents have monthly income of CNY5,000 and below. While 17.3% of respondents have monthly income of CNY10,001-15,000, and 10.2% of them have monthly income of CNY15,001 and above. 47.6% of respondents are privately employed. Next are self-employed, students and public servants, accounting for 21.3%, 17.3% and 8.4% respectively. While only 4.0% of respondents are housewife and 1.3% of them are unemployed. 46.2% of employed respondents were general staff. Followed by managers and assistants with 8. 0%and 1.8% respectively.
On the other hand, 41.8% of respondents are using Galaxy Note20 Ultra 5G, and 28.0% of them are using Galaxy S22. While Galaxy S21, Galaxy S22+and Galaxy Z Flip3 5G have similar numbers of users, accounting for 8. 95, 10.2% and 11.1% respectively. Then, 40.0% of respondents have used their mobile phones for 1-2 years, and 25.8% of them have used their mobile phones for 2-3 years. While 17.3% of respondents have used their mobile phones for more than 3 years, 16. 9%of them have used their mobile phones for 1 year. Finally, 31.0% of them had used the Galaxy S22, and 16.7% of them had used the Galaxy S22+. While 26.1% of respondents have used both Galaxy S21 and Galaxy Note20 Ultra 5G.
Table 3. Demographic Statistics (N=225)
Descriptions |
Frequency |
Percentage |
|
Gender |
Female |
127 |
56. 4 |
Male |
98 |
43. 6 |
|
Age |
20-24 |
43 |
19. 1 |
25-29 |
73 |
32. 4 |
|
30-34 |
81 |
36. 0 |
|
35-39 |
28 |
12. 4 |
|
Education Level |
High School or below |
5 |
2. 2 |
Diploma |
42 |
18. 7 |
|
Bachelor |
150 |
66. 7 |
|
Master |
26 |
11. 6 |
|
PhD and above |
2 |
0. 9 |
|
Marital Status |
Single |
79 |
35. 1 |
Married |
138 |
61. 3 |
|
Divorced |
8 |
3. 6 |
|
Monthly Income |
CNY5, 000 and below |
50 |
22. 2 |
CNY5, 001-10, 000 |
113 |
50. 2 |
|
CNY10, 001-15, 000 |
39 |
17. 3 |
|
CNY15, 001 and above |
23 |
10. 2 |
|
Which of the following describes you the most? |
Unemployed |
3 |
1. 3 |
Self-employed |
48 |
21. 3 |
|
Student |
39 |
17. 3 |
|
Housewife |
9 |
4. 0 |
|
Privately employed |
107 |
47. 6 |
|
Public servant |
19 |
8. 4 |
|
If you are currently employed, please state your position title. |
Managers |
18 |
8. 0 |
General staff |
104 |
46. 2 |
|
Assistant |
4 |
1. 8 |
|
Self-operated |
48 |
21. 3 |
|
None |
51 |
22. 7 |
|
The type of mobile phone you are using now. |
Galaxy S21 |
20 |
8. 9 |
Galaxy S22 |
63 |
28. 0 |
|
GalaxyNote20 Ultra 5G |
94 |
41. 8 |
|
Galaxy S22+ |
23 |
10. 2 |
|
Galaxy Z Flip3 5G |
25 |
11. 1 |
|
How long have you been using your current Samsung mobile phone? |
Less 1 year |
38 |
16. 9 |
1-2 years |
90 |
40. 0 |
|
2-3 years |
58 |
25. 8 |
|
More than 3 years |
39 |
17. 3 |
|
What other Samsung models have you used before? |
Galaxy S21 |
97 |
26. 1 |
Galaxy S22 |
115 |
31. 0 |
|
GalaxyNote20 Ultra 5G |
97 |
26. 1 |
|
Galaxy S22+ |
62 |
16. 7 |
4.3 Reliability and Convergent Validity Analysis
According to the Table 4, theαvalue of Sense (0.892), Think (0.886), Act (0.882), Relate (0.872), BI (0.884), which higher than 0. 8, so the strength of their data association is good. Then, theαvalue of BL (0.910), which higher than 0.9, so the strength of its data association is excellent. While theαvalue of Feel (0.756), which higher than 0.7, so the strength of its data association is also acceptable. So, the data of this study achieved the reliability.
On the other hand, the CR of Sense (0.949), Feel (0.891), Think (0.930), Act (=0.927), Relate (0.921), BI (0.915), BL (0.943), which higher than 0.7. Then, AVE of Sense (0.902), Feel (0.803), Think (0.815), Act (0.810), Relate (0.796), BI (0.684), BL (0.847). which higher than 0. 5. So, the data of this study achieved the convergent validity.
Table 4. Reliability&Convergent Validity Test
Variables |
Cronbach’s Alpha |
Composite Reliability (CR) |
Average Variance Extracted (AVE) |
Sense |
0. 892 |
0. 949 |
0. 902 |
Feel |
0. 756 |
0. 891 |
0. 803 |
Think |
0. 886 |
0. 930 |
0. 815 |
Act |
0. 882 |
0. 927 |
0. 810 |
Relate |
0. 872 |
0. 921 |
0. 796 |
Brand Identification (BI) |
0. 884 |
0. 915 |
0. 684 |
Brand Loyalty (BL) |
0. 910 |
0. 943 |
0. 847 |
4.4 Discriminant Validity Analysis
According to the Table 5, the square root of each variable’s AVE is all higher than their correlation coefficients in Fornell-Larcker Criterion. Then, the factor loading of each item of variables are higher than 0.7, and their factor loading are all higher than their cross loading in Table 6. Moreover, the Table 7 presented the value of all variables are lower than 0.9 in Heterotrait-Monotrait Ratio. So, the data of this study achieved the discriminant validity as it met all the standards.
Table 5. Fornell-Larcker Criterion
Sense |
Feel |
Think |
Act |
Relate |
BI |
BL |
|
Sense |
0. 950 |
||||||
Feel |
0. 447 |
0. 896 |
|||||
Think |
0. 709 |
0. 535 |
0. 903 |
||||
Act |
0. 675 |
0. 529 |
0. 704 |
0. 900 |
|||
Relate |
0. 694 |
0. 449 |
0. 723 |
0. 775 |
0. 892 |
||
BI |
0. 674 |
0. 417 |
0. 641 |
0. 644 |
0. 652 |
0. 827 |
|
BL |
0. 687 |
0. 470 |
0. 685 |
0. 685 |
0. 669 |
0. 806 |
0. 920 |
Table 6. Factor Loading and Cross Loading
Sense |
Feel |
Think |
Act |
Relate |
BI |
BL |
|
S1 |
0. 954 |
0. 407 |
0. 661 |
0. 625 |
0. 629 |
0. 666 |
0. 660 |
S2 |
0. 946 |
0. 443 |
0. 687 |
0. 659 |
0. 692 |
0. 614 |
0. 644 |
F1 |
0. 382 |
0. 885 |
0. 476 |
0. 468 |
0. 374 |
0. 353 |
0. 382 |
F2 |
0. 417 |
0. 908 |
0. 483 |
0. 480 |
0. 428 |
0. 393 |
0. 457 |
T1 |
0. 669 |
0. 481 |
0. 918 |
0. 638 |
0. 670 |
0. 589 |
0. 637 |
T2 |
0. 622 |
0. 490 |
0. 912 |
0. 657 |
0. 694 |
0. 567 |
0. 613 |
T3 |
0. 627 |
0. 478 |
0. 878 |
0. 611 |
0. 596 |
0. 579 |
0. 604 |
A1 |
0. 598 |
0. 442 |
0. 592 |
0. 902 |
0. 682 |
0. 567 |
0. 590 |
A2 |
0. 673 |
0. 483 |
0. 704 |
0. 896 |
0. 731 |
0. 597 |
0. 626 |
A3 |
0. 548 |
0. 503 |
0. 600 |
0. 902 |
0. 676 |
0. 573 |
0. 632 |
R1 |
0. 613 |
0. 441 |
0. 632 |
0. 718 |
0. 877 |
0. 534 |
0. 566 |
R2 |
0. 611 |
0. 359 |
0. 648 |
0. 671 |
0. 903 |
0. 601 |
0. 602 |
R3 |
0. 634 |
0. 407 |
0. 656 |
0. 689 |
0. 896 |
0. 605 |
0. 621 |
BI1 |
0. 550 |
0. 354 |
0. 476 |
0. 503 |
0. 505 |
0. 826 |
0. 632 |
BI2 |
0. 536 |
0. 328 |
0. 543 |
0. 557 |
0. 593 |
0. 814 |
0. 653 |
BI3 |
0. 569 |
0. 365 |
0. 530 |
0. 526 |
0. 531 |
0. 867 |
0. 703 |
BI4 |
0. 555 |
0. 318 |
0. 523 |
0. 528 |
0. 510 |
0. 812 |
0. 640 |
BI5 |
0. 577 |
0. 355 |
0. 574 |
0. 546 |
0. 552 |
0. 815 |
0. 701 |
BL1 |
0. 574 |
0. 381 |
0. 585 |
0. 579 |
0. 545 |
0. 718 |
0. 910 |
BL2 |
0. 680 |
0. 432 |
0. 667 |
0. 655 |
0. 660 |
0. 738 |
0. 921 |
BL3 |
0. 640 |
0. 483 |
0. 638 |
0. 655 |
0. 641 |
0. 768 |
0. 930 |
Table 7. Heterotrait-Monotrait Ratio
Sense |
Feel |
Think |
Act |
Relate |
BI |
BL |
|
Sense |
|||||||
Feel |
0. 544 |
||||||
Think |
0. 797 |
0. 654 |
|||||
Act |
0. 760 |
0. 647 |
0. 794 |
||||
Relate |
0. 789 |
0. 553 |
0. 823 |
0. 884 |
|||
BI |
0. 758 |
0. 508 |
0. 723 |
0. 728 |
0. 739 |
||
BL |
0. 761 |
0. 563 |
0. 762 |
0. 763 |
0. 749 |
0. 897 |
4.5 Model Analysis
According to the Table 8, the R2 is 0. 548, in Model 1. So, it means that Sense, Feel, Think, Act and Relate jointly explained the BI for roughly 54.8%in this study. While it shows that Sense (β=0.314, t=4.162, p=0.000), which means that Sense positively affected the BI in this study. So, the H1 is supported. However, the H2 and H3 are rejected as the p-value of Feel and Think are all higher than 0.05. So, Feel and Think has no significant impact on BI in this study. Then, it shows that Act (β=0.174, t=2.036, p=0.042) and Relate (β=0.175, t=2.368, p=0.018), which means that Act and Relate positively affected BI in this study. So, the H4 and H5 are supported.
Table 8. Coefficients of Variables and Model 1 Test
Hypotheses |
Beta |
t-value |
p-value |
Decision |
|
Model 1 |
H1: Sense->BI |
0.314 |
4.162 |
0.000 |
Supported |
H2: Feel->BI |
0.021 |
0.364 |
0.716 |
Rejected |
|
H3: Think->BI |
0.158 |
1.937 |
0.053 |
Rejected |
|
H4: Act->BI |
0.174 |
2.036 |
0.042 |
Supported |
|
H5: Relate->BI |
0.175 |
2.368 |
0.018 |
Supported |
|
R2=0. 548 |
|||||
On the other hand, the R2 is 0.650 in Model 2. So, it means that BI explained BL for roughly 65% in this study. While it shows that BI (β=0.806, t=43.033, p=0.000), which means that BI positively affected BL in this study. So, the H6 is supported.
Table 9 Coefficients of BI and Model 2 Test
Hypotheses |
Beta |
t-value |
p-value |
Decision |
|
Model 2 |
H6: BI->BL |
0.806 |
43.033 |
0.000 |
Supported |
R2=0.650 |
|||||
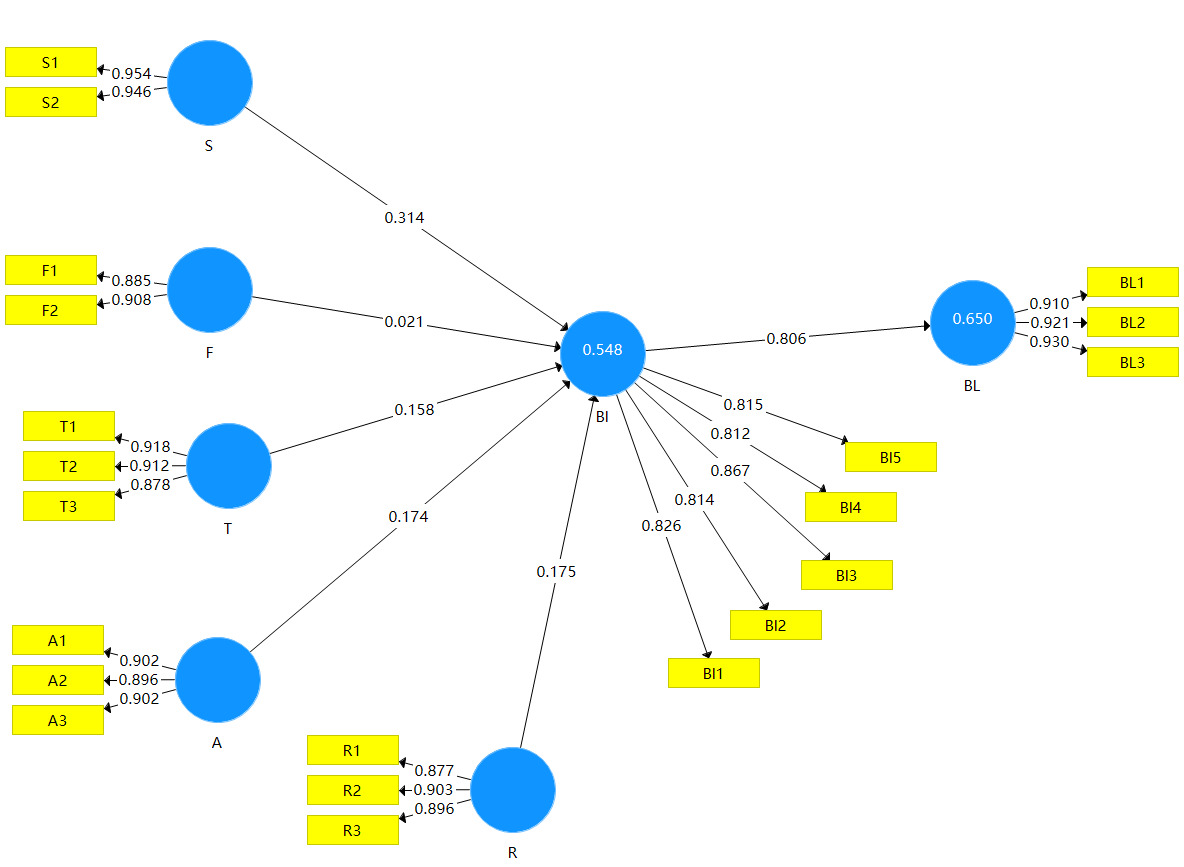
Figure 2. Results of Conceptual Model Structure
4.6 Summary
This chapter analyzed the collected data in PLS-Smart. All the data in this study met the standards of reliability and validity. Then, this study has successfully tested the conceptual model and hypothesis. Then, the results would be interpreted in detail in next chapter.
5 Discussion and Conclusion
5.1 Introduction
This chapter would discuss the main findings of this study and explain the implications of this study based on the results of the data analysis in the previous chapter. Secondly, it would elaborate on the limitations of this study and make some reasonable recommendations for future research.
5.2 Discussion of Major Findings
The conceptual model of this study is valid as it proved that Sense, Feel, Think, Act and Relate jointly explained the brand identification for roughly 54.8%. At the same time, brand identification can explain brand loyalty for roughly 65.0%. As for the hypothesis test, it found that Sense positively affected the Samsung user’s brand identification, which is consistent with the findings of some past studies to a certain extent [11, 40]. For example, Brakus, Schmitt and Zarantonello [5] divided Sense as a dimension of brand experience, while Feiz and Moradi [11] proved that there is a positive relationship between brand experience and brand identification. Although this study draws side-by-side inferences from the findings of other studies, it ultimately demonstrates a significant and positive relationship between Sense and brand identification. This may be because most of the young Samsung users in this study pay more attention to the appearance of the phone, and Samsung phones meet their needs very well.
Then, this study found that there is no significant influence of Feel on brand identification, which is inconsistent with the findings of Han, Ekinci and Chen [16] to a certain extent. Although the findings of Roy et al. refer to the fact that negative affective experience has positively affect consumers’ brand hate, it conversely confirms that positive affective experience can increase consumers’ love for brands, thus forming a high degree of brand identification. While other studies indicated that affective experience as the dimension of brand experience can positively affect brand identification [16, 36]. Most of the respondents in this study have used Samsung mobile phones for more than one year, and their positive feelings about Samsung may have gradually weakened in the process of using them. Therefore, it is difficult for Feel to be a factor in their identification of the Samsung brand in this context.
Thirdly, this study found that there is no significant influence of Think on brand identification, which is inconsistent with the findings found by Büyükdag and Kitapci [6] to a certain extent. They found that memorable brand experience has positive impact on brand deidentification. According to reasonable suppose, think as one dimension of brand experience should also has positive influence on brand identification. However, this study obtained the opposite result. At the same time, this finding is also inconsistent with statements of Schmitt [35] and Xu [45]. According to them, electronics and technology products are the ones that provide consumers with the most intellectual experience, but respondents in this study do not seem to derive a high degree of this experience from using a Samsung phone. It may be possible that they are used to the functions of their phones and are proficient in using the software on these phones to solve problems.
On the other hand, this study found that Act positively affected the Samsung user’s brand identification, which is consistent with the findings of recent studies to a certain extent [11, 16]. They both proved that brand experience has positively affect brand identification, therefore, Act as a dimension of brand experience should have a corresponding effect. Although few studies have explored the relationship between Act and brand identification, this study successfully demonstrated a positive association between them. This may be because most of the respondents in this study have changed traditional life patterns by using the software and functions of Samsung mobile phone, such as online shopping, mobile payment, and door unlocking.
Then, it also found that Relate positively affected the Samsung user’s brand identification, which is a new finding. Because there is no study confirmed its influence on brand identification, even past studies have not incorporated it into the dimension of brand experience [5, 36]. However, relate can be seen as the aggregate of the above 4 factors, which may have a positive relationship with brand identification to a large extent. Because brand experience also covers the above four factors, and many studies have proved the positive impact of brand experience on brand identification [10, 11, 16]. Therefore, the hypothesis of this study was finally proved to be correct.
Finally, this study found that brand identification positively affected the Samsung users’brand loyalty, which is consistent with the findings found by Chung and Park [8]. At the same time, other studies in different contexts also proved this point. For example, Stokburger-Sauer, Ratneshwar and Sen found that brand identification has positive impact on the brand loyalty of German household consumers, and Boateng et al. [4] found that brand identification positively affected the brand loyalty of consumers in Ghana. This may be because brand identification represents the consumer’s sense of belonging to the brand and they think that brand shows their self-image, so it can largely translate into brand loyalty. In addition, this study also found that brand identification is one of the strongest predictors of brand loyalty as it can explain it for 65.4%, which is more than half.
5.3 Implication of the Study
In general, this study can make certain contributions to related fields from two aspects. Firstly, this study demonstrated the validity of the five dimensions of customer experience and the SEMs model in a new context, thus extending the scope of application of the model and customer experience. Future research can apply the conceptual model and related variables of this study in different contexts. Secondly, this study provides useful academic support and basis for future research in related fields. As this study further explains the five dimensions of customer experience and finds their influence on brand identification, future research can better apply these findings to create new conceptual models.
On the other hand, this research can provide Samsung company and mobile phone market managers with effective information to further optimize product strategy, brand strategy and market strategy. For example, Samsung can further optimize the shape design of mobile phones, screen resolution and sound effects to stimulate consumers’ sensory experience and increase their identification and loyalty to Samsung. Secondly, marketing managers can invite popular celebrities as brand spokespersons, and then guide consumers to use mobile phone to create new lifestyles through the star effect, thereby improving consumers’ identification and attention to the brand, thereby attracting new customers, and retaining old ones. Finally, marketing managers can design a variety of promotional activities so that can provide more opportunities to customers for fully understanding the products and brand-related information, such as new product launches, celebrity meetups and online tutorials, thereby improving consumers’ identification of products and brands, and then further translates into loyalty.
5.4 Limitations of the Study
There are some limitations in this study, which may provide opportunities for further improvement in future research. Firstly, the sampling method of this study has limitations. Due to this study used a convenience sampling and only distributed the questionnaires online, it is difficult to directly find eligible target groups to participate in the survey. So, the data of the entire study need to be screened for a long time, and only 225 valid data are left after screening, thereby the data analysis results would also be less representative of the overall target population. Secondly, the data collection period for this study was limited. Due to this study followed the rules of a cross-sectional study, the questionnaires were all distributed once and accessible within two weeks. As a result, many potential respondents did not respond or exceeded the time to respond, resulting in relatively little data collected in this study and only reflecting respondents ‘current thinking. Finally, the sample for this study is limited to Chinese young users of Samsung mobile phone. So, the research findings may not generalize to populations with different age and cultures or using different brands of mobile phones. At the same time, the findings of this study may not be fully applicable to other products.
5.5 Recommendations for Future Research
This study aims to provide some relevant recommendations for future research to avoid them from presenting the same research limitations. Firstly, future research could employ a snowball sampling method to obtain research data. Because this sampling method allows the researcher to find individual potential respondents with the desired characteristics for the initial survey, and then obtain a list of more eligible respondents from them, thus saving time in the questionnaire survey and avoiding data that does not match research requirements. Secondly, future research can repeat distribute the questionnaires as much as possible and extend the time of questionnaire collection to obtain more samples. Because many potential respondents are busy with their daily lives, they may miss the time to receive the questionnaire or not have enough time to browse the questionnaire. Repeated distribution of the questionnaire can give them more opportunities to access the questionnaire, thereby increasing the probability of potential respondents to respond. While extending the questionnaire collection time can provide sufficient time for potential respondents to complete the questionnaire. Thirdly, if the situation allows, future research can use different samples as much as possible to improve the representativeness of the research results. For example, researchers can try to collect data on Samsung mobile phone users in different countries, and then adopt these data in research to further explain the behavior of target groups with different cultures and characteristics.
5.6 Conclusion
Overall, this study found that Sense, Act and Relate all have a positive impact on brand identification and further positively affects brand loyalty by investigating the customer experience of Samsung mobile phone users in China. Therefore, Samsung and its mobile phone market managers can formulate corresponding strategies to improve consumer’s brand identification and loyalty based on these findings. At the same time, other mobile phone companies and related market managers can also appropriately adopt the viewpoints of this study for their strategies. On the other hand, future research can further design new models or optimize existing models based on the findings of this study, thereby making more contributions to related research knowledge and fields.
Acknowledgement
I would like to express my gratitude to my supervisor Professor. Lim Yet Mee. Thanks for her guidance and support, so that I was able to complete the entire research and achieve the goal of my research. Then, I would like to express my gratitude to USCI University, which provide me the diverse channel to access to research materials. At the same time, I would like to express my gratitude to the respondents who participated in the research. The valuable information that provided by them helped me to achieve my final research results.
Declaration of Originality and Exclusiveness
I hereby declare that the dissertation is based on my original work except for quotations and citations which have been duly acknowledged. I also declare that it has not been previously or concurrently submitted for any other degree at UCSI or other institutions.
References
[1]. Alnawas, I., & Altarifi, S. (2015). Exploring the role of brand identification and brand love in generating higher levels of brand loyalty. Journal of Brand Management, 22(1), 71-85. https://doi.org/10.1177/1356766715604663
[2]. Balaji, M. S., Khong, K. W., & Chong, A. Y. L. (2016). Determinants of negative word-of-mouth communication using social networking sites. Information and Management, 53(4), 528-540.
[3]. Barclay, D., Thompson, R., & Higgins, C. (1995). The Partial Least Squares (PLS) approach to causal modeling: Personal computer use as an illustration. Technology Studies, 2(2), 285-309.
[4]. Boateng, H., Kosiba, J. P., Adam, D. R., Ofori, K. S., & Okoe, A. F. (2020). Examining brand loyalty from an attachment theory perspective. Marketing Intelligence & Planning, 38(4), 479–494. https://doi.org/10.1108/MIP-03-2019-0161
[5]. Brakus, J. J., Schmitt, B. H., & Zarantonello, L. (2009). Brand experience: What is it? How is it measured? Does it affect loyalty? Journal of Marketing, 73(3), 52–68.
[6]. Büyükdağ, N., & Kitapci, O. (2021). Antecedents of consumer-brand identification in terms of belonging brands. Journal of Retailing and Consumer Services, 59, 102420. https://doi.org/10.1016/j.jretconser.2020.102420
[7]. Carlson, B. D., Donavan, D. T., & Cumiskey, K. J. (2009). Consumer-brand relationships in sport: Brand personality and identification. International Journal of Retail & Distribution Management, 37(4), 370–384.
[8]. Chung, S., & Park, J. (2017). The influence of brand personality and relative brand identification on brand loyalty in the European mobile phone market. Canadian Journal of Administrative Sciences, 34(1), 47–62. https://doi.org/10.1002/cjas.1321
[9]. Dhillon, R., Agarwal, B., & Rajput, N. (2021). Determining the impact of experiential marketing on consumer satisfaction: A case of India’s luxury cosmetic industry. Innovative Marketing, 17(4), 62–74. https://doi.org/10.21511/im.17(4).2021.06
[10]. Amenuvor, F. E., Owusu-Antwi, K., Basilisco, R., & Seong-Chan, B. (2019). Customer experience and behavioral intentions: The mediation role of customer perceived value. International Journal of Scientific Research and Management, 7(10), 1359–1374. https://doi.org/10.18535/ijsrm/v7i10.em02
[11]. Feiz, D., & Moradi, H. (2020). Creating consumer-based brand equity for customers by brand experience: Evidence from Iran banking industry. Journal of Islamic Marketing, 11(6), 1443–1464. https://doi.org/10.1108/JIMA-03-2019-0055
[12]. Fornell, C., & Larcker, D. F. (1981). Evaluating structural equation models with unobservable variables and measurement error. Journal of Marketing Research, 18(1), 39-50. https://doi.org/10.2307/3151312
[13]. Freling, T. H., & Forbes, L. P. (2005). An empirical analysis of the brand personality effect. Journal of Product & Brand Management, 14(7), 404–413.
[14]. Gentile, C., Spiller, N., & Giuliano, N. (2007). How to sustain the customer experience: An overview of experience components that co-create value with the customer. European Management Journal, 25(5), 395–410.
[15]. Hair, J. F., Hult, G. T. M., Ringle, C. M., & Sarstedt, M. (2017). A primer on partial least squares structural equation modeling (PLS-SEM) (2nd ed.). Sage.
[16]. Han, S. H., Ekinci, Y., Chen, C. S., & Park, M. K. (2020). Antecedents and the mediating effect of customer-restaurant brand identification. Journal of Hospitality Marketing & Management, 29(2), 202–220.
[17]. Homburg, C., Wieseke, J., & Hoyer, W. D. (2009). Social identity and the service-profit chain. Journal of Marketing, 73(2), 38–54.
[18]. Horng, W. B., Lee, C. P., & Chen, C. W. (2001). Classification of age groups based on facial features. Tamkang Journal of Science and Engineering, 4(3), 183-192.
[19]. Hulten, B., Broweus, N., & Dijk, M. V. (2009). Sensory marketing. Journal of Product Innovation Management. https://doi.org/10.1111/j.1540-5885.2011.00829_1.x
[20]. Ihtiyar, A., Barut, M., & Ihtiyar, H. G. (2019). Experiential marketing, social judgements, and customer shopping experience in emerging markets. Asia Pacific Journal of Marketing and Logistics, 31(2), 499–515. https://doi.org/10.1108/APJML-02-2018-0081
[21]. Kuenzel, S., & Halliday, S. V. (2010). The chain of effects from reputation and brand personality congruence to brand loyalty: The role of brand identification. Journal of Targeting, Measurement and Analysis for Marketing, 18(3/4), 167–176.
[22]. Kuikka, A., & Laukkanen, T. (2012). Brand loyalty and the role of hedonic value. Journal of Product & Brand Management, 21(7), 529-537.
[23]. Lam, S. K., Ahearne, M., Mullins, R., Hayati, B., & Schillewaert, N. (2013). Exploring the dynamics of antecedents to consumer–brand identification with a new brand. Journal of the Academy of Marketing Science, 41(2), 234-252.
[24]. Mano, H., & Oliver, R. L. (1997). Assessing the dimensionality and structure of the consumption experience: Evaluation, feeling, and satisfaction. Journal of Consumer Research, 20(3), 451-466.
[25]. Memon, M. A., Ting, H., Cheah, J.-H., Thurasamy, R., Chuah, F., & Cham, T. H. (2020). Sample size for survey research: Review and recommendations. Journal of Applied Structural Equation Modeling, 4(2). https://doi.org/10.47263/jasem.4(2)01
[26]. Meyer, C., & Schwager, A. (2007). Understanding customer experience. Harvard Business Review, 85(6), 137.
[27]. Musa, G., Mohammad, I., Thirumoorthi, T., & Moghavvemi, S. (2015). Exploring visitors’ experience using strategic experiential modules (SEMs): The case of Zoo Negara, Kuala Lumpur. International Journal of Tourism Cities, 1(3), 234–253. https://doi.org/10.1108/IJTC-08-2014-0012
[28]. Nagasawa, S. (2008). Customer experience management: Influencing on human Kansei to management of technology. TQM Journal, 20(4), 312–323. https://doi.org/10.1108/17542730810881302
[29]. Oliver, R. L. (1997). Satisfaction: A behavioral perspective on the consumer. The McGraw-Hill Companies.
[30]. Oliver, R. L. (2010). Satisfaction: A behavioral perspective on the customer (2nd ed.). McGraw Hill.
[31]. Peng, D. X., & Lai, F. (2012). Using partial least squares in operations management research: A practical guideline and summary of past research. Journal of Operations Management, 30(6), 467-480.
[32]. Roy, S. K., Sharma, A., Bose, S., & Singh, G. (2022). Consumer-brand relationship: A brand hate perspective. Journal of Business Research, 144(2), 1293–1304. https://doi.org/10.1016/j.jbusres.2022.02.065
[33]. Sastra, B. A., & Indrawati. (2018). Measuring the influence of customer experience on customer satisfaction, loyalty intention, and word of mouth behavior using customer experience quality (EXQ) model on Telkom’s IndiHome complaint handling process. The 8th International Conference on Sustainable Collaboration in Business, Technology, Information, and Innovation.
[34]. Schmitt, B. (1999). Experiential marketing. Journal of Marketing Management, 13(1–3), 53-67.
[35]. Schmitt, B. (2010). Experience marketing: Concepts, frameworks, and consumer insights. Foundations and Trends in Marketing, 5(2), 55–112. https://doi.org/10.1561/1700000027
[36]. Schmitt, B., & Zarantonello, L. (2013). Customer experience and experiential marketing: A critical review. Review of Marketing Research, 25-61.
[37]. Sekaran, U., & Bougie, R. (2016). Research methods for business (7th ed.). John Wiley & Sons.
[38]. Soliha, E., Aquinia, A., Hayuningtias, K. A., & Ramadhan, K. R. (2021). The influence of experiential marketing and location on customer loyalty. Journal of Asian Finance, Economics and Business, 8(3), 1327–1337. https://doi.org/10.13106/jafeb.2021.vol8.no3.1327
[39]. Stokburger-Sauer, N., Ratneshwar, S., & Sen, S. (2012). Drivers of consumer-brand identification. International Journal of Research in Marketing, 29(4), 406–418. https://doi.org/10.1016/j.ijresmar.2012.06.001
[40]. Tao, L., Yue, W., & Ming, M. (2017). The impact of spoke-characters on brand loyalty: The mediating role of brand experience. International Journal of Management and Social Sciences Research, 3(1). https://doi.org/10.12783/dtssehs/hsmet2016/10259
[41]. Tavakol, M., & Dennick, R. (2011). Making sense of Cronbach’s alpha. International Journal of Medical Education, 2, 53-55.
[42]. Tildesley, A. E., & Coote, L. V. (2009). This brand is me: A social identity-based measure of brand identification. Advances in Consumer Research, 36, 627–628.
[43]. Wasko, M. M., & Faraj, S. (2005). Why should I share? Examining social capital and knowledge contribution in electronic networks of practice. MIS Quarterly, 29(1), 35-57.
[44]. Xu, Q. (2020). The relationship between experience marketing and smartphone brand customer loyalty. Journal of Business Research, 145, 233–245.
[45]. Yu, H., & Ko, H. T. (2012). Integrating Kano model with strategic experiential modules in developing ICT-enabled services: An empirical study. Management Decision, 50(1), 7–20. https://doi.org/10.1108/00251741211194840
Cite this article
Wei,Z. (2024). A Survey on Investigating the Customer Experience of Samsung Mobile Phones in China. Journal of Applied Economics and Policy Studies,13,1-19.
Data availability
The datasets used and/or analyzed during the current study will be available from the authors upon reasonable request.
Disclaimer/Publisher's Note
The statements, opinions and data contained in all publications are solely those of the individual author(s) and contributor(s) and not of EWA Publishing and/or the editor(s). EWA Publishing and/or the editor(s) disclaim responsibility for any injury to people or property resulting from any ideas, methods, instructions or products referred to in the content.
About volume
Journal:Journal of Applied Economics and Policy Studies
© 2024 by the author(s). Licensee EWA Publishing, Oxford, UK. This article is an open access article distributed under the terms and
conditions of the Creative Commons Attribution (CC BY) license. Authors who
publish this series agree to the following terms:
1. Authors retain copyright and grant the series right of first publication with the work simultaneously licensed under a Creative Commons
Attribution License that allows others to share the work with an acknowledgment of the work's authorship and initial publication in this
series.
2. Authors are able to enter into separate, additional contractual arrangements for the non-exclusive distribution of the series's published
version of the work (e.g., post it to an institutional repository or publish it in a book), with an acknowledgment of its initial
publication in this series.
3. Authors are permitted and encouraged to post their work online (e.g., in institutional repositories or on their website) prior to and
during the submission process, as it can lead to productive exchanges, as well as earlier and greater citation of published work (See
Open access policy for details).
References
[1]. Alnawas, I., & Altarifi, S. (2015). Exploring the role of brand identification and brand love in generating higher levels of brand loyalty. Journal of Brand Management, 22(1), 71-85. https://doi.org/10.1177/1356766715604663
[2]. Balaji, M. S., Khong, K. W., & Chong, A. Y. L. (2016). Determinants of negative word-of-mouth communication using social networking sites. Information and Management, 53(4), 528-540.
[3]. Barclay, D., Thompson, R., & Higgins, C. (1995). The Partial Least Squares (PLS) approach to causal modeling: Personal computer use as an illustration. Technology Studies, 2(2), 285-309.
[4]. Boateng, H., Kosiba, J. P., Adam, D. R., Ofori, K. S., & Okoe, A. F. (2020). Examining brand loyalty from an attachment theory perspective. Marketing Intelligence & Planning, 38(4), 479–494. https://doi.org/10.1108/MIP-03-2019-0161
[5]. Brakus, J. J., Schmitt, B. H., & Zarantonello, L. (2009). Brand experience: What is it? How is it measured? Does it affect loyalty? Journal of Marketing, 73(3), 52–68.
[6]. Büyükdağ, N., & Kitapci, O. (2021). Antecedents of consumer-brand identification in terms of belonging brands. Journal of Retailing and Consumer Services, 59, 102420. https://doi.org/10.1016/j.jretconser.2020.102420
[7]. Carlson, B. D., Donavan, D. T., & Cumiskey, K. J. (2009). Consumer-brand relationships in sport: Brand personality and identification. International Journal of Retail & Distribution Management, 37(4), 370–384.
[8]. Chung, S., & Park, J. (2017). The influence of brand personality and relative brand identification on brand loyalty in the European mobile phone market. Canadian Journal of Administrative Sciences, 34(1), 47–62. https://doi.org/10.1002/cjas.1321
[9]. Dhillon, R., Agarwal, B., & Rajput, N. (2021). Determining the impact of experiential marketing on consumer satisfaction: A case of India’s luxury cosmetic industry. Innovative Marketing, 17(4), 62–74. https://doi.org/10.21511/im.17(4).2021.06
[10]. Amenuvor, F. E., Owusu-Antwi, K., Basilisco, R., & Seong-Chan, B. (2019). Customer experience and behavioral intentions: The mediation role of customer perceived value. International Journal of Scientific Research and Management, 7(10), 1359–1374. https://doi.org/10.18535/ijsrm/v7i10.em02
[11]. Feiz, D., & Moradi, H. (2020). Creating consumer-based brand equity for customers by brand experience: Evidence from Iran banking industry. Journal of Islamic Marketing, 11(6), 1443–1464. https://doi.org/10.1108/JIMA-03-2019-0055
[12]. Fornell, C., & Larcker, D. F. (1981). Evaluating structural equation models with unobservable variables and measurement error. Journal of Marketing Research, 18(1), 39-50. https://doi.org/10.2307/3151312
[13]. Freling, T. H., & Forbes, L. P. (2005). An empirical analysis of the brand personality effect. Journal of Product & Brand Management, 14(7), 404–413.
[14]. Gentile, C., Spiller, N., & Giuliano, N. (2007). How to sustain the customer experience: An overview of experience components that co-create value with the customer. European Management Journal, 25(5), 395–410.
[15]. Hair, J. F., Hult, G. T. M., Ringle, C. M., & Sarstedt, M. (2017). A primer on partial least squares structural equation modeling (PLS-SEM) (2nd ed.). Sage.
[16]. Han, S. H., Ekinci, Y., Chen, C. S., & Park, M. K. (2020). Antecedents and the mediating effect of customer-restaurant brand identification. Journal of Hospitality Marketing & Management, 29(2), 202–220.
[17]. Homburg, C., Wieseke, J., & Hoyer, W. D. (2009). Social identity and the service-profit chain. Journal of Marketing, 73(2), 38–54.
[18]. Horng, W. B., Lee, C. P., & Chen, C. W. (2001). Classification of age groups based on facial features. Tamkang Journal of Science and Engineering, 4(3), 183-192.
[19]. Hulten, B., Broweus, N., & Dijk, M. V. (2009). Sensory marketing. Journal of Product Innovation Management. https://doi.org/10.1111/j.1540-5885.2011.00829_1.x
[20]. Ihtiyar, A., Barut, M., & Ihtiyar, H. G. (2019). Experiential marketing, social judgements, and customer shopping experience in emerging markets. Asia Pacific Journal of Marketing and Logistics, 31(2), 499–515. https://doi.org/10.1108/APJML-02-2018-0081
[21]. Kuenzel, S., & Halliday, S. V. (2010). The chain of effects from reputation and brand personality congruence to brand loyalty: The role of brand identification. Journal of Targeting, Measurement and Analysis for Marketing, 18(3/4), 167–176.
[22]. Kuikka, A., & Laukkanen, T. (2012). Brand loyalty and the role of hedonic value. Journal of Product & Brand Management, 21(7), 529-537.
[23]. Lam, S. K., Ahearne, M., Mullins, R., Hayati, B., & Schillewaert, N. (2013). Exploring the dynamics of antecedents to consumer–brand identification with a new brand. Journal of the Academy of Marketing Science, 41(2), 234-252.
[24]. Mano, H., & Oliver, R. L. (1997). Assessing the dimensionality and structure of the consumption experience: Evaluation, feeling, and satisfaction. Journal of Consumer Research, 20(3), 451-466.
[25]. Memon, M. A., Ting, H., Cheah, J.-H., Thurasamy, R., Chuah, F., & Cham, T. H. (2020). Sample size for survey research: Review and recommendations. Journal of Applied Structural Equation Modeling, 4(2). https://doi.org/10.47263/jasem.4(2)01
[26]. Meyer, C., & Schwager, A. (2007). Understanding customer experience. Harvard Business Review, 85(6), 137.
[27]. Musa, G., Mohammad, I., Thirumoorthi, T., & Moghavvemi, S. (2015). Exploring visitors’ experience using strategic experiential modules (SEMs): The case of Zoo Negara, Kuala Lumpur. International Journal of Tourism Cities, 1(3), 234–253. https://doi.org/10.1108/IJTC-08-2014-0012
[28]. Nagasawa, S. (2008). Customer experience management: Influencing on human Kansei to management of technology. TQM Journal, 20(4), 312–323. https://doi.org/10.1108/17542730810881302
[29]. Oliver, R. L. (1997). Satisfaction: A behavioral perspective on the consumer. The McGraw-Hill Companies.
[30]. Oliver, R. L. (2010). Satisfaction: A behavioral perspective on the customer (2nd ed.). McGraw Hill.
[31]. Peng, D. X., & Lai, F. (2012). Using partial least squares in operations management research: A practical guideline and summary of past research. Journal of Operations Management, 30(6), 467-480.
[32]. Roy, S. K., Sharma, A., Bose, S., & Singh, G. (2022). Consumer-brand relationship: A brand hate perspective. Journal of Business Research, 144(2), 1293–1304. https://doi.org/10.1016/j.jbusres.2022.02.065
[33]. Sastra, B. A., & Indrawati. (2018). Measuring the influence of customer experience on customer satisfaction, loyalty intention, and word of mouth behavior using customer experience quality (EXQ) model on Telkom’s IndiHome complaint handling process. The 8th International Conference on Sustainable Collaboration in Business, Technology, Information, and Innovation.
[34]. Schmitt, B. (1999). Experiential marketing. Journal of Marketing Management, 13(1–3), 53-67.
[35]. Schmitt, B. (2010). Experience marketing: Concepts, frameworks, and consumer insights. Foundations and Trends in Marketing, 5(2), 55–112. https://doi.org/10.1561/1700000027
[36]. Schmitt, B., & Zarantonello, L. (2013). Customer experience and experiential marketing: A critical review. Review of Marketing Research, 25-61.
[37]. Sekaran, U., & Bougie, R. (2016). Research methods for business (7th ed.). John Wiley & Sons.
[38]. Soliha, E., Aquinia, A., Hayuningtias, K. A., & Ramadhan, K. R. (2021). The influence of experiential marketing and location on customer loyalty. Journal of Asian Finance, Economics and Business, 8(3), 1327–1337. https://doi.org/10.13106/jafeb.2021.vol8.no3.1327
[39]. Stokburger-Sauer, N., Ratneshwar, S., & Sen, S. (2012). Drivers of consumer-brand identification. International Journal of Research in Marketing, 29(4), 406–418. https://doi.org/10.1016/j.ijresmar.2012.06.001
[40]. Tao, L., Yue, W., & Ming, M. (2017). The impact of spoke-characters on brand loyalty: The mediating role of brand experience. International Journal of Management and Social Sciences Research, 3(1). https://doi.org/10.12783/dtssehs/hsmet2016/10259
[41]. Tavakol, M., & Dennick, R. (2011). Making sense of Cronbach’s alpha. International Journal of Medical Education, 2, 53-55.
[42]. Tildesley, A. E., & Coote, L. V. (2009). This brand is me: A social identity-based measure of brand identification. Advances in Consumer Research, 36, 627–628.
[43]. Wasko, M. M., & Faraj, S. (2005). Why should I share? Examining social capital and knowledge contribution in electronic networks of practice. MIS Quarterly, 29(1), 35-57.
[44]. Xu, Q. (2020). The relationship between experience marketing and smartphone brand customer loyalty. Journal of Business Research, 145, 233–245.
[45]. Yu, H., & Ko, H. T. (2012). Integrating Kano model with strategic experiential modules in developing ICT-enabled services: An empirical study. Management Decision, 50(1), 7–20. https://doi.org/10.1108/00251741211194840