


1. Introduction
Global climate change has emerged as the paramount challenge to sustainable human development. The Sixth Assessment Report of the Intergovernmental Panel on Climate Change (IPCC) underscores that exceeding the 1.5°C global warming threshold would drastically intensify risks of extreme weather events and ecosystem collapse, necessitating immediate collective action. Against this backdrop, China—the world's largest greenhouse gas emitter—formally announced its "dual carbon" goals (carbon peaking by 2030 and carbon neutrality by 2060) in 2020, initiating a historic transition toward low-carbon economic development. Empirical evidence from international practices indicates that excessive reliance on administrative emission mandates may stifle economic vitality, whereas market-based mechanisms can optimize resource allocation through price signals [1]. This context explains why China's Emissions Trading Scheme (ETS) has become a pivotal instrument for achieving its climate commitments. By the end of 2023, the national carbon market completed its second compliance period, with a cumulative transaction volume reaching 24.919 billion yuan [2], demonstrating enhanced market liquidity compared to the pilot phase, notwithstanding persistent regional discrepancies in policy outcomes that demand systematic investigation.
China's carbon trading system has implemented a phased development strategy, initiating pilot programs followed by nationwide expansion. Since the approval of eight pilot markets (including Beijing and Guangdong) in 2011, transaction categories have expanded to cover 24 industries such as power and steel. The national unified carbon market, launched in July 2021 with initial coverage of the power sector, marked a new phase of institutional development. Notably, while emission rights trading mechanisms rooted in property rights theory were expected to optimize resource allocation efficiency through market incentives and technological innovation [3], observed outcomes have diverged from theoretical predictions. For instance, the "4+3+1" emission trading pilots initiated in 2002 underperformed due to imperfect policy frameworks, market fragmentation, and transaction channel blockages [4]. This institutional paradox persists in carbon trading: current pilot markets exhibit significant heterogeneity in trading activity, while concerns remain about policy transmission efficiency during the national market’s phased expansion. These dual challenges raise critical questions: Can carbon trading policies generate spatially universal emission reduction effects amid coexisting regional factor endowment disparities and policy implementation flexibility? Crucially, does an inherent linkage exist between regional carbon efficiency divergence and market operational characteristics under a unified institutional framework? Addressing these issues holds practical significance for evaluating policy effectiveness and refining market architecture.
Addressing existing research limitations, this study advances both methodological and policy application dimensions. Methodologically, we develop an integrated DID-SCM framework: the Difference-in-Differences (DID) approach isolates average treatment effects of policy intervention, while the Synthetic Control Method (SCM) constructs counterfactual control groups to capture individual heterogeneous effects, enabling systematic evaluation of both aggregate impacts and regional differential responses to the pilot policy. Empirically, we employ a non-radial Slacks-Based Measure (SBM) model to calculate provincial total-factor carbon efficiency across China's 30 provinces, establishing a robust quantitative foundation for policy effect identification.
The study's academic contributions are threefold. First, methodologically, it transcends the limitations of conventional mean-effect policy evaluation through the DID-SCM hybrid framework, revealing spatially heterogeneous responses to carbon trading policies that inform differentiated institutional design. Second, policy-wise, it proposes regional coordination optimization pathways through matching analyses between allowance allocation mechanisms and market operational characteristics, offering operational institutional design propositions for national carbon market development. Third, theoretically, it bridges environmental economics with institutional design theory by empirically validating the spatial dependence of policy effectiveness on regional factor endowments. These findings provide dual theoretical and practical implications for optimizing environmental rights trading mechanisms.
2. Literature review
2.1. Carbon emission efficiency measurement
Before determining the concept of carbon emission efficiency, it is first necessary to clarify the definition of efficiency. Although definitions of efficiency vary across disciplines, generally speaking, efficiency can be defined as the output or gain obtained based on certain costs (economic, technical, inputs, etc.). The measurement theory of carbon emission efficiency is rooted in the production efficiency analysis framework, and its conceptual evolution has undergone a leapfrog development from single-factor indicators to a total-factor evaluation system. Farrell pioneeringly decomposed efficiency into technical efficiency and allocative efficiency, laying a methodological foundation for environmental efficiency research [5]. The core of technical efficiency lies in measuring whether a production unit can minimize inputs for a given output. This concept was extended by Solow to the Total Factor Productivity (TFP) theory, emphasizing the contribution of technological progress to output [6]. As environmental constraint issues became prominent, Zaim and Taskin first incorporated carbon emissions as an undesirable output into the environmental efficiency evaluation framework, constructing a comprehensive measurement model [7]. This breakthrough facilitated the shift in carbon emission efficiency research from a single dimension to systematic evaluation.
At the methodological level, Data Envelopment Analysis (DEA) has become a mainstream tool due to its non-parametric nature and advantage in handling multiple inputs and outputs. Zofio et al. proposed the non-radial SBM (Slack-Based Measure) model by improving the radial measurement bias of traditional DEA models, significantly enhancing the discriminatory power and interpretability of efficiency values [8]. Other scholars further optimized based on this. Wang et al. introduced a dynamic performance index to capture the temporal evolution characteristics of carbon emission efficiency [9]. Ma et al., through the definition of Pareto optimality, characterized carbon emission efficiency as a dual-objective equilibrium state balancing the maximization of economic output and the minimization of carbon emissions [10]. Many empirical studies have also revealed significant spatial heterogeneity in China's carbon emission efficiency. Wei et al. conducted an in-depth study on the carbon emission efficiency of various provinces in China. They found that R&D investment, energy prices, and public investment have an equilibrium relationship with carbon emission efficiency and all exhibit positive impacts [11]. Zhao et al. used the parametric Stochastic Frontier Analysis (SFA) model to analyze the carbon emission efficiency situation in Shanxi Province over the past 15 years. The results indicate that Shanxi Province has the lowest efficiency compared to other central provinces, and its carbon emission efficiency has shown a gradual decreasing trend [12]. Wu et al. employed the DEA-Malmquist index decomposition and Tobit model to measure the agricultural carbon emission efficiency of 31 provinces in China. The results demonstrate that only 7 provinces were in a decreasing trend of carbon emission efficiency, while the remaining provinces all exhibited efficiency improvement [13].
2.2. Carbon trading policy effects
The development of carbon emission trading originated from the theory of pollution rights trading, which was proposed by American economist J.H. Dales in 1968. This theory aims to transform environmental resources into tradable commodities through the form of permits, thereby achieving legal control over pollutant emissions. After this theory was proposed, it was first implemented in the United States in 1977 through the Clean Air Act legislation, which encouraged companies to participate in the market trading of pollution rights. Carbon emission rights can be defined as the right granted to different types of entities, under legal constraints, to emit greenhouse gases into nature, stemming from the essential needs for their survival and development. In today's context of increasingly prominent climate issues, this right can also be regarded as a resource. One of the purposes of establishing a carbon emission trading market is to enable this "resource" to be circulated or traded.
Currently, there is no single, standardized model for carbon emission trading systems internationally, nor are there established international normative standards. Many countries or organizations have built or are building their own carbon trading markets or emission trading systems according to their specific characteristics. The European Union Emissions Trading System (EU ETS), as one of the most mature carbon trading markets, has been widely studied by scholars. The research often revolves around the allocation rules, auction mechanisms, and carbon trading prices of the carbon trading system. Abrell et al. studied the impact of the EU ETS at the company level. They found that the initial carbon allocations also had a significant impact on carbon reduction. The carbon emission trading system can reduce overall corporate carbon emissions, but it may also negatively affect the profits of companies covered by the system [14]. Hepburn studied carbon auctions within the EU ETS. His research found that increasing the proportion of auctions can, in some aspects, reduce the impact of harmful competition [15]. Jia et al. constructed an econometric model with bilateral corrected dummy variables and found that emission announcements issued by the EU have a volatile impact on carbon prices within the EU ETS [16]. Diaz-Rainey et al. studied how energy prices, weather, and relevant policy changes affect New Zealand's emission trading prices, pointing out that the most significant factor affecting trading prices is offset imports [17]. Rosendahl's research found that the new rules in the EU carbon market will fundamentally change its nature, temporarily puncturing the waterbed, and impacting greenhouse gas reduction under overlapping policies [18].
Domestic research in China focuses on multi-dimensional evaluation of the effects of pilot policies. Huang et al. used the DID method and found that the carbon trading policies in six pilot provinces and cities indeed achieved environmental dividends, with significant policy effects on CO2 emission reduction in the pilot areas [19]. Liu et al. used the Synthetic Control Method to study the emission reduction effects of carbon emission trading pilots. The results show regional heterogeneity in the emission reduction effects among pilot provinces [20]. Zhou et al. used panel data from 273 prefecture-level cities in their study, exploring the impact of carbon trading policy on urban-level carbon emission intensity through the Propensity Score Matching-Difference-in-Differences (PSM-DID) method. The results indicate that the pilot policy effect becomes increasingly significant over time [21]. Wang et al. also used the PSM-DID method to evaluate the environmental and economic effects of carbon emission trading pilot policies in China. Their research found that carbon trading can significantly reduce carbon emissions in pilot areas, but due to the short pilot period, the impact on the economy is not significant, and the Porter Hypothesis cannot be verified at present [22].
Overall, scholars have achieved significant results in the fields of carbon emission efficiency and carbon trading, with the research content and dimensions continuously deepening over time. Regarding carbon emission efficiency, research methods typically employ DEA or SFA models to construct efficiency evaluation systems. The evaluation dimensions are generally provinces or industries. Research objects directly use single-factor carbon emission efficiency indicators such as carbon intensity and carbon productivity to explore the impact of policies on environmental and economic sustainable development. In terms of carbon trading, scholars mostly base their research on their national conditions, studying the feasibility, market operation mechanisms, and carbon prices of carbon trading markets, or researching the rules and regulations of carbon trading systems, or analyzing various elements of the market.
From the perspective of existing literature, domestic and international studies less frequently involve the impact of carbon trading policy on carbon emission efficiency. Furthermore, there is not much research combining regional aspects with carbon emission efficiency, and the regional division is relatively coarse. Therefore, studying China's regional carbon emission efficiency under the background of carbon trading policy holds certain value.
3. Methodology and data
3.1. DEA-SBM framework
DEA serves as a powerful mathematical programming technique for evaluating the relative efficiency of decision-making units (DMUs), with extensive applications widely in operations research, management science, and econometrics. Traditional DEA models (e.g., CCR, BCC) suffer from measurement biases by neglecting input-output slack adjustments and angular orientation effects [23-24]. This limitation becomes particularly critical when accounting for environmental externalities, as real-world production processes inevitably generate undesirable outputs—such as greenhouse gas emissions and wastewater—that require simultaneous minimization with desirable output maximization. The non-radial SBM model proposed by Tone resolves these issues by incorporating slack variables into efficiency calculations, enabling comprehensive evaluation under environmental constraints [25]. Unlike conventional DEA, which prioritizes maximizing outputs while minimizing inputs, the SBM model explicitly incorporates undesirable outputs. Consider \( n \) DMUs with \( m \) inputs, \( {s_{1}} \) desirable outputs, and \( {s_{2}} \) undesirable outputs, represented by vectors \( x∈ R⁽ᵐ⁾ \) , \( {y^{g}}∈ R⁽ˢ¹⁾,{y^{b}}∈ R⁽ˢ²⁾ \) respectively. Under constant returns to scale, the production possibility set P is defined as:
\( Ρ=\lbrace (x,{y^{g}},{y^{b}})|x≥Xλ,{y^{g}}≤{Y^{g}}λ,{y^{b}}≤{Y^{b}}λ,λ≥0\rbrace \) (1)
\( { ρ^{*}}=min{\frac{1-\frac{1}{m}\sum _{i=1}^{m}\frac{s_{i}^{-}}{{x_{i0}}}}{1+\frac{1}{{s_{1}}+{s_{2}}}(\sum _{r=1}^{{s_{1}}}\frac{s_{r}^{g}}{y_{r0}^{g}}+\sum _{r=1}^{{s_{2}}}\frac{s_{r}^{b}}{y_{r0}^{b}})} } \) (2)
\( {x_{0}}=Xλ+{s^{-}} \) (3)
\( y_{0}^{g}={Y^{g}}λ-{s^{g}} \) (4)
\( y_{0}^{b}={Y^{b}}λ+{s^{b}} \) (5)
\( {s^{-}}≥0, {s^{g}}≥0,{s^{b}}≥0,λ ≥0 \) (6)
Where \( {s^{-}} \) , \( {s^{b}} \) , and \( {s^{g}} \) denote input excess, undesirable output surplus, and desirable output shortfall respectively. The efficiency score \( {ρ^{*}} \) \( ∈ \) [0,1] decreases monotonically with slack variables, measuring the average distance between observed DMUs and the production frontier. A unit achieves full efficiency ( \( {ρ^{*}} \) ≤ 1) only when all slacks vanish ( \( {s^{-}} \) =0, \( {s^{b}} \) =0, \( {s^{g}} \) =0). Values below unity indicate improvement potential through input reduction, desirable output expansion, or undesirable output mitigation.
3.2. Difference-in-Differences model
Causal inference refers to methodologies that investigate cause-effect relationships between variables, requiring temporal precedence of causes, covariation between causes and outcomes, and elimination of confounding factors. As classical causal inference approaches, both DID and SCM are employed in this study. The DID framework is particularly suitable for policy effect evaluation, simulating randomized experiments to establish causal relationships when random assignment is infeasible.
This research applies the DID model to examine the impact of carbon trading policies on emission efficiency in pilot regions, specifically testing whether the policy significantly enhances regional efficiency values. Based on provincial participation in carbon trading pilots, the 30 provinces are categorized into treatment and control groups. The treatment group includes Shanghai, Beijing, Chongqing, Hubei, Tianjin, and Guangdong (with Shenzhen merged into Guangdong due to data availability issues). Fujian Province, which initiated its pilot program later, is included in the control group. Although most pilot carbon markets commenced operations in 2013-2014, this study selects 2011 as the policy implementation year to account for preparatory measures following the State Council's official pilot program announcement. The two-way fixed effects model is specified as:
\( {CE_{it}}={α_{0}}+{α_{1}}{policy_{i}}*{post_{t}}+β{X_{it}}+{u_{i}}+{v_{t}}+{ε_{it}} \) (7)
In the above equation, i denotes the province, t denotes time, and \( {CE_{it}} \) represents carbon emission efficiency. The term \( {policy_{i}}*{post_{t}} \) is the interaction term (often referred to as the policy dummy variable). It is equal to 1 if province i implemented the pilot policy in year t (i.e., province i is a pilot province and the year is in the post-policy period), and 0 otherwise. \( {α_{1}} \) is the coefficient of the interaction term, which represents the net effect of the carbon trading policy on carbon emission efficiency in the pilot areas. \( {X_{it}} \) represents a vector of control variables, and β is the corresponding vector of coefficients. The magnitude of each coefficient in β indicates the strength of the corresponding control variable's impact on carbon emission efficiency. \( {u_{i}} \) represents the individual fixed effects (for province i), and \( {v_{t}} \) represents the time fixed effects (for period t). These fixed effects control for unobserved time-invariant heterogeneity across provinces ( \( {u_{i}} \) ) and common shocks affecting all provinces in a given year ( \( {v_{t}} \) ), thereby making the regression estimation more precise and robust, and capturing more information. \( {ε_{it}} \) is the random error term.
3.3. Synthetic Control Method
Since the DID method can only estimate the overall effect of the carbon trading policy and cannot distinguish the specific policy effect for each pilot region, SCM is chosen for further analysis. This approach can avoid the bias caused by subjective selection of the control group. Drawing upon the Synthetic Control approach proposed by Abadie et al. [26], for this study, we assume the observed sample consists of the carbon emission efficiency trends of J+1 provinces. Among these, one province was affected by the carbon trading pilot policy and is designated as the treated group, while the other J unaffected provinces are considered the control group (or donor pool). Carbon emission efficiency values are observed for T periods. Let \( P_{it}^{I} \) denote the carbon emission efficiency of province i at time t in the absence of the pilot policy, and \( P_{it}^{I} \) be the carbon emission efficiency of province i at time t under the pilot policy.
The model is specified as: \( {P_{it}} \) = \( P_{it}^{N} \) + \( {D_{it}}{α_{it}} \) . For a pilot province (treated province), \( P_{it}^{N} \) represents the carbon emission efficiency had the pilot policy not been implemented. \( {D_{it}} \) is a dummy variable, taking the value 1 if province i is subject to the pilot policy at time t (i.e., it is the treated province in the post-treatment period), and 0 otherwise. For a non-pilot province (untreated province), \( {P_{it}} \) = \( P_{it}^{N} \) . Assume one province is affected by the policy after T0. When t > T0, the impact of policy intervention can be regarded as \( {α_{it}}=P_{it}^{I}-P_{it}^{N}={P_{it}}-P_{it}^{N} \) . Since \( P_{it}^{N} \) represents a counterfactual outcome that did not occur, it is unobservable in the real world. Therefore, the study needs to construct a counterfactual variable:
\( P_{it}^{N}={δ_{t}}+{θ_{t}}{Z_{i}}+{λ_{t}}{μ_{i}}+{ε_{it}} \) (8)
For the above equation (3), \( P_{it}^{N} \) is the counterfactual variable that needs to be constructed, representing the carbon emission efficiency of the pilot province had it not received the policy shock. Here, \( {δ_{t}} \) represents the time trend, which is related only to time. \( {Z_{i}} \) represents control variables (covariates), and \( { θ_{t}} \) is the coefficient vector for the control variables. The criteria for selecting control variables are a set of observable variables that affect the outcome variable (carbon emission efficiency) besides the policy shock, commonly including industrial structure, energy structure, etc. \( {λ_{t}} \) are unobservable common factors, \( {μ_{i}} \) are unobservable province-specific factors, and \( {ε_{it}} \) is the random error term, representing unobserved temporary shocks for each province, with a mean of zero. Through weighted simulation, we analyse the J provinces that did not implement the pilot policy to construct a synthetic control group that matches the pre-treatment characteristics of the treated group.
This involves solving for a weight vector \( {W^{*}} \) such that it minimizes the difference between the pre-treatment characteristics of the treated unit and the weighted average of the untreated units:
\( \sum _{j=2}^{J+1}w_{j}^{*}{P_{jt}}={P_{11}},…,\sum _{j=2}^{J+1}w_{j}^{*}{P_{j{T^{0}}}}={P_{1{T^{0}}}} ,\sum _{j=2}^{J+1}w_{j}^{*}{Z_{j}}={Z_{1 }}and {w_{2}} \) + \( … \) + \( {w_{J+1}} \) =1.(9)
Using the STATA package synth developed by Abadie et al. [26], the goal is to find \( {w^{*}} \) that satisfies specific conditions (optimal weights matching pre-treatment characteristics), thereby allowing for the estimation of the treatment effect as the difference between the actual outcome of the treated unit and the outcome of the synthetic control.
3.4. Data sources and preprocessing
3.4.1. Data sources for carbon emission efficiency
In the study of carbon emission efficiency, this paper selects 30 provinces (municipalities and autonomous regions) in mainland China as the research subjects, excluding Tibet due to long-term data gaps. The time span is set from 2000 to 2019. This choice considers several factors: On the one hand, the period from 2011 to 2019 fully covers the entire stage of carbon trading pilot programs, from policy issuance to market operation, making it conducive to accurately analyzing policy effects. On the other hand, since the national carbon market began operation in 2021, which led to systematic changes in the policy environment, a clear distinction is necessary to avoid the intermingling of different policy effects. Additionally, the COVID-19 from 2020 to 2022 caused significant disruptions to economic activities, with carbon emission data being heavily influenced by non-policy factors, which could undermine the robustness of the empirical results.
Accurately assessing carbon emission efficiency relies on measuring the distance between decision-making units and the production frontier. The appropriate selection of input and output variables plays a decisive role in determining the final efficiency levels. The number of input-output variables should be less than one-third of the decision-making units, and the variables should be correlated, meaning that an increase in inputs should lead to an increase in outputs. Based on previous research by scholars on the selection of carbon emission efficiency indicators, this paper elaborates on the input and output variables as follows:
In terms of input variables, capital is fundamental to production activities, and the perpetual inventory method is used to estimate the capital stock. The formula is as follows:
\( {K_{it}}={K_{it-1}}(1-{δ_{it}})+{I_{it}} \) (10)
where \( {K_{it}} \) represents the capital stock of province i in year t, \( {δ_{it}} \) is the depreciation rate of fixed assets, and \( {I_{it}} \) represents the total fixed asset formation in the current period. The initial capital stock is determined by dividing the fixed capital formation total of 2001 by the average depreciation rate of 10.96% [27]and the average investment growth rate between 2001 and 2005. The original data comes from the China Statistical Yearbook and provincial statistical yearbooks. Labor input is measured by the number of employed persons at the end of each year in each province, with data sourced from provincial statistical yearbooks. Energy input is represented by the total energy consumption, reflecting the regional energy consumption level. Data is obtained from the China Energy Statistical Yearbook.
In terms of output variables, the desired output is the regional GDP. Since the nominal GDP in the statistical yearbook has not been adjusted for price factors, this paper uses the GDP index based on the 2000 regional GDP to calculate the actual GDP of each region. The original data is sourced from the National Bureau of Statistics. As for carbon emissions, since official provincial-level carbon dioxide emission data is not published by the Chinese government, this paper refers to the provincial emission inventory created by the Tsinghua University research team, available in the CEADS.
3.4.2. Data sources for carbon emission efficiency
In exploring the policy effects, the core explanatory variable consists of the interaction term \( {policy_{i}}*{post_{t}} \) . If a province is a carbon trading pilot province (including Beijing, Tianjin, Shanghai, Guangdong, Hubei, and Chongqing, with data from Shenzhen being included under Guangdong due to missing data, and Fujian is excluded since it began its pilot in 2016), then \( {policy_{i}} \) =1, otherwise 0. The policy shock is defined as the 2011 announcement of the carbon trading pilot by the State Council, and the post-policy period is defined as \( {post_{t}} \) =1 starting from 2011, otherwise 0. The dependent variable is total carbon emission efficiency \( {CE_{it}} \) .
To minimize the endogenous problems caused by omitted variables and ensure the independence of assumptions, this paper carefully selects a series of control variables as follows: The industrial structure significantly affects provincial carbon emissions and energy dependence. Given that the secondary industry contains many high-emission enterprises, this paper quantifies industrial structure using the ratio of GDP from the secondary industry to the total regional GDP. The energy structure reflects the composition of energy consumption, and given the significant proportion of coal consumption in China, this paper uses the share of coal consumption in total energy consumption to represent the energy structure. Environmental regulation is measured by the ratio of actual industrial pollution control investment to local GDP, as proposed by Cai et al [28]. Economic development level has a dual impact on carbon emission efficiency, as it may lead to high energy consumption due to inefficient economic activities but also improve energy efficiency through infrastructure development. This paper uses the average worker wage of a region as a proxy for economic development level, following the research of Wang et al [29]. Population density affects both labor input and carbon emissions due to the aggregation effect, thereby influencing carbon emission efficiency. Data for each of these variables is sourced as shown in Table 1.
Table 1. Control variables and data sources
Dimension | Unit | Measurement | Original Data Source |
Industrial Structure | % | Share of secondary industry in GDP | National Bureau of Statistics of China |
Energy Structure | % | Coal consumption as percentage of total energy use | China Energy Statistical Yearbook |
Environmental Regulation | % | Industrial pollution control investment as % of GDP | EPS Database |
Economic Development Level | yuan | Average wage of employed workers | China Statistical Yearbook |
Population Density | persons/km² | Resident population per square kilometers | CSMAR |
4. Empirical results
4.1. Analysis of spatiotemporal differences in carbon emission efficiency
Based on the formula (1), the total factor carbon emission efficiency is calculated using Dearun 3.1.1 software. The results of total factor carbon emission efficiency for 30 provinces in mainland China from 2000 to 2019, based on the undesirable SBM model, show that carbon emission efficiency exhibits significant spatiotemporal heterogeneity. Figure 1 shows the national average carbon emission efficiency and its growth rate.
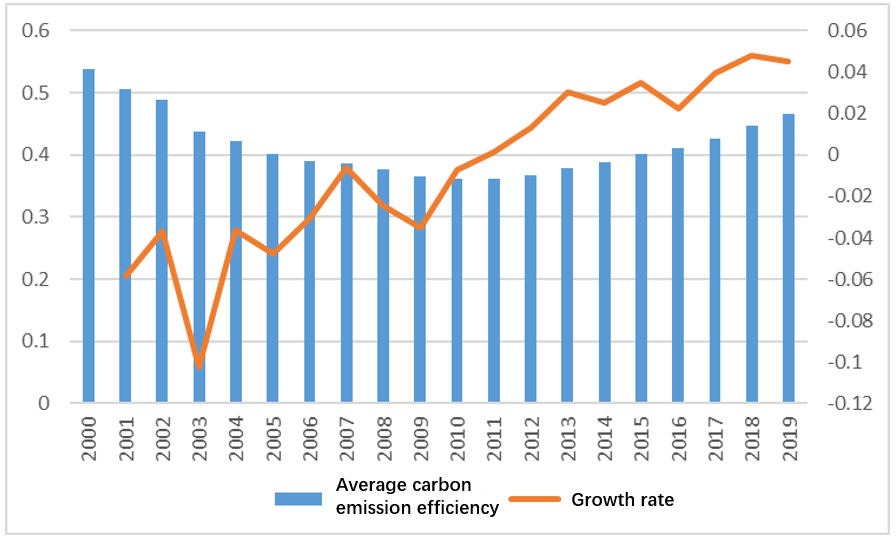
Figure 1. Trends of national average carbon emission efficiency and growth rate
From a national perspective, carbon emission efficiency follows a "U" shaped evolution trajectory, with the efficiency mean decreasing from 0.54 in 2000 to a historical low of 0.36 in 2010, then gradually recovering to 0.47 by 2019, with an annual growth rate of 4.62% by the end of the study period. This phased characteristic is closely related to China’s economic development model transformation: from 2000 to 2010, during the rapid industrialization phase, economic growth heavily relied on heavy industries, which exacerbated environmental externalities. This, combined with the impact of the 2008 global financial crisis on the production system, led to a 2.43% annual decrease in carbon emission efficiency. After 2011, as the supply-side structural reform advanced and clean energy technology applications deepened, the efficiency value entered a period of stable annual growth of 1.36%. The average national carbon emission efficiency over the study period was 0.416, indicating a potential improvement space of 43.4%, highlighting the necessity of continuously promoting industrial structure optimization and green technology innovation systems.
At the provincial level, efficiency differences exhibit significant spatial disparities. Frontier analysis shows that in 2019, Shanghai, Beijing, and Tianjin reached a DEA-efficient state, achieving the optimal balance between economic output and carbon emissions in their factor configuration. Guangdong, as the only non-municipality directly under the central government to repeatedly reach the production frontier, maintained efficiency values above 0.9 from 2000 to 2009, reflecting its leading energy utilization efficiency. Seven provinces, including Fujian and Jiangsu, had average efficiency values higher than the national level, forming a sub-optimal efficiency cluster. In sharp contrast, seven resource-dependent provinces, including Shaanxi and Gansu, had average annual efficiency values below 0.3, with carbon emissions per unit of economic output 3.3 times higher than those in frontier regions. Notably, four provinces, including Liaoning, briefly reached the efficiency frontier between 2000 and 2002, but as the marginal output of capital decreased and carbon emissions grew faster than economic growth, their relative efficiency advantage gradually weakened. This dynamic shift reveals the sensitivity of factor configuration efficiency to regional development paths.
As shown in Figure 2, the carbon emission efficiency across provinces follows diverse dynamic evolution patterns. About two-thirds of the provinces follow a "U"-shaped curve that aligns with the national trend, confirming the overall transformation of the economic development model from factor-driven to innovation-driven growth. Developed regions such as Shanghai and Beijing have steadily improved efficiency through continuous technological innovation and stringent environmental regulations, with efficiency increases of 85.2% and 63.1% respectively from 2000 to 2019. Resource-based provinces, on the other hand, show a continuous decline in efficiency. Five provinces, including Shanxi and Xinjiang, experienced an annual decrease in efficiency of 1.8% to 3.5%, with their energy consumption intensity and carbon emission coefficients 42% and 37% higher than the national averages, highlighting the path dependence dilemma of traditional development models. This diversified evolution pattern reflects the differences in the effectiveness of regional development strategies and reveals the practical need for carbon reduction policies to establish differentiated regulatory mechanisms.
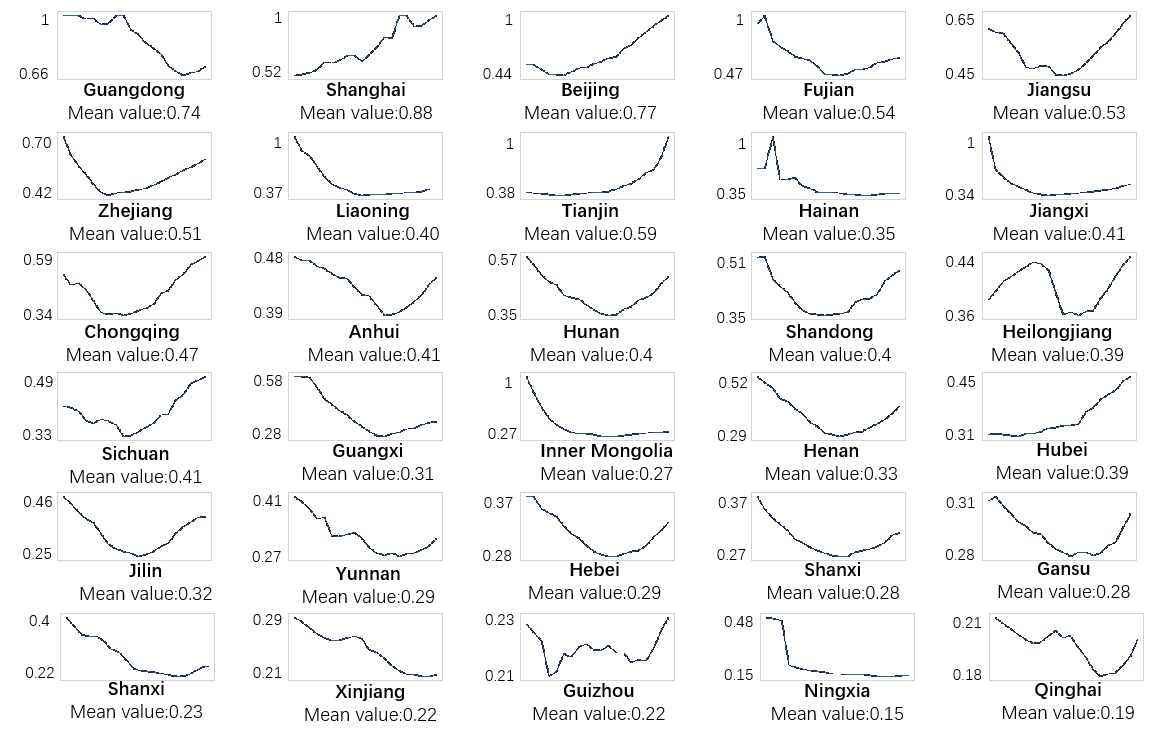
Figure 2. Trends of carbon emission efficiency across 30 provinces
4.2. Analysis of the policy effects of carbon emission trading pilot programs
4.2.1. Parallel trend test
The DID method investigates policy effects through a quasi-natural experiment design. However, an important assumption for using this method is that the treatment group and the control group must maintain approximately similar trends over time before the policy intervention occurs, which is known as the parallel trends assumption. If the treatment and control groups show similar trends prior to the policy shock, the control group’s trend can be used as the "counterfactual" trend for the treatment group, allowing the estimation of the policy shock's effect on the treatment group. In reference to previous literature, this paper performs a parallel trend test, and the results are as follows:
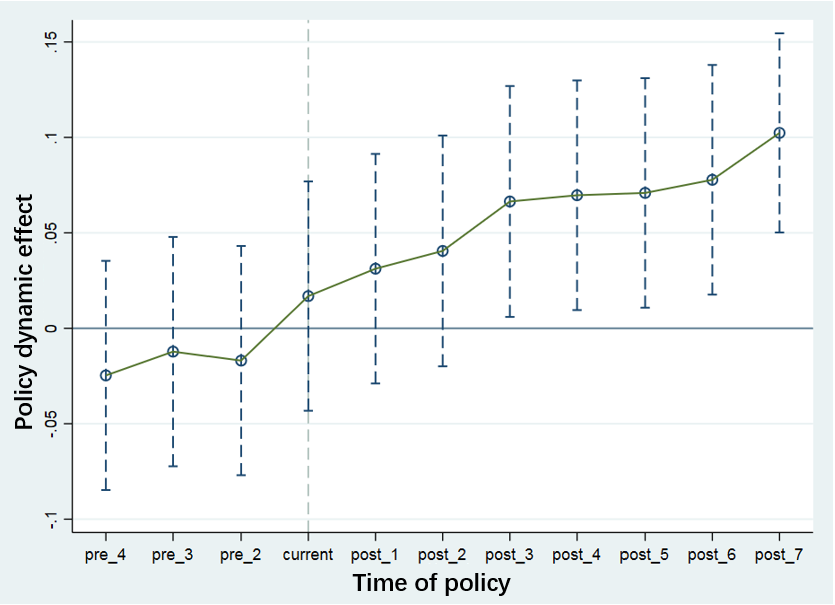
Figure 3. Parallel trend test
Figure 3. presents the dynamic effect test of parallel trends. The line represents the regression coefficients of the time and group (treatment and control) interaction term, with the vertical dashed line representing the confidence interval. The policy shock is set to occur in 2011, the year the policy was announced. As shown in the figure 3, in the four years preceding the policy announcement, the regression coefficients fluctuated around zero, and the confidence intervals crossed the zero line, indicating that the coefficients were not significant. This suggests that prior to 2011, the trends in carbon emission efficiency for the pilot and non-pilot regions were similar. Following the policy announcement, the interaction term coefficients showed two periods of insignificant changes (post_1 = 2012, post_2 = 2013), but by 2014, the confidence interval no longer crossed zero and exhibited a slowly increasing trend. These results indicate that although the effect of the carbon trading pilot policy intervention experienced a delay, over time, it had a positive and sustained impact, leading to improved carbon emission efficiency.
4.2.2. Main effects
Table 2 presents the regression coefficients obtained using the DID method. The first column shows the regression results for Model (1), which includes both time and individual fixed effects. This corresponds to the regression results for the core explanatory variable (DID). Models (2) to (6) progressively add five control variables to Model (1), namely: industrial structure (IS), energy structure (ES), environmental regulation (ER), economic growth (EG), and population density (PD). During the process of adding control variables, the size and sign of the DID coefficient did not show significant changes, and it remained significant, further verifying the reliability of the experimental results. Based on the regression coefficient of the interaction term (DID), it can be concluded that the carbon emission trading pilot policy effectively improves the carbon emission efficiency in pilot regions.
In Model 6, the coefficient of the core explanatory variable (DID) reaches 0.0921, indicating that after the implementation of the carbon trading pilot policy, the total factor carbon emission efficiency in the pilot regions improved significantly compared to non-pilot regions. The total efficiency value increased by 0.0921 on average, and the DID coefficient was significant at the 1% level.
The regression coefficients of the control variables reveal the mechanisms of various influencing factors. The coefficients for industrial structure advancement (proportion of secondary industry) and energy structure decarbonization (coal consumption share) are -0.00332 and -0.323, respectively, both of which are significantly negative at the 1% level. These results reflect the suppressive effects of traditional development models on carbon efficiency. Specifically, a 1% increase in the share of the secondary industry leads to a 0.33% reduction in efficiency, while a 1% increase in coal dependence causes a 3.23% decrease in efficiency, highlighting the persistent impact of high-carbon lock-in effects in industrial structures and energy systems.
In contrast, the intensity of environmental regulation (pollution control investment) has a significant positive effect at the 5% level, with a marginal effect of 0.144, suggesting that end-of-pipe treatment investments can generate carbon reduction co-benefits through technological improvements. The positive elasticities of economic development level (log of wage) and population density are 0.144 and 0.17, respectively, confirming that the technological spillover effects of economic agglomeration and the human capital advantages promote the diffusion of green technologies, in line with the evolution of the Environmental Kuznets Curve.
Table 2. DID regression coefficients
(1) | (2) | (3) | (4) | (5) | (6) | |
VARIABLES | CE | CE | CE | CE | CE | CE |
did | 0.159*** | 0.135*** | 0.107*** | 0.109*** | 0.112*** | 0.0921*** |
(0.0173) | (0.0171) | (0.0130) | (0.0130) | (0.0130) | (0.0152) | |
IS | -0.00602*** | -0.00312*** | -0.00327*** | -0.00378*** | -0.00332*** | |
(0.000905) | (0.000757) | (0.000754) | (0.000791) | (0.000808) | ||
ES | -0.340*** | -0.340*** | -0.335*** | -0.323*** | ||
(0.0550) | (0.0546) | (0.0545) | (0.0544) | |||
ER | 0.0530** | 0.0522** | 0.0483** | |||
(0.0205) | (0.0205) | (0.0204) | ||||
EG | 0.108** | 0.144*** | ||||
(0.0524) | (0.0541) | |||||
PD | 0.170** | |||||
(0.0689) | ||||||
Constant | 0.378*** | 0.654*** | 0.653*** | 0.648*** | -0.464 | -1.796** |
(0.00378) | (0.0417) | (0.0441) | (0.0439) | (0.542) | (0.763) | |
Observations | 600 | 600 | 510 | 510 | 510 | 510 |
R-squared | 0.805 | 0.819 | 0.895 | 0.897 | 0.898 | 0.899 |
*** p<0.01, ** p<0.05, * p<0.1
It is noteworthy that although the coefficient for industrial structure is statistically significant, its economic significance is relatively weak, indicating that simply adjusting industrial proportions has limited potential for improving carbon efficiency. Policies must also combine with advancements in production technologies to achieve a synergistic effect.
4.2.3. Robustness test
To further ensure the robustness of the key conclusions in this chapter, this study aims to eliminate the potential influence of various confounding factors on the regression results. Several approaches are employed to test the stability and reliability of the findings.
(a) Placebo Test
A common method for conducting a placebo test in the difference-in-differences (DID) approach is to randomly create a treatment group and observe whether the coefficient of the "policy dummy variable" is significant. Specifically, this study involves 30 provinces and cities, including 6 pilot provinces for the carbon trading policy and 24 non-pilot provinces. The placebo test requires randomly selecting 6 provinces from the 30 to serve as the treatment group, assuming that these regions implemented the carbon trading pilot while the remaining provinces are considered the control group. The baseline regression is then performed with the policy shock time point set to 2011. The random process is repeated 500 times using STATA17, and the regression coefficients and p-values are retained. The results of the placebo test are shown in Figure 4. The results indicate that the baseline regression passes the placebo test, demonstrating that the regression results are robust and not due to random factors.
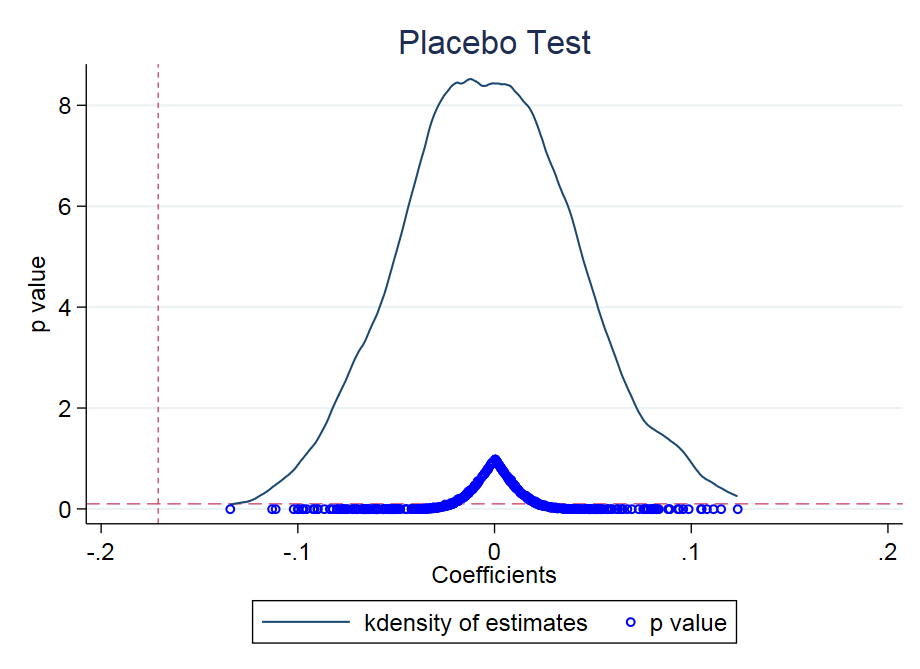
Figure 4. Placebo test
(b) Exclusion of Other Policy Interference
In 2007, the Ministry of Finance, Ministry of Ecology and Environment, and the National Development and Reform Commission jointly approved emission trading pilot programs for 11 provinces, including Jiangsu, Zhejiang, and Tianjin. These emission trading programs may affect carbon emissions in the pilot regions, thereby influencing the experimental results. To address this, this section excludes the 11 pilot provinces from the sample and re-estimates the regression using the DID method. The regression coefficients are shown in Table 3(1), and the coefficient of the core explanatory variable is significantly different from zero at the 1% level. This suggests that the improvements in carbon emission efficiency in the pilot regions can be attributed to the carbon trading policy rather than the emission trading policy.
(c) Exclusion of Special Samples
On December 22, 2016, Fujian became the eighth province to officially launch a carbon trading pilot. Sichuan also officially initiated its carbon market in the same year, making it the first non-pilot province with a nationally recognized carbon trading institution. Given that these two samples may affect the calculation results, they were removed, and the regression was recalculated. The regression coefficients are shown in Table 3(2), where the DID coefficient is significant at the 1% level, and other control variables exhibit stable coefficient signs and magnitudes. This further confirms the robustness of the regression results.
(d) Shortening the Sample Period
In 2015, the Chinese government issued the Nationally Determined Contribution (NDC) document to address climate change, which explicitly stated that China would strive to peak carbon dioxide emissions by 2030. Given that this event occurred after the initial period of the study and the country faced more stringent emission reduction pressures, it may have led to increased government intervention. Therefore, this section shortens the sample period from 2000–2019 to 2006–2015. The results are presented in Table 3(3). As with the other robustness tests, the coefficient of the core explanatory variable (DID) remains significant at the 5% level, reinforcing the robustness and reliability of the baseline estimations. However, the coefficients for control variables such as environmental regulation (ER) and industrial structure (IS) were not significant after shortening the sample period. A possible reason for this is that the shortened window may not have allowed sufficient time for the policy to affect the second industrial structure and pollution control investments in the pilot regions.
Table 3. Robustness checks for the DID estimation
(1) | (2) | (3) | |
VARIABLES | CE | CE | CE |
did | 0.0698** | 0.0908*** | 0.0384** |
(0.0289) | (0.0156) | (0.0157) | |
IS | -0.00504*** | -0.00357*** | -0.00171 |
(0.00105) | (0.000844) | (0.00107) | |
ES | -0.422*** | -0.299*** | -0.196** |
(0.0739) | (0.0564) | (0.0775) | |
ER | 0.0343 | 0.0525** | 0.0277 |
(0.0267) | (0.0211) | (0.0210) | |
EG | 0.295*** | 0.133** | 0.200*** |
(0.0826) | (0.0556) | (0.0673) | |
PD | 0.336*** | 0.199*** | 0.310*** |
(0.106) | (0.0708) | (0.0944) | |
Constant | -4.101*** | -1.836** | -3.265*** |
(1.100) | (0.781) | (0.926) | |
Observations | 323 | 476 | 300 |
R-squared | 0.909 | 0.899 | 0.941 |
*** p<0.01, ** p<0.05, * p<0.1
4.3. Synthetic control method
4.3.1. Synthetic province-city fitting weight allocation
The synthetic control model requires the use of control group samples to construct a counterfactual virtual pilot region with a high degree of similarity to the treatment group provinces and cities in terms of carbon emission efficiency. Only if the carbon emission efficiency development trends of the "real region" and the "synthetic region" align before the policy shock, can the counterfactual trends simulated after the policy shock be persuasive. Based on this, this study incorporates control variables into the model and uses Stata 17 software to select high-fitting samples from 24 non-pilot provinces and cities, with the fitting weight distribution for each province and city shown in Table 4.
Table 4. Weights assignment for synthetic Chongqing
Synthetic provinces | Provincial Contributions to the Synthetic Counterfactual | ||||
Chongqing | Region | Sichuan | Jiangxi | Zhejiang | Guizhou |
Weight | 0.222 | 0.081 | 0.434 | 0.262 | |
Hubei | Region | Hebei | Zhejiang | Guizhou | |
Weight | 0.021 | 0.51 | 0.469 | ||
Fujian | Region | Jiangsu | |||
Weight | 1 | ||||
Tianjin | Region | Inner Mongolia | Xinjiang | Jiangsu | Zhejiang |
Weight | 0.43 | 0.157 | 0.189 | 0.223 | |
It should be noted that Beijing, Shanghai, and Guangdong do not meet the conditions for synthetic control. According to the synthetic results, the variable differences between the synthetic regions and real regions for these three provinces are too large, far exceeding the 0-30% difference range specified in Abadie [26]. Based on the analysis of data and actual conditions, the poor fitting results are attributed to the significant differences between Beijing, Shanghai, and Tianjin and other provinces in terms of carbon emission efficiency, economic development level, energy structure, and industrial structure. Specifically, Guangdong’s total factor carbon emission efficiency has repeatedly reached 1, and Beijing and Shanghai have consistently ranked among the top in the country. Provinces in the "candidate pool" find it difficult to match such high carbon emission efficiency levels through weighted combinations. Additionally, Beijing, Shanghai, and Guangzhou are the most developed regions in China, with much higher economic development levels and average worker salaries compared to other regions. From the perspective of energy structure, these three provinces began transitioning their energy structure early, promoting new energy, particularly Beijing and Guangdong, where coal consumption in 2019 accounted for only 1.8% and 14%, respectively, far below the national average. In terms of industrial structure, these regions have also been early adopters of industrial transformation, shifting their focus toward high-tech industries represented by the tertiary sector. Due to these reasons, other regions cannot align with Beijing, Shanghai, and Guangdong in terms of carbon emission efficiency and control variables, leading to the inability to form a suitable weight combination in the fitting process. Thus, the synthetic control method is not appropriate for evaluating the policy effects of carbon trading pilots in these three provinces. This result is consistent with the findings of Liu and Lu[20][30]. Given the uniqueness of the development and carbon emission efficiency of these three provinces, the next section will not analyse the carbon trading pilot policy effects in these regions.
4.3.2. Synthetic control results
The carbon emission efficiency trends of Tianjin, Chongqing, Hubei, and Fujian compared with their synthetic counterparts are shown in Figure 5. The dashed vertical line represents the policy shock year. The weighted synthetic provinces should meet the requirement that, before the policy shock, the synthetic results closely align with the real results, which can be interpreted in the graph as the two lines to the left of the dashed line following similar patterns. Only if this condition is met can the synthetic result be considered as a representation of the real region's carbon emission efficiency variation without the influence of the carbon trading policy. Therefore, the degree of difference between the real pilot and synthetic pilot regions to the right of the dashed line can indicate the impact of the carbon trading policy on carbon emission efficiency. The larger the difference, the more significant the policy's effect on the region's carbon emission efficiency.
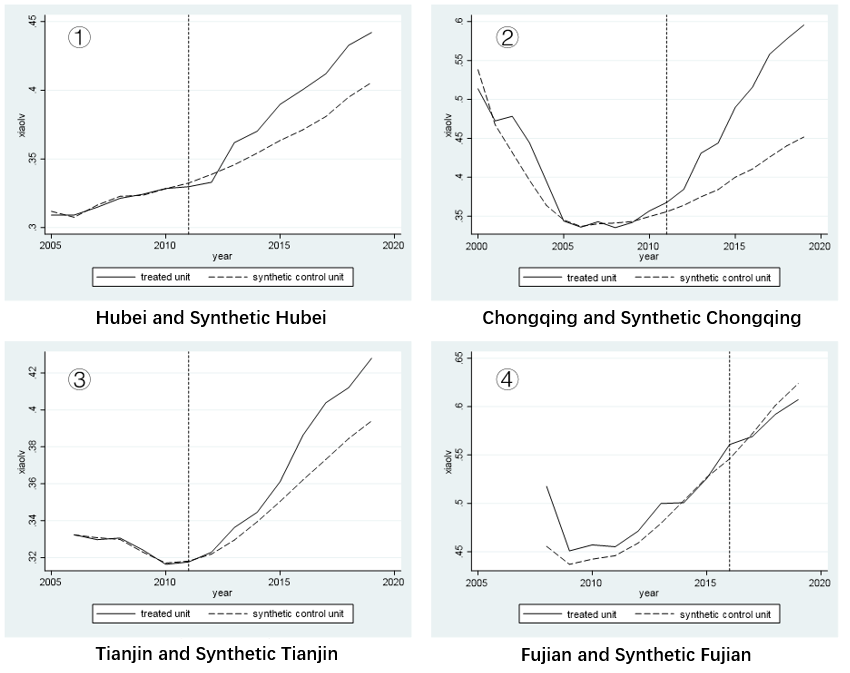
Figure 5. Synthetic control results: carbon emission efficiency trends
From the synthetic control results, the carbon emission efficiencies of Chongqing, Hubei, and Tianjin began to diverge from their synthetic counterparts in 2011, indicating that the carbon trading policy had an effect on carbon emission efficiency from the year the policy was announced. The synthetic results further validate that the carbon trading pilot policy had a positive impact on carbon emission efficiency. Specifically, Chongqing's efficiency difference from its synthetic counterpart saw a significant increase in 2014, the year of policy implementation, and this difference continued to expand over time, with the efficiency rising by nearly 0.15 in 2019. This indicates that the carbon trading pilot mechanism had a significant positive impact on improving carbon emission efficiency in Chongqing. For Hubei, the efficiency improvement became evident around 2013, and the difference in efficiency between Hubei and its synthetic counterpart remained at 0.04 thereafter. Tianjin showed the best fit before the policy shock, but after the policy was implemented, the carbon emission efficiency difference between Tianjin and its synthetic counterpart gradually widened, although the efficiency improvement was not as significant as that of Chongqing.
For Fujian, the difference in carbon emission efficiency between the real and synthetic Fujian before and after the policy shock remained relatively small. In fact, by the end of the sample period, the synthetic Fujian had a higher carbon emission efficiency than real Fujian, suggesting that the carbon trading mechanism had a minimal impact on Fujian's carbon emission efficiency. This result may be attributed to the later initiation of the carbon market in Fujian, along with poor market liquidity, leading to inefficient resource allocation and low market vitality.
5. Conclusions
5.1. Research conclusion
Due to the intensification of global climate change, many countries are striving to promote economic transformation to achieve energy conservation, emission reduction, and low-carbon development. As the world's second-largest economy, it is undeniable that China previously relied heavily on extensive economic growth models. However, in recent years, China has been shifting from rapid development to high-quality development, and how to balance environmental governance with economic growth has become a focal point of social concern. Carbon emission efficiency, as a comprehensive indicator, is crucial for assessing emission reduction effects and economic performance from the perspectives of carbon emissions and economic output. In terms of emission reduction measures, the carbon trading system has gained worldwide attention due to its market-oriented approach to achieving efficient emission reduction, and the 20th National Congress report has proposed "improving the carbon emissions trading system." Based on a review of the literature and relevant theories, this study calculates the total factor carbon emission efficiency of Chinese provinces, analyzes the regional carbon emission efficiency from the provincial level, and further investigates the policy effects of the carbon emissions trading pilot programs using Difference-in-Differences (DID) and Synthetic Control methods. The findings of the study are as follows:
Firstly, from the perspective of provincial regions, economically developed areas such as Beijing, Shanghai, and Guangdong have relatively well-structured industrial systems. These provinces, through the development of high-tech industries and services, can achieve higher economic output with lower carbon emissions by investing in a certain amount of production factors, resulting in higher carbon emission efficiency. In contrast, provinces such as Shanxi, Ningxia, and Gansu are far from the production frontier, exhibiting high levels of carbon emission inefficiency. From the viewpoint of five major regions, carbon emission efficiency decreases sequentially from east to west and from south to north, which generally aligns with the regional economic development trends in China. In terms of dynamic changes, most regions show a "U-shaped" development trend, indicating a gradual shift towards low-carbon and green development. The coefficient of variation of carbon emission efficiency shows that national disparities in carbon emission efficiency are substantial, and the gap has been widening in recent years, indicating an increasing imbalance in regional development.
Secondly, using the DID method to design a quasi-natural experiment, this study explores the impact of the carbon trading pilot policy on carbon emission efficiency. The results reveal that the policy has some lag effects, but over time, it positively promotes carbon emission efficiency and shows a certain degree of persistence. The total factor carbon emission efficiency in pilot regions significantly improved compared to non-pilot regions, and the robustness of the results remained strong even after including control variables. Based on the results from the synthetic control method, it was found that the pilot policy had a noticeable effect in Chongqing, Hubei, and Tianjin. However, the policy effect in Fujian was statistically insignificant, potentially due to late policy implementation and limited market engagement, which was attributed to the late implementation of the carbon trading pilot and the relatively low market activity in the region.
Thirdly, regression results indicate that factors such as average employee salary, population density, and pollution control investment have a positive impact on improving the total factor carbon emission efficiency in pilot regions. On the other hand, the increasing share of GDP in the secondary industry and the rising coal consumption structure has a suppressive effect on carbon emission efficiency growth. These findings are consistent with those of other scholars.
5.2. Management suggestion
Firstly, tailor policies to local conditions and implement differentiated carbon emission trading systems. Given the significant differences among regions in China in terms of carbon emission efficiency, economic development, industrial structure, and energy structure, when building a national carbon emission trading market, it is necessary to fully consider the heterogeneity of regions, industries, and enterprises. From a regional perspective, for some economically developed areas with a smaller proportion of the secondary industry and an excellent energy structure, stricter carbon emission limits can be set to ensure higher carbon trading prices and fully leverage the market mechanism's functions, thereby encouraging these regions to proactively undergo green transformation. Meanwhile, less developed regions can have their quota restrictions appropriately relaxed to ensure economic development and prevent strict carbon trading systems from hindering economic growth. For different industries and enterprises, restrictions can be imposed based on differences in industry or enterprise scale, technological level, and emission conditions, implementing refined quota measures to avoid a one-size-fits-all policy approach. Under the premise of ensuring the fairness principle of the market mechanism, a differentiated path should be adopted to promote the development of the national carbon trading market and ensure its coordinated and balanced operation.
Secondly, accelerate the construction of the national carbon emission trading market and enhance market activity. According to data from the Chinese government website, as of October 21, 2022, the trading volume of carbon emission rights had reached 196 million tons, with a transaction value of 8.58 billion yuan. Although the overall market operation is relatively stable, due to its small scale and insufficient liquidity, the market activity is relatively low. Therefore, China's carbon trading system has not yet formed a market-based carbon pricing mechanism. Lin et al.'s research also proved that during the pilot stage of the carbon trading market; the policy effect was mainly generated through government intervention rather than the market mechanism [31]. Therefore, during the operation of the national carbon trading market, it is necessary to accelerate the construction of various supporting systems based on the experience of pilot markets and fully leverage the incentive role of the market mechanism. On the one hand, the government can formulate more complete laws and policies to ensure the regulations on carbon quotas, trading, and management in the national carbon market. On the other hand, through some incentive policies, such as tax exemptions, some enterprises can be encouraged to actively join the carbon trading market. At the same time, the government also needs to strengthen publicity and education for enterprises and the public to enhance their understanding of the carbon emission trading market and thereby increase market activity.
Thirdly, promote regional coordination and cooperation to ensure the stable development of the carbon trading market. China has a vast territory, and the development of different regions varies significantly. To avoid further widening the regional differences in carbon emission efficiency, a regional emission reduction cooperation system can be established, taking advantage of the geographical proximity to learn from and assist each other, achieving coordinated development of the carbon emission trading market. Local governments should enhance communication and collaboration with neighboring regions, ensuring policy consistency and coordination, and learning from the development experiences of advanced regions to fully leverage the positive effects of the carbon emission trading system and form a well-functioning and highly liquid carbon emission rights trading system.
Fourth, establish a complete regulatory mechanism and enhance information disclosure. Although the carbon trading pilot markets have been operating for a long time, there are still deficiencies in information disclosure by local governments. For instance, carbon trading pilot markets in Shenzhen, Fujian, and Beijing have not disclosed the total annual carbon quotas, and some data information is missing. The government should require all market participants to clearly define the disclosure standards for quotas, enterprise emissions, and transaction records, formulate more standardized laws and regulations, and strengthen supervision over information in the carbon trading market to ensure fair and effective operation of the entire market.
5.3. Limitations and future research directions
The research deficiencies of this article can be summarized into the following three points. First, this article only investigates whether the carbon emission rights pilot policy has an impact on carbon emission efficiency, without paying attention to the transmission path and internal mechanism of such an impact. Second, in terms of sample selection, provincial panel data was used for analysis. In the actual operation of the carbon trading pilot, different pilot regions have different industries included in the emission trading system. This article did not further discuss and analyze the carbon emission efficiency of different industries. Third, the carbon market trading situation in Shenzhen was not considered. Shenzhen was simply classified as part of the carbon market in Guangdong Province, which may lead to errors in the results.
Future research can use more micro-level data to study the policy effects to obtain more rigorous and detailed conclusions. Moreover, as the national carbon emission rights trading market gradually improves, more consideration can be given to starting from the perspective of the national carbon market to study the actual effects of policy implementation and market mechanisms. With the power industry being included in the controlled emission industries, future research can also further explore the coordinated interaction effect between the power market and the carbon emission rights trading market, expanding the theoretical support in this field.
References
[1]. Xu, X. K., & Zhang, S. J. (2025). The carbon emission reduction effect of global carbon market: Market mechanisms and government interventions. International Finance Research, 2025(5), 29-39. https://doi.org/10.16475/j.cnki.1006-1029.2025.05.003
[2]. Wang, K., & Lv, C. (2024). Achievements and prospects of China's carbon market construction (2024). Journal of Beijing Institute of Technology (Social Sciences Edition), 26(2), 16-27. https://doi.org/10.15918/j.jbitss1009-3370.2024.7182
[3]. Wu, P., & Wang, Q. (2010). Economic analysis of emission rights trading. China Population, Resources and Environment, 20(S1), 55–58. https://doi.org/10.3969/j.issn.1008-1968.2014.05.042
[4]. Li, Z., & Wang, J. (2021). Spatial emission reduction effects of China's carbon emission trading: Quasi-natural experiment and policy spillover. China Population, Resources and Environment, 31(01), 26–36. https://doi.org/10.12062/cpre.20200907
[5]. Farrell, M. J. (1957). The measurement of productive efficiency. Journal of the Royal Statistical Society: Series A (General), 120(3), 253–281. https://doi.org/10.2307/2343100
[6]. Solow, R. M. (1957). Technical change and the aggregate production function. The Review of Economics and Statistics, 39(3), 312–320. https://doi.org/10.2307/1926047
[7]. Zaim, O., & Taskin, F. (2000). Environmental efficiency in carbon dioxide emissions in the OECD: A non-parametric approach. Journal of Environmental Management, 58(2), 95–107. https://doi.org/10.1006/jema.1999.0312
[8]. Zofio, J. L., & Prieto, A. M. (2001). Environmental efficiency and regulatory standards: The case of CO2 emissions from OECD Industries. Resource and Energy Economics, 23(1), 63–83. https://doi.org/10.1016/S0928-7655(00)00030-0
[9]. Wang, Q., Zhou, P., & Zhou, D. (2010). Dynamic changes, regional differences, and influencing factors of China's carbon dioxide emission performance. China Industrial Economics, 2010(01), 45–54. https://doi.org/10.19581/j.cnki.ciejournal.2010.01.004.
[10]. Ma, D., Chen, Z., & Wang, L. (2015). Spatial measurement of China's provincial carbon emission efficiency. China Population, Resources and Environment, 25(01), 67–77. https://link.cnki.net/urlid/37.1196.n.20141229.1506.010
[11]. Wei, M., Cao, M., & Jiang, J. (2010). Long-term determinants and convergence analysis of carbon emission efficiency in production. Quantitative & Technical Economics, 27(09), 43–52. https://doi.org/10.13653/j.cnki.jqte.2010.09.001.
[12]. Zhao, G., Li, W., Zhang, R., & Liang, W. (2012). Evaluation of carbon emission efficiency in Shanxi Province based on stochastic frontier model. Resources Science, 34(10), 1965–1971.
[13]. Wu, X., Zhang, J., Tian, Y., & Li, P. (2014). China's provincial agricultural carbon emissions: Measurement, efficiency changes, and influencing factors – Research based on DEA-Malmquist index decomposition method and Tobit model application. Resources Science, 36(01), 129–138.
[14]. Zachmann, G., Ndoye, A., & Abrell, J. (2011). Assessing the impact of the EU ETS using firm level data (No. 579).
[15]. Hepburn, C., Grubb, M., Neuhoff, K., et al. (2006). Auctioning of EU ETS phase II allowances: how and why? Climate Policy, 6(1), 137–160. https://doi.org/10.1080/14693062.2006.9685592
[16]. Jia, J. J., Xu, J. H., & Fan, Y. (2016). The impact of verified emissions announcements on the European Union emissions trading scheme: A bilaterally modified dummy variable modelling analysis. Applied Energy, 173, 567–577. https://doi.org/10.1016/j.apenergy.2016.04.027
[17]. Diaz-Rainey, I., & Tulloch, D. J. (2018). Carbon pricing and system linking: lessons from the New Zealand emissions trading scheme. Energy Economics, 73, 66–79. https://doi.org/10.1016/j.eneco.2018.04.035
[18]. Rosendahl, K. E. (2019). EU ETS and the waterbed effect. Nature Climate Change, 9(10), 734–735. https://doi.org/10.1038/s41558-019-0579-5
[19]. Huang, X., Zhang, X., & Liu, Y. (2018). Has China's carbon trading policy achieved environmental dividends? Economic Review, 2018(06), 86–99. https://doi.org/10.19361/j.er.2018.06.07.
[20]. Liu, C., Sun, Z., & Zhang, J. (2019). Research on the carbon emission reduction policy effects of China's carbon emission trading pilots. China Population, Resources and Environment, 29(11), 49–58.
[21]. Zhou, D., & Liu, Y. (2020). The impact of China's carbon trading pilot policy on urban carbon emission performance and its mechanism. China Environmental Science, 40(01), 453–464. https://doi.org/10.19674/j.cnki.issn1000-6923.2020.0050.
[22]. Wang, H., & Wang, Z. (2021). Policy effects and influencing mechanisms of carbon emission rights trading in China's pilot cities. Urban Development Studies, 28(06), 133–140. https://doi.org/10.3969/j.issn.1006-3862.2021.06.025
[23]. Charnes, A., Cooper, W. W., & Rhodes, E. (1978). Measuring the efficiency of decision making units. European Journal of Operational Research, 2(6), 429–444. https://doi.org/10.1016/0377-2217(78)90138-8
[24]. Banker, R. D., Charnes, A., & Cooper, W. W. (1984). Some models for estimating technical and scale inefficiencies in data envelopment analysis. Management Science, 30(9), 1078–1092. https://doi.org/10.1287/mnsc.30.9.1078
[25]. Tone, K. (2001). A slacks-based measure of efficiency in data envelopment analysis. European Journal of Operational Research, 130(3), 498–509. https://doi.org/10.1016/S0377-2217(99)00140-5
[26]. Abadie, A., Diamond, A., & Hainmueller, J. (2010). Synthetic control methods for comparative case studies: Estimating the effect of California’s tobacco control program. Journal of the American Statistical Association, 105(490), 493–505. https://doi.org/10.1198/jasa.2009.ap08746
[27]. Shan, H. (2008). Re-estimation of China's capital stock K: 1952–2006. Quantitative & Technical Economics, 25(10), 17–31.
[28]. Cai, H., & Xu, Y. (2018). Industrial collaborative agglomeration, trade openness, and haze pollution. China Population, Resources and Environment, 28(06), 93–102.
[29]. Wang, X., & Wang, S. (2022). The impact of carbon trading policy on carbon emission efficiency in China's steel industry. Science and Technology Management Research, 42(01), 171–176. https://doi.org/10.3969/j.issn.1000-7695.2022.1.023
[30]. Lu, L. (2020). Research on the emission reduction effect and mechanism of China's carbon trading mechanism [Doctoral dissertation, Beijing University of Technology].
[31]. Lin, B., & Huang, C. (2022). Analysis of emission reduction effects of carbon trading: Market mechanism or government intervention? Sustainable Production and Consumption, 33, 28–37. https://doi.org/10.1016/j.spc.2022.07.003
Cite this article
Zhou,M. (2025). Study on China's regional carbon emission efficiency under background of carbon trading policy. Journal of Applied Economics and Policy Studies,18(5),44-58.
Data availability
The datasets used and/or analyzed during the current study will be available from the authors upon reasonable request.
Disclaimer/Publisher's Note
The statements, opinions and data contained in all publications are solely those of the individual author(s) and contributor(s) and not of EWA Publishing and/or the editor(s). EWA Publishing and/or the editor(s) disclaim responsibility for any injury to people or property resulting from any ideas, methods, instructions or products referred to in the content.
About volume
Journal:Journal of Applied Economics and Policy Studies
© 2024 by the author(s). Licensee EWA Publishing, Oxford, UK. This article is an open access article distributed under the terms and
conditions of the Creative Commons Attribution (CC BY) license. Authors who
publish this series agree to the following terms:
1. Authors retain copyright and grant the series right of first publication with the work simultaneously licensed under a Creative Commons
Attribution License that allows others to share the work with an acknowledgment of the work's authorship and initial publication in this
series.
2. Authors are able to enter into separate, additional contractual arrangements for the non-exclusive distribution of the series's published
version of the work (e.g., post it to an institutional repository or publish it in a book), with an acknowledgment of its initial
publication in this series.
3. Authors are permitted and encouraged to post their work online (e.g., in institutional repositories or on their website) prior to and
during the submission process, as it can lead to productive exchanges, as well as earlier and greater citation of published work (See
Open access policy for details).
References
[1]. Xu, X. K., & Zhang, S. J. (2025). The carbon emission reduction effect of global carbon market: Market mechanisms and government interventions. International Finance Research, 2025(5), 29-39. https://doi.org/10.16475/j.cnki.1006-1029.2025.05.003
[2]. Wang, K., & Lv, C. (2024). Achievements and prospects of China's carbon market construction (2024). Journal of Beijing Institute of Technology (Social Sciences Edition), 26(2), 16-27. https://doi.org/10.15918/j.jbitss1009-3370.2024.7182
[3]. Wu, P., & Wang, Q. (2010). Economic analysis of emission rights trading. China Population, Resources and Environment, 20(S1), 55–58. https://doi.org/10.3969/j.issn.1008-1968.2014.05.042
[4]. Li, Z., & Wang, J. (2021). Spatial emission reduction effects of China's carbon emission trading: Quasi-natural experiment and policy spillover. China Population, Resources and Environment, 31(01), 26–36. https://doi.org/10.12062/cpre.20200907
[5]. Farrell, M. J. (1957). The measurement of productive efficiency. Journal of the Royal Statistical Society: Series A (General), 120(3), 253–281. https://doi.org/10.2307/2343100
[6]. Solow, R. M. (1957). Technical change and the aggregate production function. The Review of Economics and Statistics, 39(3), 312–320. https://doi.org/10.2307/1926047
[7]. Zaim, O., & Taskin, F. (2000). Environmental efficiency in carbon dioxide emissions in the OECD: A non-parametric approach. Journal of Environmental Management, 58(2), 95–107. https://doi.org/10.1006/jema.1999.0312
[8]. Zofio, J. L., & Prieto, A. M. (2001). Environmental efficiency and regulatory standards: The case of CO2 emissions from OECD Industries. Resource and Energy Economics, 23(1), 63–83. https://doi.org/10.1016/S0928-7655(00)00030-0
[9]. Wang, Q., Zhou, P., & Zhou, D. (2010). Dynamic changes, regional differences, and influencing factors of China's carbon dioxide emission performance. China Industrial Economics, 2010(01), 45–54. https://doi.org/10.19581/j.cnki.ciejournal.2010.01.004.
[10]. Ma, D., Chen, Z., & Wang, L. (2015). Spatial measurement of China's provincial carbon emission efficiency. China Population, Resources and Environment, 25(01), 67–77. https://link.cnki.net/urlid/37.1196.n.20141229.1506.010
[11]. Wei, M., Cao, M., & Jiang, J. (2010). Long-term determinants and convergence analysis of carbon emission efficiency in production. Quantitative & Technical Economics, 27(09), 43–52. https://doi.org/10.13653/j.cnki.jqte.2010.09.001.
[12]. Zhao, G., Li, W., Zhang, R., & Liang, W. (2012). Evaluation of carbon emission efficiency in Shanxi Province based on stochastic frontier model. Resources Science, 34(10), 1965–1971.
[13]. Wu, X., Zhang, J., Tian, Y., & Li, P. (2014). China's provincial agricultural carbon emissions: Measurement, efficiency changes, and influencing factors – Research based on DEA-Malmquist index decomposition method and Tobit model application. Resources Science, 36(01), 129–138.
[14]. Zachmann, G., Ndoye, A., & Abrell, J. (2011). Assessing the impact of the EU ETS using firm level data (No. 579).
[15]. Hepburn, C., Grubb, M., Neuhoff, K., et al. (2006). Auctioning of EU ETS phase II allowances: how and why? Climate Policy, 6(1), 137–160. https://doi.org/10.1080/14693062.2006.9685592
[16]. Jia, J. J., Xu, J. H., & Fan, Y. (2016). The impact of verified emissions announcements on the European Union emissions trading scheme: A bilaterally modified dummy variable modelling analysis. Applied Energy, 173, 567–577. https://doi.org/10.1016/j.apenergy.2016.04.027
[17]. Diaz-Rainey, I., & Tulloch, D. J. (2018). Carbon pricing and system linking: lessons from the New Zealand emissions trading scheme. Energy Economics, 73, 66–79. https://doi.org/10.1016/j.eneco.2018.04.035
[18]. Rosendahl, K. E. (2019). EU ETS and the waterbed effect. Nature Climate Change, 9(10), 734–735. https://doi.org/10.1038/s41558-019-0579-5
[19]. Huang, X., Zhang, X., & Liu, Y. (2018). Has China's carbon trading policy achieved environmental dividends? Economic Review, 2018(06), 86–99. https://doi.org/10.19361/j.er.2018.06.07.
[20]. Liu, C., Sun, Z., & Zhang, J. (2019). Research on the carbon emission reduction policy effects of China's carbon emission trading pilots. China Population, Resources and Environment, 29(11), 49–58.
[21]. Zhou, D., & Liu, Y. (2020). The impact of China's carbon trading pilot policy on urban carbon emission performance and its mechanism. China Environmental Science, 40(01), 453–464. https://doi.org/10.19674/j.cnki.issn1000-6923.2020.0050.
[22]. Wang, H., & Wang, Z. (2021). Policy effects and influencing mechanisms of carbon emission rights trading in China's pilot cities. Urban Development Studies, 28(06), 133–140. https://doi.org/10.3969/j.issn.1006-3862.2021.06.025
[23]. Charnes, A., Cooper, W. W., & Rhodes, E. (1978). Measuring the efficiency of decision making units. European Journal of Operational Research, 2(6), 429–444. https://doi.org/10.1016/0377-2217(78)90138-8
[24]. Banker, R. D., Charnes, A., & Cooper, W. W. (1984). Some models for estimating technical and scale inefficiencies in data envelopment analysis. Management Science, 30(9), 1078–1092. https://doi.org/10.1287/mnsc.30.9.1078
[25]. Tone, K. (2001). A slacks-based measure of efficiency in data envelopment analysis. European Journal of Operational Research, 130(3), 498–509. https://doi.org/10.1016/S0377-2217(99)00140-5
[26]. Abadie, A., Diamond, A., & Hainmueller, J. (2010). Synthetic control methods for comparative case studies: Estimating the effect of California’s tobacco control program. Journal of the American Statistical Association, 105(490), 493–505. https://doi.org/10.1198/jasa.2009.ap08746
[27]. Shan, H. (2008). Re-estimation of China's capital stock K: 1952–2006. Quantitative & Technical Economics, 25(10), 17–31.
[28]. Cai, H., & Xu, Y. (2018). Industrial collaborative agglomeration, trade openness, and haze pollution. China Population, Resources and Environment, 28(06), 93–102.
[29]. Wang, X., & Wang, S. (2022). The impact of carbon trading policy on carbon emission efficiency in China's steel industry. Science and Technology Management Research, 42(01), 171–176. https://doi.org/10.3969/j.issn.1000-7695.2022.1.023
[30]. Lu, L. (2020). Research on the emission reduction effect and mechanism of China's carbon trading mechanism [Doctoral dissertation, Beijing University of Technology].
[31]. Lin, B., & Huang, C. (2022). Analysis of emission reduction effects of carbon trading: Market mechanism or government intervention? Sustainable Production and Consumption, 33, 28–37. https://doi.org/10.1016/j.spc.2022.07.003