


1. Introduction
Asian developing economies have shown robust growth in recent years. Over the past 30 years, their real Gross Domestic Product (GDP) at Purchasing Power Parity (PPP) increased 7.5-fold, compared to a three-fold rise globally, and real per capita GDP grew over four times, compared to less than double globally [1]. However, urban development in the region is uneven, with differences in growth speeds between historically and newly prosperous cities.
Cui et al. [2] found that countries such as Japan, South Korea, and Singapore developed rapidly in the past but have experienced relatively slower growth in recent years; while some East Asian countries like China, Malaysia, and Indonesia currently show rapid development momentum. This reflects an economic development trend: regions/countries that advanced earlier slow down, while initially less-developed ones show strong catch-up momentum, with growth rates among the world's highest.
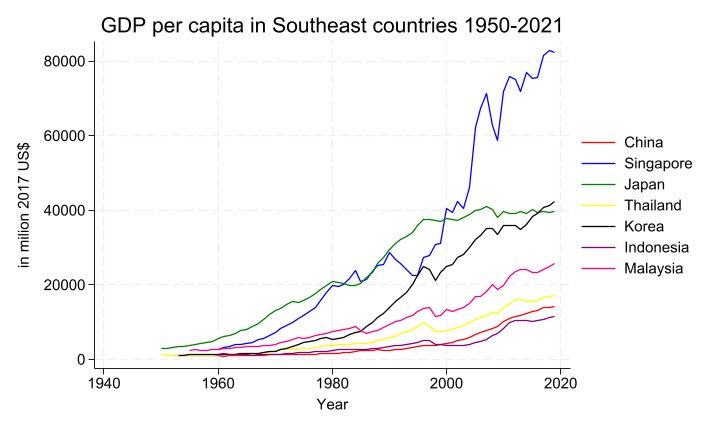
Note: Data adapted from " Penn World Table " by R. C. Feenstra, R. Inklaar, & M. P. Timmer, 2015, American Economic Review, 105(10), 3150–3182. Available from https://www.ggdc.net/pwt) [3]
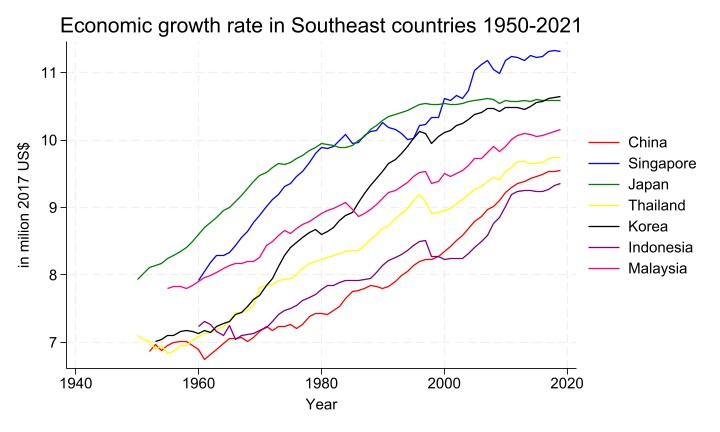
Note: Data adapted from "Penn World Table" by R. C. Feenstra, R. Inklaar, & M. P. Timmer, 2015, American Economic Review, 105(10), 3150–3182. Available from https://www.ggdc.net/pwt) [3].
The per capita GDP levels and growth rates from 1950 to 2021 also reflect this phenomenon (see Figure 1 and Figure 2). China's growth was low and volatile until 1980 but then rose rapidly. Singapore had a fast upward trend after 1960, with explosive growth in 1980-2000 and stable high growth after 2000. Japan grew fast from 1940-1980 but slowed after 1980. Thailand's growth was moderate and declined after 2010. South Korea's growth increased gradually from around 1960, grew substantially in 1980-2000, then slowed. Indonesia had moderate growth before 2000 and stagnated twice in 2000. Malaysia grew stably overall but trended down after 2010.
This current situation raises profound questions about urban economic development speeds: What are the differences in economic development speeds between historically prosperous cities and newly prosperous cities in East Asia? What are the similarities and differences between the economic development trajectories of newly prosperous cities and those of historically prosperous cities?
Past East Asia studies relied on statistical yearbook data like population and GDP, which have spatial gaps and incomplete data [4]. Nighttime Light (NTL) imagery, with broad coverage, long-term records, and spatial continuity, overcomes these shortcomings [5] and helps identify development issues in economic and social development processes.
To address development speed disparities among major East Asian cities, this study analyzes Nighttime Light (NTL) data (1993–2021) focusing on major Chinese cities and using East Asian peers as comparators. By integrating NTL and traditional economic data, it examines growth rate differences between historically and newly prosperous cities, compares development speeds across periods, tries to identify commonalities in development paths, and explores transferable models for newly prosperous cities.
2. Literature review
There are significant differences in the level of economic development among cities within East Asia. Particularly, there are disparities in development speed between historically prosperous cities and newly prosperous cities. Salamh et al. [6] highlighted the coexistence of developmental disparities and commonalities across East Asian cities. In-depth study of the development differences among diverse types of cities is of great significance for countries in formulating regional development policies. For historically prosperous cities, issues such as how to break through the bottleneck of industrial upgrading and boost the economic growth rate, and for newly prosperous cities, how to maintain a high-speed development trend and avoid a lack of stamina in economic growth are all urgent problems to be solved.
Historically prosperous cities such as Bangkok and Tokyo, serving as long-term economic, cultural, and political centers in East Asia, have driven economic growth steadily over a long period in the past, relying on their profound historical heritage, well-developed infrastructure, mature industrial systems, and relatively high-level industrialization, which promote production, technological capabilities, and innovation [7]. However, with the in-depth development of economic globalization, their traditional industries are facing problems such as rising costs and increasing pressure for technological innovation. Meanwhile, the fertility rates in these areas have significantly declined [8], and there is a serious shortage of labor (Economic growth in Japan difficult, 2016). The relatively slow pace of industrial transformation and upgrading has, to a certain extent, restricted the economic growth rate. Newly prosperous Chinese cities, such as Shenzhen and Chengdu, have mitigated growth contradictions through industrial green transformation [9], leveraging globalization and policy incentives to sustain high growth. They have seized the opportunities of globalization and industrial transfer, relied on the rise of emerging industries and strong policy support, and developed based on modern technological levels. This has ensured the economic growth capacity under the current system and provided a foundation for long - term growth prospects, thus achieving rapid economic growth [10].
Regarding the measure indicator, based on previous research demonstrating that nighttime light data can serve as a proxy variable for economic activities [11], this study uses nighttime light data as a measure to observe economic development, avoiding the problem of a high probability of statistical errors caused by the weak GDP statistical capabilities of some national governments [12].
Henderson et al. combined satellite nighttime light data with measured income growth data to improve the accuracy of estimating real income growth. When exploring the credibility of China's economic growth and GDP data, Xu Kangning et al. [13] used methods such as Ordinary Least Squares (OLS) and spatial econometrics to conduct regression analysis on China's provincial panel data from 1992 to 2012. The results showed that, regardless of the estimation method used, there was a significant positive correlation between DMSP-OLS nighttime light brightness and GDP. This indicates that the brightness of urban nighttime lights can serve as a proxy variable for observing economic growth data. In addition, Clark et al. [14] used DMSP-OLS nighttime light data as an independent benchmark to compare various economic indicators announced in China, aiming to evaluate the quality of China's official GDP statistical data. The research results showed that China's official statistical data did not exaggerate the extent of economic growth, and the actual growth rate may even be higher than the officially announced value.
3. Data collection
3.1. Raw image nighttime light data
Due to the long-time span of the research, the observation data of a single satellite program cannot cover all the timelines of the research. Therefore, the data used in this study are divided into two parts. One is the global monthly and annual data of Defense Meteorological Statellite Program (DMSP), which covers the nighttime light data of each month from 1992 to 2013. The other is the monthly and annual Visible Infrared Imaging Rdiaometer Suite (VIIRS) nighttime light data obtained through the JPSS satellite, which covers the nighttime light data of each month from 2012 to the present.
The National Oceanic and Atmospheric Administration (NOAA) has released DMSP (1992–2013) and VIIRS (2012–2022) datasets. The Earth Observation Group of the Payne Institute for Public Policy at the Colorado School of Mines provides more types of corrected data. For DMSP, the Earth Observation Group (EOG) combines the images taken by DMSP-OLS to generate data for global night-light maps. For VIIRS data, the EOG collects nighttime satellite images and provides higher-quality data after a series of corrections. This data can be downloaded from the website of the Earth Observation Group at the Colorado School of Mines, and the delivery format is GeoTIFF.
DMSP Monthly Data: in the monthly series of DMSP, the Earth Observation Group website provides three file types: avg_vis (average Digital Number (DN) value), cf_cvg (cloud-free coverage count), and cvg (coverage count). We selected the avg_vis data. In avg_vis, the DN value refers to the digital value obtained after quantifying the radiation intensity of ground objects detected by the sensor. It contains the average value of digital values in the visible band and does not require further filtering. DN values range from 1-63 in DMSP. This data reflects the average brightness of pixels in a remote—sensing image in a certain area [15]. For nighttime light data, this value can reflect the average intensity of lights to a certain extent, and the nighttime light intensity is highly correlated with economic activities, urbanization levels, and energy consumption, making it suitable for measuring the prosperity of an area.
DMSP Annual Data: select the avg_vis data. In this data, the lights from cities, towns, and other places with continuous lighting (including gas flares), as well as data from temporary events (such as short - term bright lights caused by fires and explosions) and moonlight data have been excluded. At the same time, the background noise is replaced with zero values, and the areas with cloud-free observation values of zero are represented by 255. It only contains relatively stable lights and is all cloud-free data [16].
VIIRS Monthly Data: monthly average nighttime light data collected by the VIIRS satellite launched by NOAA, which are monthly cloud - free Day/Night Band (DNB) composites processed by EOG. Due to cloud cover, the values in the average radiation images of some areas in this study are zero. Therefore, instead of assuming that no light is observed, it is a better idea to use cloud-free observation files. Select cloud-free observation file with the extension "avg_rade9". These data have already excluded the influence of stray light, lightning, moonlight, and cloud cover before forming the merged image, but have not filtered out lights from auroras, fires, ships, and other temporary sources [17].
VIIRS Annual Data: select the annual Version 2 Annual VIIRS Nighttime Lights (VNL V2 data). Based on the monthly cloud-free average radiation grids from 2012 to 2020, outliers were removed to discard biomass—burning pixels and isolating the background, generating a new, consistently processed annual global VIIRS nighttime light time series. This data has undergone multi-layer separation and excluded interferences such as temporary light sources (including lights, flames, auroras, etc.) and background values (non - light source values) [18].
DMSP Nighttime Lights Extension: select the avg_vis data. Since NOAA has added extra years to the DMSP equatorial crossing time chart and found that the F-15 orbit continued to shift, starting to collect pre-dawn nighttime data in 2012. Satellite F-16 may also have collected usable pre-dawn nighttime data. This change extended DMSP data to 2021 [16].
3.2. Geographic data on administrative divisions
The urban administrative division data uses populated places provided by Natural Earth, with the format of shapefile. It covers the capitals, provincial capitals, and important large cities of 202 countries and regions. The reference system of geographic data is the WGS-84 coordinate system, which can be directly used for relevant analysis with image data (Natural Earth, 2009). Among them, we used R to crop and extract the data of eight Chinese cities, namely Beijing, Shanghai, Wuhan, Xi'an, Chongqing, Chengdu, Guangzhou, and Shenzhen and 6 representative foreign cities, including Chinese (Beijing, Shanghai, Guangzhou, Shenzhen, Xi'an, Chengdu, Wuhan, Chongqing) and major East Asian cities (Singapore, Kuala Lumpur, Seoul, Tokyo, Jakarta).
The reason for selecting these cities for research is that they include both historically prosperous cities such as Tokyo and Singapore, which have long served as regional economic and cultural centers, carrying historical accumulation and transformation challenges, and can reveal the resilience of sustained prosperity or lessons from decline; and newly prosperous cities such as Shenzhen, Chengdu, and Jakarta, which have risen rapidly in the past decade or so relying on policy dividends, industrial transfer, or technological revolution, and can demonstrate emerging development paths in the context of globalization and technological change. These two types of cities form a contrast, jointly providing a comprehensive perspective for analyzing urban development dynamics, challenges, and regional linkage effects.
4. Methodology
This paper uses the average DN value as the main indicator to measure global light data. The nighttime light image is a grayscale image, and the grayscale value (DN value) of a pixel represents the average light intensity. The range of the light grayscale value (DN value) of this data is 0-63. When the DN value of a raster reaches 63, it cannot increase further in DMSP but can still increase in VIIRS.
4.1. Measurement method
We used both R and ArcGIS to detect the monthly nighttime light data. By comparing the DN values obtained from the two software, we ensure the accuracy of the data to some extent.
In a TIF-format image file, each pixel (picture element) stores a Digital Number (DN), which represents the radiometrically calibrated nighttime light intensity. The DN value is the original numerical record of each pixel in a remote - sensing image, directly reflecting the radiation intensity of ground objects received by the sensor (such as in visible and infrared bands). The pixel value of each band is the DN value, stored in matrix form.
4.1.1. Obtaining nighttime light data of specific urban areas using R
In R language, cellStats can calculate various statistical information of pixels in raster data and can be directly used to obtain the maximum, minimum, average, sum, standard deviation of DN values in a single-band raster image.
Therefore, the processing idea of this study is as follows: Check the number of bands of the TIF image. If it is an RGB three-band TIFF, we need to use the brightness formula for conversion to obtain a single-band raster and then use cellStats for statistics. If the image file belongs to a single-band raster, we can directly use cellStats for statistics.
After inspection, we found that all the TI files of nighttime light data are single-band, so we use them directly and use cellStats to obtain the relevant information of DN values in single-band raster images.
Based on the spatial CellStats in R software, after unifying the coordinates and establishing a general function, we obtained the average DN data of specific cities
4.1.2. Obtaining the nighttime light data of specific cities using ArcGIS
Based on the extraction function of the spatial analysis module of ArcGIS software, the nighttime light data and the urban division vector map are uniformly converted into UTM projection coordinates. The nighttime light data of the research area is cropped using the mask extraction tool, and the obtained raster data is overlaid with the light data. The raster data is converted into features through the "raster to polygon" tool. Among them, the gridcode in the attribute table represents the DN value.
5. Results
5.1. Vertical comparison with both DMSP data and VIIRS data
Based on the obtained DN data, we established nighttime light charts for each city using extended DMSP DN value data and VIIRS data, while also merging DMSP and VIIRS dataThe results show that the nighttime light intensity of most of these cities shows an upward trend over time, reflecting urban development, increased economic activities, and the advancement of urbanization. The DMSP dataset spans a long time period. Although the VIIRS data started later, it can be well supplemented in the later stage and corroborate with the DMSP data, jointly reflecting the changes in urban nighttime lights (see Figure 3 and Figure 4).
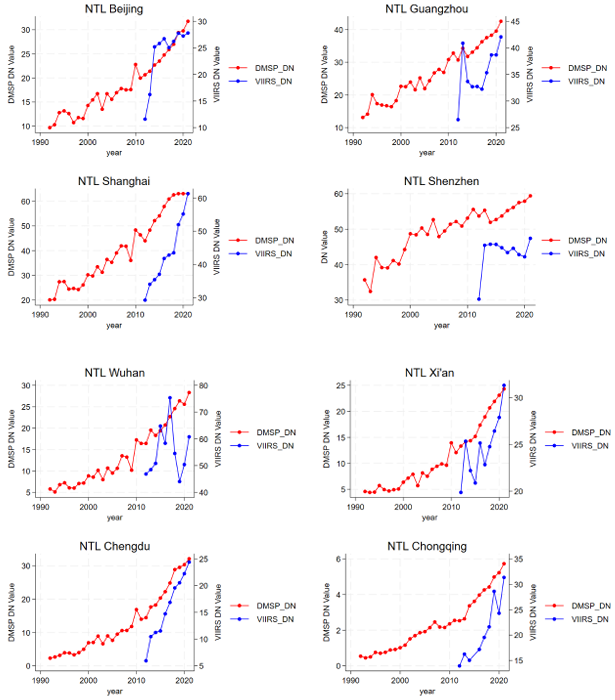
Note: Data adapted from DMSP Nighttime Lights Extension data and Annual VNL V2 data. Image and data processing by Earth Observation Group, Payne Institute for Public Policy, Colorado School of Mines. DMSP data collected by US Air Force Weather Agency.
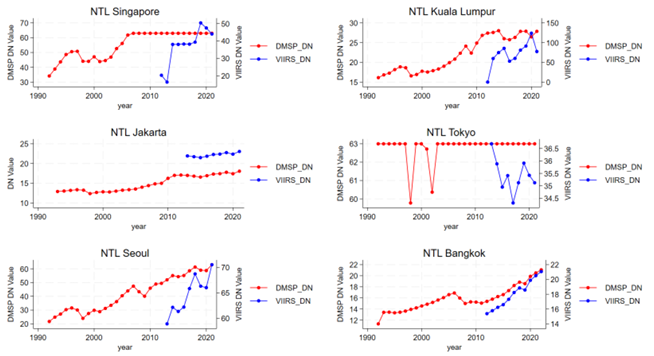
Note: Data adapted from DMSP Nighttime Lights Extension data and Annual VNL V2 data. Image and data processing by Earth Observation Group, Payne Institute for Public Policy, Colorado School of Mines. DMSP data collected by US Air Force Weather Agency.
5.1.1. Analysis of historically prosperous cities
As long-term economic centers in history, most historically prosperous cities completed their development in the last century, leading to slow or even stagnant growth in recent decades. In Tokyo, most of its DMSP DN values remained at the maximum level of 63, showing a "ceiling effect" in light data. This indicates that Tokyo had matured by the last century, with nighttime light intensity already at a high level, consistent with the characteristic that historically prosperous cities reached a high level in earlier historical periods. Meanwhile, in Singapore: The DMSP DN values gradually increased from 1990 to 2010, indicating rapid development from the last century to the early 21st century; they became relatively stable after 2010, with VIIRS DN values close to and changing smoothly with DMSP DN values, suggesting that Singapore's development speed has slowed down at present and maintained a high level.
5.1.2. Analysis of newly prosperous cities
Newly prosperous cities were relatively underdeveloped in the past but have grown rapidly in the past decade or so. In Shenzhen, the DMSP DN values continued to rise, and the VIIRS_DN values also showed a clear upward trend. Especially in recent decades, the growth trend has been remarkable, reflecting Shenzhen’s rapid development as a newly prosperous city in recent decades, with a significant increase in nighttime light intensity and rapid economic and urban construction development. Similarly, Chengdu: Both DMSP DN and VIIRS_DN values showed a steady upward trend, with an increased slope in recent decades, indicating that Chengdu has accelerated its development speed in recent decades, with a significant increase in nighttime light intensity, consistent with the development characteristics of newly prosperous cities.
5.1.3. Comprehensive analysis of other cities
Cities such as Beijing and Shanghai have both historical heritage and modern development momentum The DMSP DN and VIIRS_DN values of both cities showed an overall upward trend, with a faster growth rate in recent decades. These cities are not only traditionally important cities with historical heritage but have also accelerated their development in recent decades along with national development strategies and their own industrial upgrades, embodying the characteristics of both historically and newly prosperous cities.
In general, the charts partially validate the theory that historically prosperous cities developed rapidly in the last century and have stabilized at present, while newly prosperous cities have developed rapidly in recent decades. However, some cities exhibit more complex development trends due to their own characteristics and development strategies.
5.1.4. Analysis of differences between DMSP and VIIRS
Additionally, it was found that although the years are the same, the data from DMSP and VIIRS are not completely identical, which may be due to the following reasons:
The first is transit time difference. DMSP-OLS satellites pass at 19:30 and 22:00 local time [16], capturing peak evening light levels during high human activity, while VIIRS satellites pass at 1:30 a.m. local time [18], recording lower late-night intensities when most lights are dimmed. This temporal gap causes systematic data differences as they reflect distinct phases of daily activity cycles.
The difference in resolution also leads to data discrepancies between the two. DMSP has a lower resolution (1km), resulting in rough characterization of spatial details, which is prone to light intensity distortion due to pixel mixing, and has insufficient detection capability for low-light areas, easily producing more invalid pixels with DN=0 [19]. In contrast, VIIRS has a higher resolution (500m) and more pixels, enabling it to capture more subtle light changes and spatial distributions, be more sensitive to low-light detection, and have fewer invalid pixels. Therefore, there are significant differences in DN value performance and light detail recording between the two in the same year.
5.2. Horizontal comparison with DMSP data
Since DMSP data has a broader coverage, and when compared with GDP data, its trends align more closely with actual economic development patterns. Therefore, we used extended DMSP data for further analysis and comparison.
Focused on Chinese cities, this study compared eight cities with different development situations against six East Asian cities (highlighted with bold lines). To gain a further insight into their development trends, both NTL level and growth rate figures were constructed. Considering that Beijing and Shanghai are historically prosperous cities, we marked them with dashed lines for better differentiation.
Meanwhile, based on the DMSP extend data, the average growth rates of these cities for the periods 1990-2000, 2000-2020, 2000 - 2010, 2010-2015, and 2015-2020 have been calculated (see Table 1). This is to better compare the growth rates among different cities during different prosperous periods. It should be noted that a recorded growth rate of zero does not invariably signify an actual growth rate of zero. This may be attributed to the fact that the actual nighttime light data have surpassed the measurable range of the DMSP system, rendering it unable to detect any variations or fluctuations therein.
5.2.1. NTL level comparison
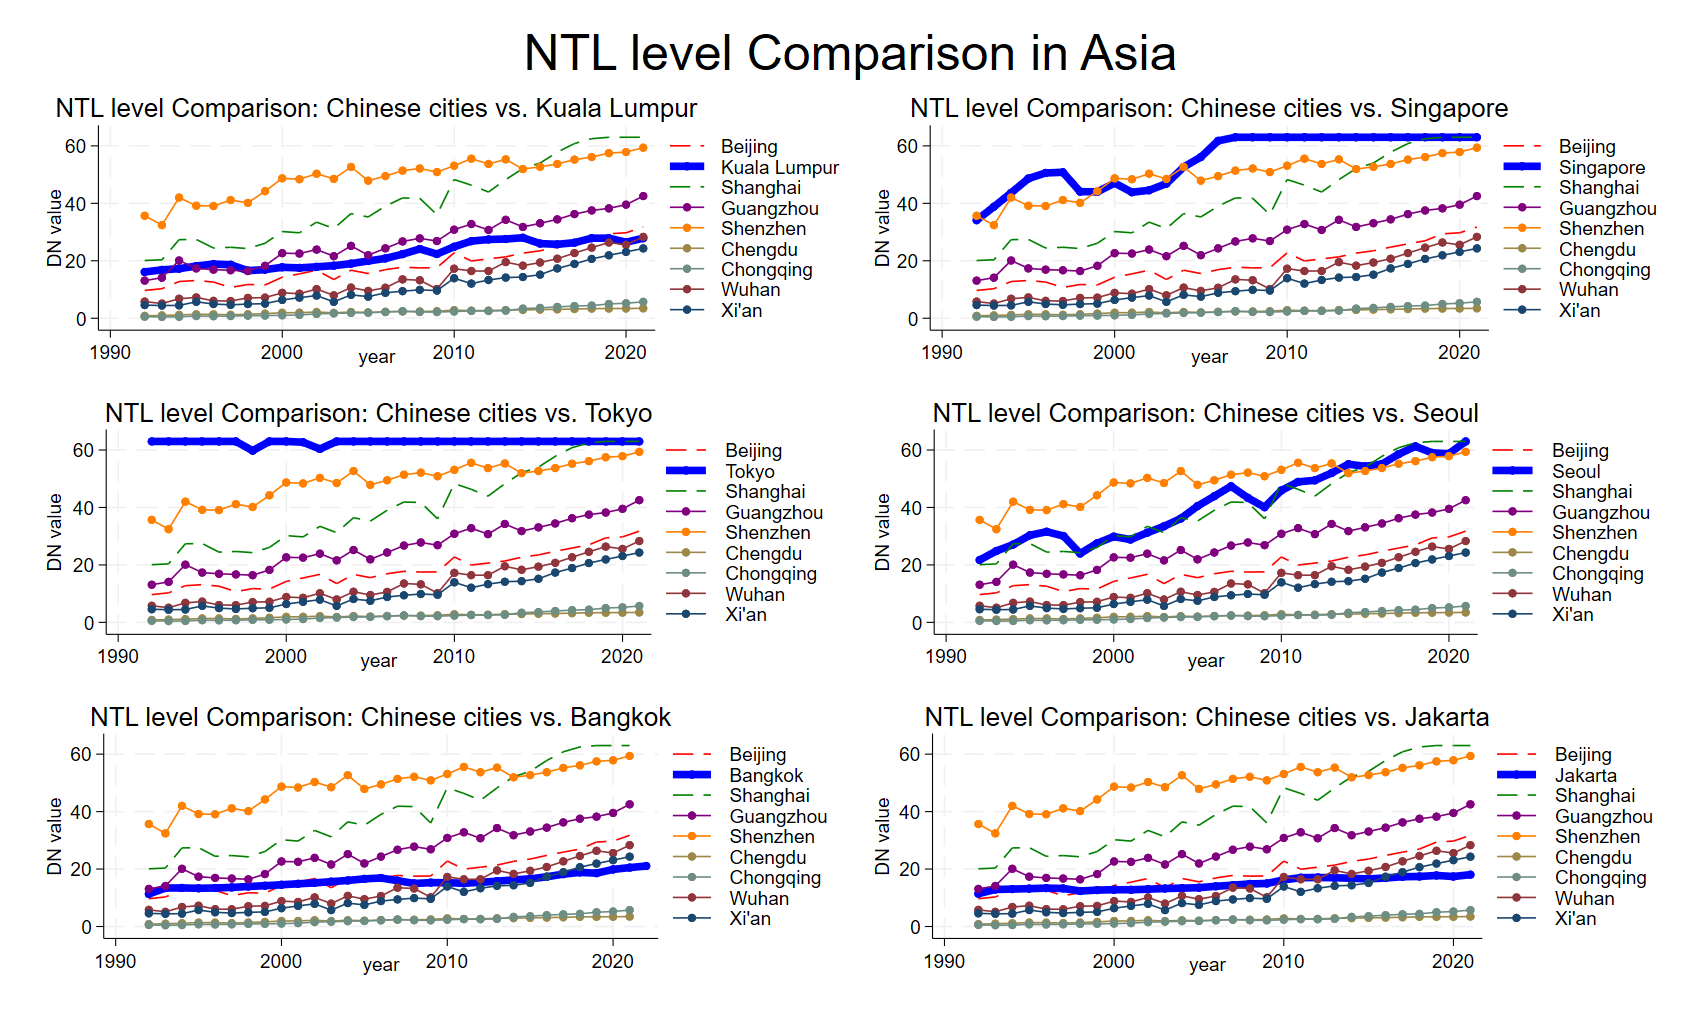
Note: Data adapted from DMSP Nighttime Lights Extension data.. Image and data processing by Earth Observation Group, Payne Institute for Public Policy, Colorado School of Mines. DMSP data collected by US.
In 1990, the NTL value of Kuala Lumpur was higher than that of most Chinese cities. Subsequently, the NTL values of Shenzhen, Shanghai, Guangzhou and other Chinese cities rose rapidly and gradually surpassed that of Kuala Lumpur, demonstrating the strong development momentum of China's newly prosperous cities. Singapore had a leading NTL value in the early stage, with a consistently high nighttime light level. Chinese cities such as Beijing and Shanghai have grown rapidly, gradually narrowing the gap with Singapore in terms of nighttime light levels. Tokyo had a high-stable NTL value in the early stage. Among Chinese cities, Shenzhen and Shanghai have seen significant growth. Shenzhen's value increased from a relatively low level to nearly 50 in 2020, and Shanghai showed a similar trend. Chinese cities have developed rapidly in terms of economy and urban construction, gradually catching up with Tokyo in nighttime light levels.
Seoul had a relatively high NTL value in the early stage. In recent years, Chinese cities such as Shenzhen and Shanghai have grown prominently, gradually narrowing the gap with Seoul. In 1990, Bangkok's DN value was higher than that of some Chinese cities like Chengdu and Chongqing. As the capital and an important economic center of Thailand, it had certain advantages. Later, the NTL values of Shenzhen, Guangzhou, Shanghai and other Chinese cities climbed rapidly and surpassed it. By 2020, Shenzhen's DN value exceeded 50, and Guangzhou and Shanghai were also far ahead. Jakarta had a leading NTL value over some Chinese cities in the early stage. Later, Shenzhen, Shanghai and others grew rapidly, showing an obvious trend of overtaking (see Figure 5).
5.2.2. Growth rate comparison
Growth rate comparison between China and some Asian cities can be seen as Figure 6:
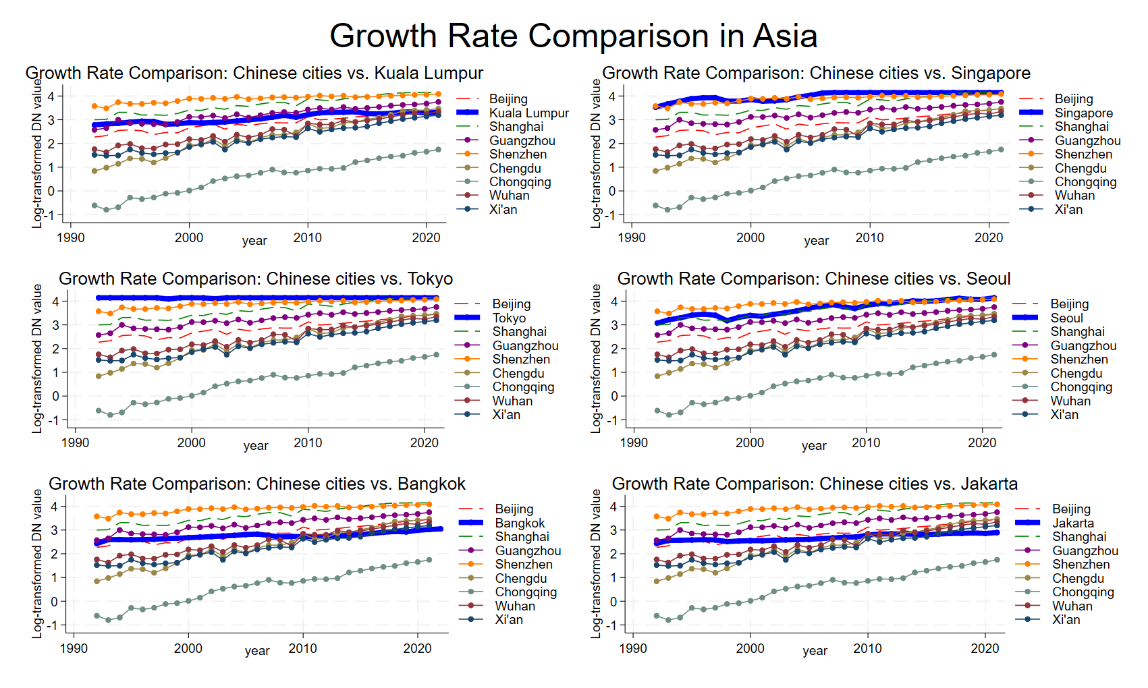
Note: Data adapted from DMSP Nighttime Lights Extension data.. Image and data processing by Earth Observation Group, Payne Institute for Public Policy, Colorado School of Mines. DMSP data collected by US.
|
City |
1992-2000 |
2000-2020 |
2000-2010 |
2010-2015 |
2015-2020 |
|
Bangkoka |
3.1813 |
1.5772 |
0.4708 |
1.7102 |
3.6910 |
|
Beijinga |
4.9760 |
3.7388 |
4.7822 |
0.6110 |
4.8441 |
|
Chengdua |
14.6444 |
7.6718 |
9.3333 |
3.7860 |
8.3339 |
|
Chongqinga |
8.1531 |
8.5362 |
8.7856 |
8.9351 |
7.6433 |
|
Guangzhoua |
7.0759 |
2.8251 |
3.1348 |
1.4101 |
3.6344 |
|
Jakartaa |
1.4507 |
1.5389 |
2.3876 |
0.4031 |
0.9922 |
|
Kuala Lumpura |
1.2090 |
2.0164 |
3.4391 |
0.8773 |
0.3498 |
|
Seoula |
4.0616 |
3.4385 |
4.3938 |
3.4134 |
1.5788 |
|
Shanghaia |
5.2229 |
3.7444 |
4.8072 |
2.2702 |
3.1163 |
|
Shenzhena |
3.9623 |
0.8660 |
0.8707 |
-0.1509 |
1.8838 |
|
Singaporea |
4.1008 |
1.4686 |
2.9587 |
0.0000 |
0.0000 |
|
Tokyoa |
0.0000 |
0.0000 |
0.0000 |
0.0000 |
0.0000 |
|
Wuhana |
5.4254 |
5.4504 |
6.9056 |
2.3812 |
5.6750 |
|
Xiana |
4.2161 |
6.6463 |
8.1328 |
1.7067 |
8.7723 |
Note: Data adapted from DMSP Nighttime Lights Extension data.. Image and data processing by Earth Observation Group, Payne Institute for Public Policy, Colorado School of Mines. DMSP data collected by US.
During 1990-2000, the growth rate of Kuala Lumpur remained relatively stable at around 2-3, while that of Chinese cities such as Shenzhen and Guangzhou rose with fluctuations. Shenzhen's growth rate fluctuated between 2-4. From 2000-2020, the growth rates of Shenzhen, Guangzhou and other cities were higher than that of Kuala Lumpur in most years.
From 1990-2010, Singapore's growth rate was relatively stable at 3-4. The growth rate of some Chinese cities, such as Shenzhen, fluctuated between 2-4, and in some years it could match or even exceed that of Singapore. Driven by the science and technology innovation industry, Shenzhen has developed rapidly, attracting a large amount of resources and leading to a rapid increase in the nighttime light value. From 2010-2020, the growth rates of Shenzhen and other cities remained at a relatively high level.
The growth rates of Seoul, Bangkok, and Jakarta were relatively stable, remaining at around 2-3. South Korea's economy has entered a relatively stable development period, and the urban development rhythm is steady. The growth rates of Chinese cities such as Shenzhen and Shanghai rose with fluctuations.
Due to the fact that Japan's DN value has exceeded the threshold, its growth rate cannot be measured.
Overall, NTL values of major Chinese cities (e.g., Shanghai, Guangzhou, Shenzhen) show an upward trend, reflecting urban development, urbanization, and increased economic activity. Some East Asian cities like Singapore and Tokyo had high-stable NTL values earlier but slowed later, gradually approaching Chinese cities' levels. Central-western cities like Chongqing and Chengdu show significant NTL growth, demonstrating late-development advantages and rapid momentum.
6. Discussion
From the dynamic evolution of the chart data, it can be observed that urban development exhibits a significant divergence in trajectories: historically prosperous cities represented by Tokyo and Singapore gradually reached a high level of economic development through long-term capital accumulation, technological iteration, and institutional improvement in the early stages, but their growth rates have gradually slowed as development has matured. In sharp contrast, China's new prosperous cities, exemplified by Shenzhen and Chengdu, showed less prominent development momentum in the initial stages due to weak foundations but achieved leapfrog growth by leveraging late-mover advantages, rapidly enhancing their economic scale and urban vitality in the short term.
6.1. Late-mover advantage theory
This divergent development trajectory aligns closely with the late-mover advantage theory. developing countries can gradually narrow the development gap with developed countries through learning, introducing, absorbing, and efficiently transforming existing knowledge and technologies [20]. Gerschenkron [21] theoretically proposed the late-mover advantage in economic growth, arguing that the higher the degree of underdevelopment, the faster the growth rate, eventually converging toward developed countries. Historically prosperous cities, lacking external experience to draw upon, can only rely on endogenous momentum for gradual development. After reaching a high economic level, their growth rates naturally slow down due to the law of diminishing marginal returns. New prosperous cities, however, gain late-mover advantages in technological progress and innovation, achieving explosive growth by introducing advanced technologies from developed countries and regions and leveraging knowledge spillovers [22]. The steady growth in Shenzhen's DN values (Figure 4) provides empirical support for Gerschenkron's late-mover advantage theory, as its growth rate exceeded that of Singapore in the post-2000 period (Table 1).
Take Shenzhen as an example: it capitalized on its designation as a special economic zone, fully utilizing special and flexible policies to attract foreign investment and learn advanced foreign technologies and management [23]. Although most investors initially focused on labor-intensive industrial production, policies allowed them to engage in "all projects beneficial to international economic cooperation and technological exchange" [24]. Shenzhen's industries rapidly aggregated resources through a flexible and open policy environment, introduced technologies, and established electronic information industry clusters, achieving a leap from traditional to high-tech industries. The steady growth in Shenzhen’s DN values (Figure 4) provides empirical support for Gerschenkron’s late-mover advantage theory, as its growth rate exceeded that of Singapore in the post-2000 period (Table 1).
Unlike Shenzhen, which started from an agricultural foundation with policy advantages, Shanghai had a historical legacy as a developed Asian city in the early stages of economic reform [25] but failed to promptly leverage its first-mover advantages due to decades of neglect and divestment after 1949 [26]. Since economic reform, Shanghai has shifted from being dominated by secondary industries to vigorously developing tertiary industries: from 1979 to 2012, its agricultural share of GDP dropped from 4% to 0.6%, secondary industries from 77.2% to 39%, and tertiary industries significantly increased from 18.8% to 60.4% [27]. Although Shanghai and Shenzhen exhibit different paths of industrial upgrading, their essence represents choices under the late-mover advantage theory, shaped by different development stages and resource conditions in each city.
6.2. Comparing development path among Asian cities
Based on the discussion of the economic development trajectories of major East Asian cities, we explore whether there is a set of specific institutional and economic characteristics that characterize these cities' economic development paths, and whether the development policies of historically prosperous cities have reference value and significance for developing cities.
East Asian cities exhibit certain commonalities in development, particularly in the role of government and industrial structure upgrading. Governments in these cities have transitioned from "dominant" to "guiding" roles, generally shifting from early direct intervention in industrial policies and resource allocation to later indirect economic guidance through institutional construction, macroeconomic policies, and market regulation [28]. Additionally, the path of industrial structure upgrading is similar across East Asian countries, with cities generally experiencing a phase shift from "labor-intensive → capital-and-technology-intensive → innovation-driven" [29].
However, East Asian researchers are typically less optimistic about the existence of such a common development model [30]. Historically prosperous cities (e.g., Japan, South Korea, Singapore) relied early on capital accumulation, technology import, and industrial policies, but in later stages, they faced constraints such as diminishing marginal returns, population aging, and institutional inertia, leading to slower growth and a shift toward innovation-driven development and service industry upgrading [31]. In contrast, newly prosperous cities in the early reform period primarily relied on imitating advanced foreign technologies, enabling Chinese workers to improve skills and gain technical knowledge from multinational corporations through on-the-job training, which was transferred to domestic companies at relatively low costs [32].
Despite these similarities in urban development and economic pathways, differences in historical context, urban development stages, and geographic endowments have led to distinct development characteristics. Therefore, policies cannot be copied verbatim. Instead, developing cities can reference the policy experiences of historically prosperous cities in industrial upgrading and diversification while designing economic development plans tailored to local conditions.
7. Reflection
While this study provides insights into urban development trajectories, limitations may affect generalizability. When comparing different cities, only DMSP data was employed, which may have caused cities like Japan—already in an early "ceiling effect" state—to show no observable development speed in the data. Additionally, the nighttime light data was not calibrated, and the sample size was small (only fourteen cities), which may not reflect general urban conditions. Furthermore, the study did not account for external shocks or major events (such as financial crises, pandemics, and policy abrupt changes) that could influence urban development, potentially leading to deviations in trend analysis from real-world scenarios.
8. Conclusion
The empirical findings discussed above have important implications for urban development strategies in East Asia. This study utilizes nighttime light (NTL) data (1993–2021) to compare economic development trajectories of historically prosperous cities (e.g., Tokyo, Singapore) and newly prosperous cities (e.g., Shenzhen, Chengdu) in East Asia. Results show that historically prosperous cities achieved rapid growth in the late 20th century via capital accumulation and industrial policies but now face slowdowns due to aging populations and institutional inertia, with NTL data like Tokyo's "ceiling effect" (DMSP DN value=63) reflecting early maturity. Newly prosperous cities, however, leverage late-mover advantages—such as technology imitation and policy support—to sustain rapid growth, as seen in Shenzhen's steady rise in DMSP or VIIRS DN values. While East Asian cities share trends in government role transition (direct intervention → market guidance) and industrial upgrading (labor-intensive → innovation-driven), East Asian scholars highlight contextual disparities that challenge the universality of a "common model".
Drawing upon global technological achievements, developing cities should prioritize technology absorption, flexible policy frameworks, and institutional adaptability, as exemplified by Shenzhen's Special Economic Zone (SEZ) model. This study highlights that historical prosperity models are not universally transferable but offer valuable lessons in policy adaptability and sectoral upgrading. While tailoring strategies to local contexts, cities must balance technological innovation with institutional flexibility.
References
[1]. Lee, J., & Hong, K. (2012). Economic growth in asia: Determinants and prospects.Japan and the World Economy,24(2), 101-113. https: //doi.org/10.1016/j.japwor.2012.01.005
[2]. Cui, Y., Shi, K., Jiang, L., Qiu, L., & Wu, S. (2021). Identifying and evaluating the nighttime economy in china using multisource data.IEEE Geoscience and Remote Sensing Letters, 18(11), 1906-1910. https: //doi.org/10.1109/LGRS.2020.3010936
[3]. Feenstra, Robert C., Robert Inklaar and Marcel P. Timmer (2015),"The Next Generation of the Penn World Table" American Economic Review, 105(10), 3150-3182, available for download at www.ggdc.net/pwt
[4]. Nasir, M. A., Duc Huynh, T. L., & Xuan Tram, H. T. (2019). Role of financial development, economic growth & foreign direct investment in driving climate change: A case of emerging ASEAN.Journal of Environmental Management,242, 131-141. https: //doi.org/10.1016/j.jenvman.2019.03.112
[5]. Gaughan, A. E., Oda, T., Sorichetta, A., Stevens, F. R., Bondarenko, M., Bun, R., Krauser, L., Yetman, G., & Nghiem, S. V. (2019). Evaluating nighttime lights and population distribution as proxies for mappinganthropogenic CO 2 emission in vietnam, cambodia and laos. IOP Conference Series.Materials Science and Engineering,1(9), 1. https: //doi.org/10.1088/2515-7620/ab3d91
[6]. Salamah, L. (2017). Analisa strengths, weaknesses, opprotunities, and threats (SWOT): Peluang dan tantangan association of southeast asian nations (ASEAN) dalam mewujudkan integrasi asia tenggara. Masyarakat,Kebudayaan Dan Politik,30(3), 300-309. https: //doi.org/10.20473/mkp.V30I32017.300-309
[7]. Oqubay, Arkebe, and Justin Yifu Lin (2020), The Oxford Handbook of Industrial Hubs and Economic Development,Oxford Handbooks(2020; online edn, Oxford Academic, 6 Aug. 2020), https: //doi.org/10.1093/oxfordhb/9780198850434.001.0001, accessed 19 May 2025.
[8]. Tsuya, N. O. (2017). Low Fertility in Japan-No End in Sight.Asia - Pacific Issues,(131), 1-4. https: //aurarialibrary.idm.oclc.org/login?url=https: //www-proquest-com.aurarialibrary.idm.oclc.org/scholarly-journals/low-fertility-japan-no-end-sight/docview/1923970068/se-2
[9]. Wang, Y., Yin, S., Fang, X., & Chen, W. (2022). Interaction of economic agglomeration, energy conservation and emission reduction: Evidence from three major urban agglomerations in china.Energy (Oxford),241, 122519. https: //doi.org/10.1016/j.energy.2021.122519
[10]. Sukharev, O. S. (2017). some problems of the economic growth theory.Finansy: Teoriâ i Praktika (Online),21(3), 61-74. https: //doi.org/10.26794/2587-5671-2017-21-3-61-74
[11]. Chen, X., & Nordhaus, W. D. (2011). Using luminosity data as a proxy for economic statistics.Proceedings of the National Academy of Sciences - PNAS,108(21), 8589-8594. https: //doi.org/10.1073/pnas.1017031108
[12]. Henderson, J. V., Storeygard, A., & Weil, D. N. (2012). Measuring economic growth from outer space.The American Economic Review,102(2), 994-1028. https: //doi.org/10.1257/aer.102.2.994
[13]. Xu, K. N., Chen, F. L., & Liu, X. Y. (2015). The Authenticity of China's Economic Growth: A Test Based on Global Nighttime Light Data.Economic Research Journal, 50(09), 17 - 29 + 57.
[14]. Clark, H., Pinkovskiy, M., & Sala-i-Martin, X. (2020). China's GDP growth may be understated.China Economic Review, 62, 101243. https: //doi.org/10.1016/j.chieco.2018.10.010
[15]. Elvidge, C. D., Baugh, K. E., Kihn, E. A., Kroehl, H. W., & Davis, E. R. (1997). Mapping city lights with nighttime data from the DMSP Operational Linescan System.Photogrammetric Engineering and Remote Sensing,63(6), 727-734.
[16]. Ghosh, T., Baugh, K. E., Elvidge, C. D., Zhizhin, M., Poyda, A., & Hsu, F.-C. (2021). Extending the DMSP Nighttime Lights Time Series beyond 2013.Remote Sensing, 13(24), 5004. https: //doi.org/10.3390/rs13245004
[17]. Elvidge, C.D, Zhizhin, M., Ghosh T., Hsu FC (2013), “Why VIIRS data are superior to DMSP for mapping nighttime lights, ”Asia-Pacific Advanced Network35, vol. 35, p. 62,
[18]. Elvidge, C. D., Zhizhin, M., Ghosh, T., Hsu, F.-C., & Taneja, J. (2021). Annual Time Series of Global VIIRS Nighttime Lights Derived from Monthly Averages: 2012 to 2019.Remote Sensing,13(5), 922. https: //doi.org/10.3390/rs13050922
[19]. Shi, K.F., Yu, B., & Huang, Y. (2014). Evaluating the ability of NPP-VIIRS nighttime light data to estimate the gross domestic product and the electric power consumption of China at multiple scales: A comparison with DMSP-OLS data.Remote Sensing, 6(2), 1705–1724. https: //doi.org/10.3390/rs6021705
[20]. Gang, F. (2023). Comparative advantage and latecomer advantage.China Economist (Beijing, China),18(5), 2-13. https: //doi.org/10.19602/j.chinaeconomist.2023.09.01
[21]. Economic backwardness in historical perspective: A book of essays. (1967).International Affairs (London), 43(1), 137-137. https: //doi.org/10.1093/ia/43.1.137
[22]. Howitt, P. (2000). Endogenous growth and cross-country income differences.The American Economic Review,90(4), 829-846. https: //doi.org/10.1257/aer.90.4.829
[23]. Kwok, R. (1986). Structure and policies in industrial planning in the Shenzhen Special Economic Zone. In Y. Jao & C. Leung (Eds.),China’s Special Economic Zones(pp. 39–64). Oxford University Press.
[24]. James, H. (2024, November 29). Special Economic Zones (SEZs) in China for Foreign Investment & Manufacturing.Acclime China.https: //china.acclime.com/guides/special-economic-zones-foreign-investment-manufacturing/
[25]. Wu, W. (1999). City profile: Shanghai. Cities, 16(3), 207-216. https: //doi.org/10.1016/S0264-2751(98)00047-X
[26]. WEI, Y. D., & LEUNG, C. K. (2005). Development zones, foreign investment, and global city formation in shanghai.Growth and Change, 36(1), 16-40. https: //doi.org/10.1111/j.1468-2257.2005.00265.x
[27]. Yeung, H. (2015). A tale of two cities – the development and reform experiences of Shenzhen and Shanghai.Journal of Chinese Economic and Business Studies,13(4), 369–396. https: //doi-org.aurarialibrary.idm.oclc.org/10.1080/14765284.2015.1090268
[28]. Glawe, L., & Wagner, H. (2020). The middle-income trap 2.0: The increasing role of human capital in the age of automation and implications for developing asia.Asian Economic Papers,19(3), 40-58. https: //doi.org/10.1162/asep_a_00783
[29]. Lee, C. (2023). Patterns of Structural Change in Southeast Asian Economies. IJAPS.https: //ijaps.usm.my/?page_id=6972
[30]. Klenner, W. (2006). The East Asian development model. In Kidd, J. B., & Richter, F-J. (Eds.), Development models, globalization, and economies.Palgrave Macmillan,New York.
[31]. Aaronson, S. A. (2022, June 9). Data governance and transformative technologies: A future built on data: Data strategies, competitive advantage, and trust (CIGI Paper No. 266).CIGI.https: //www.cigionline.org/publications/a-future-built-on-data-data-strategies-competitive-advantage-and-trust/
[32]. Glawe, L., & Wagner, H. (2020). The middle-income trap 2.0: The increasing role of human capital in the age of automation and implications for developing asia.Asian Economic Papers, 19(3), 40-58. https: //doi.org/10.1162/asep_a_00783
Cite this article
Zhou,C. (2025). Comparative analysis of economic development trajectories between historically and newly prosperous cities in East Asia using nighttime light data (1993–2021). Journal of Applied Economics and Policy Studies,18(6),40-51.
Data availability
The datasets used and/or analyzed during the current study will be available from the authors upon reasonable request.
Disclaimer/Publisher's Note
The statements, opinions and data contained in all publications are solely those of the individual author(s) and contributor(s) and not of EWA Publishing and/or the editor(s). EWA Publishing and/or the editor(s) disclaim responsibility for any injury to people or property resulting from any ideas, methods, instructions or products referred to in the content.
About volume
Journal:Journal of Applied Economics and Policy Studies
© 2024 by the author(s). Licensee EWA Publishing, Oxford, UK. This article is an open access article distributed under the terms and
conditions of the Creative Commons Attribution (CC BY) license. Authors who
publish this series agree to the following terms:
1. Authors retain copyright and grant the series right of first publication with the work simultaneously licensed under a Creative Commons
Attribution License that allows others to share the work with an acknowledgment of the work's authorship and initial publication in this
series.
2. Authors are able to enter into separate, additional contractual arrangements for the non-exclusive distribution of the series's published
version of the work (e.g., post it to an institutional repository or publish it in a book), with an acknowledgment of its initial
publication in this series.
3. Authors are permitted and encouraged to post their work online (e.g., in institutional repositories or on their website) prior to and
during the submission process, as it can lead to productive exchanges, as well as earlier and greater citation of published work (See
Open access policy for details).
References
[1]. Lee, J., & Hong, K. (2012). Economic growth in asia: Determinants and prospects.Japan and the World Economy,24(2), 101-113. https: //doi.org/10.1016/j.japwor.2012.01.005
[2]. Cui, Y., Shi, K., Jiang, L., Qiu, L., & Wu, S. (2021). Identifying and evaluating the nighttime economy in china using multisource data.IEEE Geoscience and Remote Sensing Letters, 18(11), 1906-1910. https: //doi.org/10.1109/LGRS.2020.3010936
[3]. Feenstra, Robert C., Robert Inklaar and Marcel P. Timmer (2015),"The Next Generation of the Penn World Table" American Economic Review, 105(10), 3150-3182, available for download at www.ggdc.net/pwt
[4]. Nasir, M. A., Duc Huynh, T. L., & Xuan Tram, H. T. (2019). Role of financial development, economic growth & foreign direct investment in driving climate change: A case of emerging ASEAN.Journal of Environmental Management,242, 131-141. https: //doi.org/10.1016/j.jenvman.2019.03.112
[5]. Gaughan, A. E., Oda, T., Sorichetta, A., Stevens, F. R., Bondarenko, M., Bun, R., Krauser, L., Yetman, G., & Nghiem, S. V. (2019). Evaluating nighttime lights and population distribution as proxies for mappinganthropogenic CO 2 emission in vietnam, cambodia and laos. IOP Conference Series.Materials Science and Engineering,1(9), 1. https: //doi.org/10.1088/2515-7620/ab3d91
[6]. Salamah, L. (2017). Analisa strengths, weaknesses, opprotunities, and threats (SWOT): Peluang dan tantangan association of southeast asian nations (ASEAN) dalam mewujudkan integrasi asia tenggara. Masyarakat,Kebudayaan Dan Politik,30(3), 300-309. https: //doi.org/10.20473/mkp.V30I32017.300-309
[7]. Oqubay, Arkebe, and Justin Yifu Lin (2020), The Oxford Handbook of Industrial Hubs and Economic Development,Oxford Handbooks(2020; online edn, Oxford Academic, 6 Aug. 2020), https: //doi.org/10.1093/oxfordhb/9780198850434.001.0001, accessed 19 May 2025.
[8]. Tsuya, N. O. (2017). Low Fertility in Japan-No End in Sight.Asia - Pacific Issues,(131), 1-4. https: //aurarialibrary.idm.oclc.org/login?url=https: //www-proquest-com.aurarialibrary.idm.oclc.org/scholarly-journals/low-fertility-japan-no-end-sight/docview/1923970068/se-2
[9]. Wang, Y., Yin, S., Fang, X., & Chen, W. (2022). Interaction of economic agglomeration, energy conservation and emission reduction: Evidence from three major urban agglomerations in china.Energy (Oxford),241, 122519. https: //doi.org/10.1016/j.energy.2021.122519
[10]. Sukharev, O. S. (2017). some problems of the economic growth theory.Finansy: Teoriâ i Praktika (Online),21(3), 61-74. https: //doi.org/10.26794/2587-5671-2017-21-3-61-74
[11]. Chen, X., & Nordhaus, W. D. (2011). Using luminosity data as a proxy for economic statistics.Proceedings of the National Academy of Sciences - PNAS,108(21), 8589-8594. https: //doi.org/10.1073/pnas.1017031108
[12]. Henderson, J. V., Storeygard, A., & Weil, D. N. (2012). Measuring economic growth from outer space.The American Economic Review,102(2), 994-1028. https: //doi.org/10.1257/aer.102.2.994
[13]. Xu, K. N., Chen, F. L., & Liu, X. Y. (2015). The Authenticity of China's Economic Growth: A Test Based on Global Nighttime Light Data.Economic Research Journal, 50(09), 17 - 29 + 57.
[14]. Clark, H., Pinkovskiy, M., & Sala-i-Martin, X. (2020). China's GDP growth may be understated.China Economic Review, 62, 101243. https: //doi.org/10.1016/j.chieco.2018.10.010
[15]. Elvidge, C. D., Baugh, K. E., Kihn, E. A., Kroehl, H. W., & Davis, E. R. (1997). Mapping city lights with nighttime data from the DMSP Operational Linescan System.Photogrammetric Engineering and Remote Sensing,63(6), 727-734.
[16]. Ghosh, T., Baugh, K. E., Elvidge, C. D., Zhizhin, M., Poyda, A., & Hsu, F.-C. (2021). Extending the DMSP Nighttime Lights Time Series beyond 2013.Remote Sensing, 13(24), 5004. https: //doi.org/10.3390/rs13245004
[17]. Elvidge, C.D, Zhizhin, M., Ghosh T., Hsu FC (2013), “Why VIIRS data are superior to DMSP for mapping nighttime lights, ”Asia-Pacific Advanced Network35, vol. 35, p. 62,
[18]. Elvidge, C. D., Zhizhin, M., Ghosh, T., Hsu, F.-C., & Taneja, J. (2021). Annual Time Series of Global VIIRS Nighttime Lights Derived from Monthly Averages: 2012 to 2019.Remote Sensing,13(5), 922. https: //doi.org/10.3390/rs13050922
[19]. Shi, K.F., Yu, B., & Huang, Y. (2014). Evaluating the ability of NPP-VIIRS nighttime light data to estimate the gross domestic product and the electric power consumption of China at multiple scales: A comparison with DMSP-OLS data.Remote Sensing, 6(2), 1705–1724. https: //doi.org/10.3390/rs6021705
[20]. Gang, F. (2023). Comparative advantage and latecomer advantage.China Economist (Beijing, China),18(5), 2-13. https: //doi.org/10.19602/j.chinaeconomist.2023.09.01
[21]. Economic backwardness in historical perspective: A book of essays. (1967).International Affairs (London), 43(1), 137-137. https: //doi.org/10.1093/ia/43.1.137
[22]. Howitt, P. (2000). Endogenous growth and cross-country income differences.The American Economic Review,90(4), 829-846. https: //doi.org/10.1257/aer.90.4.829
[23]. Kwok, R. (1986). Structure and policies in industrial planning in the Shenzhen Special Economic Zone. In Y. Jao & C. Leung (Eds.),China’s Special Economic Zones(pp. 39–64). Oxford University Press.
[24]. James, H. (2024, November 29). Special Economic Zones (SEZs) in China for Foreign Investment & Manufacturing.Acclime China.https: //china.acclime.com/guides/special-economic-zones-foreign-investment-manufacturing/
[25]. Wu, W. (1999). City profile: Shanghai. Cities, 16(3), 207-216. https: //doi.org/10.1016/S0264-2751(98)00047-X
[26]. WEI, Y. D., & LEUNG, C. K. (2005). Development zones, foreign investment, and global city formation in shanghai.Growth and Change, 36(1), 16-40. https: //doi.org/10.1111/j.1468-2257.2005.00265.x
[27]. Yeung, H. (2015). A tale of two cities – the development and reform experiences of Shenzhen and Shanghai.Journal of Chinese Economic and Business Studies,13(4), 369–396. https: //doi-org.aurarialibrary.idm.oclc.org/10.1080/14765284.2015.1090268
[28]. Glawe, L., & Wagner, H. (2020). The middle-income trap 2.0: The increasing role of human capital in the age of automation and implications for developing asia.Asian Economic Papers,19(3), 40-58. https: //doi.org/10.1162/asep_a_00783
[29]. Lee, C. (2023). Patterns of Structural Change in Southeast Asian Economies. IJAPS.https: //ijaps.usm.my/?page_id=6972
[30]. Klenner, W. (2006). The East Asian development model. In Kidd, J. B., & Richter, F-J. (Eds.), Development models, globalization, and economies.Palgrave Macmillan,New York.
[31]. Aaronson, S. A. (2022, June 9). Data governance and transformative technologies: A future built on data: Data strategies, competitive advantage, and trust (CIGI Paper No. 266).CIGI.https: //www.cigionline.org/publications/a-future-built-on-data-data-strategies-competitive-advantage-and-trust/
[32]. Glawe, L., & Wagner, H. (2020). The middle-income trap 2.0: The increasing role of human capital in the age of automation and implications for developing asia.Asian Economic Papers, 19(3), 40-58. https: //doi.org/10.1162/asep_a_00783