


1. Introduction
Environmental challenges threaten sustainable development and human health [1, 2]. Cities, occupying 3% of land, significantly contribute to pollution. Current urban development faces issues like resource misallocation, inefficient environmental governance, and limited public participation. However, urban development also offers solutions. Smart City Construction (SCC), merging Information and Communication Technology (ICT) with urban infrastructure, aims for holistic sustainability [3]. It emphasizes digital integration, allowing governments, residents, and businesses to collaboratively enhance environmental governance [4]. While traditional research often focuses on isolated pollution issues, SCC's integrated approach addresses the broader environmental spectrum [5]. Smart cities, with their emphasis on integration and efficiency, can help bridge this gap.
China's rapid adoption of SCC offers valuable insights for other countries. Public education and industrial structure in smart cities directly influence environmental governance. However, challenges like fragmented education data [6, 7] and industrial imbalances exist. Given the nuances and potential city-specific factors, the SCC and EGE interplay warrants further exploration.
This study aims to systematically assess the impact of smart city construction on governmental environmental governance efficiency in China, as well as its mechanism of action and performance of heterogeneity, specifically exploring three questions:(1) Does smart city construction significantly improve the efficiency of environmental pollution governance? (2) Is the impact of smart city construction on the efficiency of environmental governance constrained by structural factors within the city, especially whether the level of public services and the state of industrial development of the city affect the effectiveness of the policy? (3) Does this impact vary according to city characteristics?
In this paper, we use panel data from 193 prefecture-level cities in China from 2007 to 2018 and consider the smart city pilot policy as a quasi-natural experiment. In terms of efficiency measurement, the super-efficient Slacks-Based Measure (SBM) model is used to measure the efficiency of environmental pollution management more precisely. In terms of causal identification, a Multi-period Double-difference (Multi-period DID) model is used to analyze the net policy effect of smart city construction, and the robustness of the conclusions is ensured by the parallel trend test, the placebo test, the replacement of the core explanatory variables, the exclusion of contemporaneous policy interference, and the Propensity Score Matching- Difference in Differences (PSM-DID). In addition, this paper examines the moderating role of public education services and industrial structure and analyses heterogeneity in terms of dimensions such as geographic location, green technology base, pollution level, and government assessment pressure.
This paper focuses on the governmental environmental governance efficiency and directly assesses the role of smart cities as a governance tool in enhancing the effectiveness of public sector environmental management, which enriches the related cross-cutting research. The remainder of this paper is organized as follows. Chapter 2 is literature review. The theoretical hypothesizes are induced in Chapter 3. Chapter 4’s contents are Model design and variable. The empirical analyses are present in Chapter 5. In Chapter 6, we conclude this paper and give some policy recommendations.
2. Theoretical hypothesis
2.1. SCC and environmental governance efficiency
In the process of urbanization, environmental pollution problems have become increasingly prominent, and uneven resource allocation and inefficient government governance have become key bottlenecks for sustainable development. Traditional environmental assessment methods focus on single pollution control, ignoring the structural relationship of "multi-pollution coordinated control-resource constraints-governance behaviour" in urban ecological governance [8, 9]. In the context of smart city construction, environmental governance is shifting from ex post governance to data-driven risk prevention, promoting the evolution of governance logic towards multi-subject collaboration and technology embeddedness [10].
Environmental governance efficiency describes the ecological improvement results achieved by cities under the leadership of the government under limited resources, measures the ability to transform unit input into governance results, reflects the balance between "expected output improvement" and "unexpected output suppression", and has multi-objective and multi-constrained decision-making characteristics [11].
This paper defines environmental governance efficiency as: the relative ability of the urban governance system to transform governance input into expected ecological output and suppress unexpected environmental consequences when facing environmental pollution pressure and resource constraints in a specific region and period. This capability is reflected in the fact that the governance subject (mainly the government) achieves systematic governance of water, air and solid pollution through institutional regulation, financial investment, technical allocation, and organizational implementation, resulting in a balanced input and output.
Government is not only the main body of the city, but also the main object of supervision to improve the EGE. The construction of smart cities improves the transparency of the enterprise's own production process, improves the utilization rate and allocation efficiency of enterprise resources [12], management efficiency and green technology innovation level [10], providing important support for the green transformation of enterprises. Through the construction of information channels and the improvement of communication and feedback channels, the construction of smart cities will delegate the supervision of enterprises to other non-governmental organizations and residents in the city to a certain extent and carry out spontaneous supervision and management of major local polluting enterprises. Public participation plays an important role in improving the quality of social governance [4], and has a good corrective and restrictive effect on environmental governance. More social subjects participate in the construction of smart cities to reduce uncertainty in urban construction, reduce competition and conflicts [13], promote sustainable development concepts, and improve EGE. Based on this, this paper proposes hypothesis 1:
H1: SCC is conducive to improving the efficiency of urban environmental pollution governance.
2.2. The moderating effect of public services in education
The role of smart city construction in improving environmental governance efficiency is subject to complex regulation by multiple factors.
First, public education services affect the environmental governance effect of smart cities through resource competition, time lag and structural mismatch, and the "dilution effect" of governance effectiveness. In the early stages of smart city construction, a large amount of infrastructure investment [14] may squeeze educational resources, leading to a trade-off with environmental governance investment [15], forming a short-term negative interaction. Although environmental education can affect governance performance by improving public participation [16], its effect has a time lag, and the mismatch between traditional education content and smart city skill requirements, as well as the possible path deviation of "system-led rather than public participation" in smart cities [14, 16], may weaken the positive role of education in the short term. In areas where the education level is already high, the marginal gains of smart governance are limited, and even produce a "dilution effect", which is consistent with the observation by [16] Niu, Wang, and Lin that the direct effect of environmental education is not significant. Consequently, this paper proposes hypothesis 2:
H2: Education public services have a negative moderating effect on the efficiency of smart city building and environmental pollution governance.
2.3. Moderating effect of industrial structure rationalization
The rationalization of industrial structure mainly enhances the environmental governance efficiency of smart cities through positive regulatory effects. The resource optimization allocation effect is reflected in the fact that a reasonable industrial structure can reduce resource waste and environmental pollution [17, 18], so that the technology and management optimization of smart cities can be more effectively applied to various industries. Industrial synergy and technology diffusion amplify the positive impact of smart cities by enhancing the synergy of upstream and downstream industrial chains and the rapid promotion of environmental protection technologies [17, 19]. At the same time, the improvement of the institutional environment accompanied by the rationalization of industrial structure creates better conditions for the construction of smart cities and can positively regulate the impact of environmental regulation on air pollution [17], thereby enhancing the effectiveness of environmental regulation tools in the construction of smart cities.
Thus, the paper proposes hypothesis 3:
H3: Rationalization of industrial structure plays a positive moderating role between SCC and EGE.
2.4. Moderating effect of industrial structure upgrading
The upgrading of industrial structure also plays a complex regulatory role. The cost effect of transformation is reflected in the transition from traditional industries to high-tech industries. In the short term, environmental pressure may increase due to the reduction of resource input and "governance tools" [18], offsetting some of the environmental benefits of smart cities.Shao et al.also pointed out that the impact mechanism of environmental regulation and industrial structure upgrading on green economic development is complex, and resource mismatch may occur in the transformation [18]. Differences in technological adaptability and diminishing marginal returns are manifested in the incomplete matching of emerging industries and existing smart technologies, as well as the weakening of the role of smart technologies in improving environmental governance efficiency in the highly advanced stage. The research of Kim, Jung, and Choi [20] supports the possible resource mismatch problem in the development of smart industries. In addition, the increase in local environmental pressure caused by industrial spatial agglomeration and the lack of coordination between industrial upgrading policies and smart city construction policies may also affect the environmental governance effectiveness of smart cities.
Thus, the paper proposes hypothesis 4:
H4: Industrial upgrading plays a negative moderating role between SCC and Exhaust Gas Emissions (EGE).
3. Model design and variable
3.1. Model setting
3.1.1. The measurement of EGE
Introduced by Tone, the Slacks-Based Measure (SBM) model rectifies the Data Envelopment Analysis (DEA) model's neglect of undesired output [11]. This paper employs the super-efficiency SBM model to distinguish among DMUs with peak efficiency, enhancing precision. Focusing on EGE, the Super-SBM model captures all inputs, and the global DEA model improves efficiency evaluations. Using MATLAB's Super-SBM model, we assess pollution control in 193 cities, considering unanticipated outputs.
3.1.2. Multi-period DID
This study uses SCC policy implementation as a policy experiment, noting varied timelines across cities. Using a methodology inspired by Beck, Levine, and Levkov [21], a multi-period DID approach is employed to address endogeneity and gauge the policy's impact on EGE. To further account for biases and endogeneity, the study corroborates results with the PSM-DID model. The multi-period DID model considers SCC pilot policies from 2012 to 2014 as dummy variables, assigning '1' for cities with the policy and '0' for those without. The study's baseline model is presented subsequently (see Model 1):
In Model (1), 'i' represents cities and 't' denotes years.
3.2. Variables and data
3.2.1. Explained variables
This study measures the efficiency of environmental pollution control (envir_v) through urban input (including fixed asset investment, water sector employees and scientific research expenditure). Urban input involves the daily life security of residents. The number of employees directly reflects the city's service investment in environmental governance for residents. The outputs selected are per capita green space, harmless treatment, and sewage treatment, which reflects the concern for the livability and quality of life of residents. The non-expected output is the addition of CO2 to the three industrial wastes of the general green production efficiency index, which also pays attention to the air quality of residents' lives. The construction of the EGE indicator system fully reflects the people-oriented concept. Indicator specifics are in Table 1.
|
Indicator Name |
First level indicators |
Second level indicators |
Unit |
|
Input Indicators |
Capital investment |
The year's urban municipal utilities construction fixed asset investment completion amount |
|
|
Labor input |
Water, environment, and public facilities management industry employees |
Per person |
|
|
Technical support |
Government scientific Expenditures |
|
|
|
Energy input |
Total energy consumption |
||
|
Desired Output Indicators |
Water pollution control situation |
Harmless treatment volume of domestic waste |
|
|
Atmospheric pollution control situation |
Per capita urban green space |
m²/person |
|
|
Solids pollution management |
Municipal sewage treatment capacity |
10⁴ m³/day |
|
|
Non-desired output indicators |
Water pollution |
Industrial wastewater discharge |
|
|
Atmospheric pollution |
Industrial sulfur dioxide (SO₂) emissions |
||
|
Total carbon dioxide (CO₂) emissions |
|||
|
Solids pollution |
Industrial soot/dust emissions |
This research annually analyses the EGE and its indices, averaging values yearly and using these as benchmarks to plot a time trend for both the experimental and control groups. Spatially, Figure 1's cross-sectional analysis reveals that in Central and Eastern smart pilot cities, technical efficiency changes primarily drive EGE. Meanwhile, for the control group, EGE improvement is mainly attributed to shifts in technology gaps.
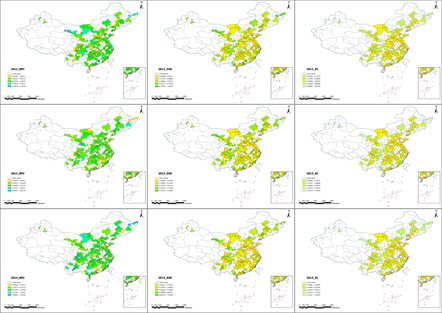
Note: The first row is the change of technology gap, the second row is the efficiency of environmental pollution control, and the third row is the change of technology efficiency.
3.2.2. Core explanatory variables
In this research, the Smart City Pilot Policy (
3.2.3. Control variables
To ensure that the observed improvements in regional environmental pollution control efficiency stem from smart city policies, this study integrates control variables to neutralize the effects of other potential influences. Specifically, for those economic and social indicators that may be affected by policies, such as per capita GDP, fiscal expenditure, financial development, number of enterprises, only the values of the previous year are added to the regression. This ensures that they are not "contaminated" by policies within the DID identification window. Population density is insensitive to smart city policies in the short term, so the current value is used directly. The detailed configuration and computation of these indices are presented in Table 2.
|
Smart City Evaluation Index |
Variable |
Variable name |
Description |
|
Control Variables |
Population density |
lnpopds |
The share of total population in the land area of the administrative region at the end of the year |
|
Economic Scale |
lpgdp |
The lagged Urban GDP per capita (10 thousand yuan) |
|
|
Financial Scale |
Fde |
Balance of deposits in financial institutions at the end of the year as a percentage of regional GDP |
|
|
Convenience of public services and refinement of social management |
Financial Size |
Fisc |
Fiscal spending as a share of total resident population |
|
Industrial System Modernization |
Industrialization level |
Firm |
The number of industrial enterprises above the scale (main business income of 20 million or more) |
3.2.4. Data sources and descriptive statistics
The Super-SBM model uses CO2 emissions data from the CEADs website, supplemented by other sources like the "China City Statistical Yearbook". Any data gaps are filled using the CSMAR database and the "China Statistical Yearbook." Considering significant data omissions after 2018, this study evaluates data from 193 cities between 2007-2018, resulting in 2,316 samples. The multi-period DID model follows national policy for smart city selection and sources control variables from various databases. Missing data is addressed using various statistical sources, with occasional gaps handled by linear interpolation. Table 3 provides the descriptive statistics.
|
Variable Type |
Variable |
N |
Mean |
SD |
Min |
Max |
|
Baseline return |
ege |
2316 |
0. 309 |
0.273 |
0.032 |
2.204 |
|
did |
2316 |
0.192 |
0.394 |
0.000 |
1.000 |
|
|
lnpopds |
2316 |
7.966 |
0.701 |
5.513 |
9.908 |
|
|
lgdpp |
2316 |
4.302 |
3.087 |
0.384 |
25.688 |
|
|
lfd |
2316 |
0.832 |
0.511 |
0.112 |
6.071 |
|
|
lfisc |
2316 |
0.154 |
0.071 |
0.043 |
0.688 |
|
|
lfirm |
2316 |
1588.1 |
1950.464 |
19 |
18792 |
|
|
Moderating effects |
edu |
2316 |
0.029 |
0.013 |
0.003 |
0.130 |
|
indus |
2316 |
0.353 |
4.299 |
0.000 |
206.934 |
|
|
indus2 |
2316 |
6.477 |
0.347 |
5.621 |
7.836 |
|
|
Heterogeneity Analysis |
pm25 |
2316 |
49.315 |
17.919 |
15.448 |
112.075 |
|
goal |
2313 |
0.110 |
0.028 |
0.010 |
0.310 |
4. Empirical analysis
4.1. Benchmark regression analysis
Table 4 presents the foundational regression outcomes of the multi-period DID model. Model (1) estimates the influence of smart city dummy variables on regional environmental pollution control efficiency. Model (2) incorporates individual fixed effects, while model (3) controls for time fixed effects. Lastly, model (4) introduces clustering standard errors at the city level, building on the structure of model (3). In this study, model (4) is employed as the standard regression model.
A Variance Inflation Factor (VIF) is calculated for each of the four models, with all values falling significantly under the threshold of 10, thereby eliminating concerns of multicollinearity. The estimations illustrate a notably positive and stable Smart coefficient, ranging between 0.046 and 0.053 This indicates that the implementation of smart city policies has markedly enhanced the efficiency of regional environmental pollution control within the city, thereby substantiating the hypothesis 1.
|
(1) |
(2) |
(3) |
(4) |
|
|
smart |
0.051*** |
0.053*** |
0.046*** |
0.046** |
|
(0.000) |
(0.000) |
(0.002) |
(0.026) |
|
|
Control variables |
YES |
YES |
YES |
YES |
|
cons |
0.468*** |
0.383*** |
0.512*** |
0.512*** |
|
(0.000) |
(0.000) |
(0.000) |
(0.000) |
|
|
N |
2316 |
2316 |
2316 |
2316 |
|
r2 |
0.091 |
0.012 |
0.091 |
0.091 |
|
id |
No |
Yes |
Yes |
Yes |
|
year |
No |
No |
Yes |
Yes |
|
cluster |
No |
No |
No |
Yes |
Note: p-values in parentheses, * p < 0.1,** p < 0.05,*** p < 0.01.
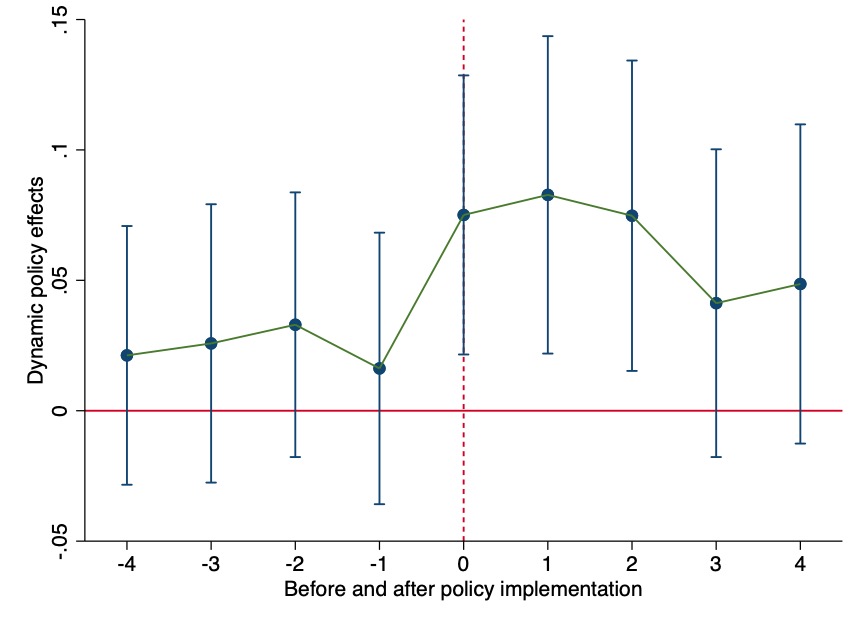
4.2. Parallel trend test
For the multi-period DID model, it's essential to verify that changes in variables are due to policy actions and that trends in experimental and control groups align before policy enforcement. This study uses consistent sample sizes across nine years, centered around the smart city pilot initiation, with 2007 as the base year. Figure 2 shows significant policy effects after implementation for three years, but not thereafter. This difference between the experimental and control groups validates the parallel trend test criteria.
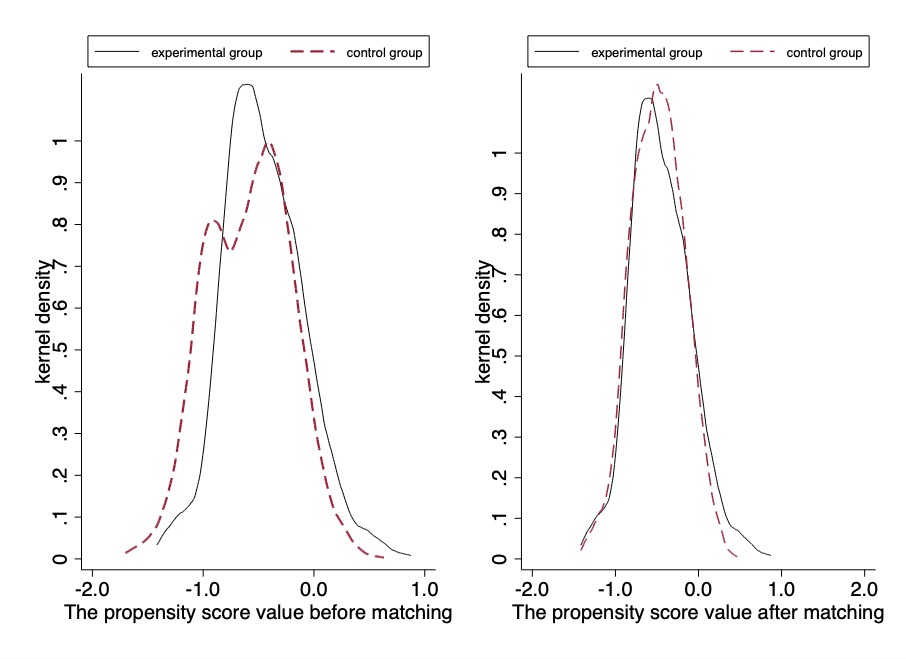
4.3. PSM-DID test
This study utilizes the Propensity Score Matching Difference-in-Differences (PSM-DID) method to counteract the selection bias in the DID model [23]. We apply 1:2 caliper nearest neighbour matching for our estimations, and for robustness, employ various matching techniques, ensuring adherence to common support. Table 5 displays results, highlighting the 'smart' coefficients' consistent positive effects, validating SCC policy's impact on EGE.
|
(1) |
(2) |
(3) |
(4) |
(5) |
(6) |
(7) |
(8) |
|
|
Benchmark regress |
Nearest neighbor matching with caliper |
Kernel radius matching |
Caliper matching |
Nearest neighbor matching |
||||
|
smart |
0.049 |
0.046** |
0.048** |
0.049** |
0.040* |
0.045** |
0.038* |
0.038* |
|
(0.134) |
(0.026) |
(0.022) |
(0.020) |
(0.068) |
(0.029) |
(0.093) |
(0.093) |
|
|
Control variables |
YES |
YES |
YES |
YES |
YES |
YES |
YES |
YES |
|
N |
2316 |
2316 |
1600 |
2123 |
2399 |
2310 |
2316 |
1421 |
|
r2 |
0.014 |
0.608 |
0.637 |
0.605 |
0.669 |
0.608 |
0.642 |
0.642 |
Note: p-values in parentheses, * p < 0.1,** p < 0.05,*** p < 0.01.
To bolster PSM-DID's credibility, we perform a balance and common support test, using a year-by-year matching approach. Figure 3 shows improved balance post-PSM, confirming minimized biases and reinforcing our findings' robustness.
4.4. Placebo test
To mitigate the impact of unpredictable elements on the empirical outcomes, this study constructs a placebo test using a pseudo-experimental group of smart pilot cities. Specifically, out of 144 pilot smart cities, we randomly sample to maintain 71 control groups and 73 experimental groups, repeating this sampling process 500 times. We use the derived 500 sets of treated*time regression coefficients to construct a kernel density plot, which we denote as Figure 4.
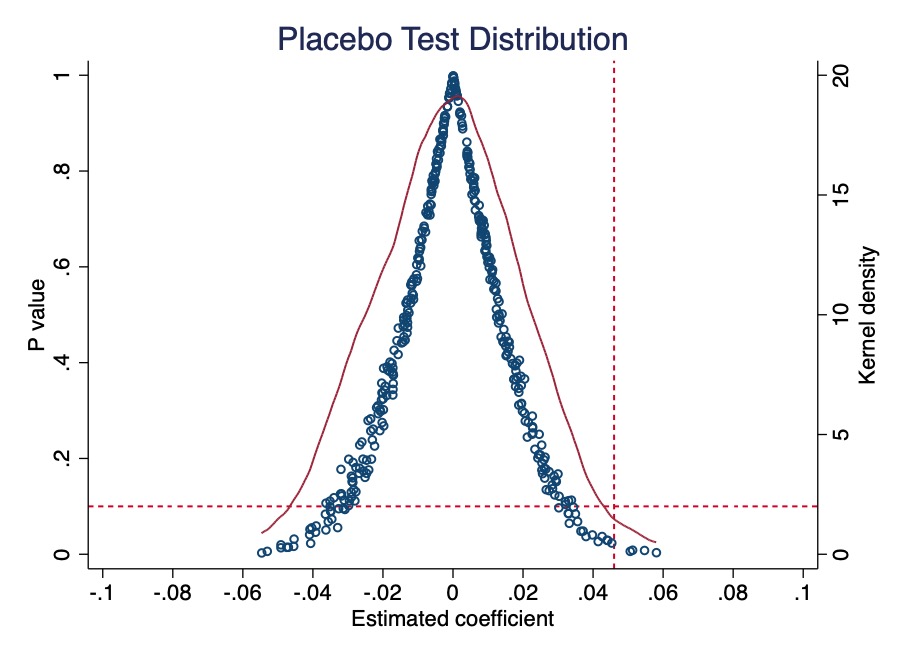
Note: This figure is made in the way of double vertical axes. The black circle represents the P value of the estimated coefficient of each randomly selected city, the solid line is the kernel density distribution of the estimated coefficient, the vertical dotted line represents the estimated coefficient of the real policy, and the horizontal dotted line represents the P value of 0.1.
The estimated coefficient displayed in the figure follows a normal distribution, with the mean and standard deviation proximate to 0. This is considerably distanced from the actual policy implementation, the regression estimated coefficient of which is 0.046, and the P-value is seldom lower than 0.1. This affirms that the study has successfully passed the placebo test. The findings underscore that the efficacy of regional environmental governance is not attributable to unobservable factors or intrinsic city variations.
4.5. Robustness checks
4.5.1. Control non-random assignment of SCP
This paper adopts the "covariate × linear time trend" interaction method mentioned by Li et al. to robustly control the selection bias caused by the co-evolution of policy implementation regions and observed covariates over time [24]. It involves the generation of a new interaction term that controls for time trends, represented as
As depicted in Table 6, this outcome validates the robustness of the foundational regression results.
|
lnpopden |
lgdpper |
lfd |
lfisc |
lfirm |
|
|
smart |
0.045*** |
0.045*** |
0.046*** |
0.046*** |
0.046*** |
|
(0.003) |
(0.003) |
(0.002) |
(0.002) |
(0.002) |
|
|
Control variables |
YES |
YES |
YES |
YES |
YES |
|
cons |
0.458*** |
0.473*** |
0.514*** |
0.530*** |
0.509*** |
|
(0.000) |
(0.000) |
(0.000) |
(0.000) |
(0.000) |
|
|
N |
2316 |
2316 |
2316 |
2316 |
2316 |
|
r2 |
0.092 |
0.095 |
0.091 |
0.092 |
0.091 |
|
id year cluster |
Yes Yes Yes |
Yes Yes Yes |
Yes Yes Yes |
Yes Yes Yes |
Yes Yes Yes |
Note: p-values in parentheses, * p < 0.1,** p < 0.05,*** p < 0.01.
4.5.2. Excluding other policy interference
During 2007-2018, other urban policies might have influenced the effects of smart city policy on EGE. To discern the specific impact of SCC policies, this study examined concurrent urban pilot policies related to this efficiency. These included the 2008 innovative city policy, the 2010 low-carbon city pilot, and the 2011 energy conservation and emissions reduction demonstration city policy.
Using the 'treated' variable, three dummy variables ('time1', 'time2', and 'time3') were created to denote the timelines of these policies, marked as 1 post-policy initiation and 0 before. Interaction terms 'low_carbon', 'low_energy', and 'creat' were then developed, each corresponding to a policy.
Table 7's regression results (2)-(4) show the smart city policy variable's coefficient consistently positive, with the other three policy coefficients insignificant. This indicates that the enhanced EGE from 2007 to 2018 is primarily due to smart city policies, reinforcing the study's validity, as other policies didn't significantly influence the outcome.
|
(1) |
(2) |
(3) |
(4) |
|
|
smart |
0.047** |
0.046** |
0.046** |
|
|
(0.023) |
(0.022) |
(0.032) |
||
|
smart_5 |
0.043 |
|||
|
(0.108) |
||||
|
low_ green |
0.021 |
|||
|
(0.293) |
||||
|
low_ energy |
-0.006 |
|||
|
(0.837) |
||||
|
creat |
0.004 |
|||
|
(0.868) |
||||
|
Control variables |
YES |
YES |
YES |
YES |
|
cons |
0.515*** |
0.507*** |
0.512*** |
0.511*** |
|
(0.000) |
(0.000) |
(0.000) |
(0.000) |
|
|
N |
2316 |
2316 |
2316 |
2316 |
|
r2 |
0.089 |
0.092 |
0.091 |
0.091 |
|
id |
Yes |
Yes |
Yes |
Yes |
|
year |
Yes |
Yes |
Yes |
Yes |
|
control |
Yes |
Yes |
Yes |
Yes |
|
cluster |
Yes |
Yes |
Yes |
Yes |
Note: p-values in parentheses, * p < 0.1,** p < 0.05,*** p < 0.01.
4.6. Moderating effects
The establishment of smart cities has resulted in a rather noticeable positive effect on EGE. However, theoretical analyses reveal that current SCC efforts have not yielded significant improvements in public education services and the rationalization of the industrial structure, thereby attenuating the influence of SCC on EGE. In the subsequent section of this paper, we conduct an empirical investigation of this moderating effect.
To represent the level of public education services, we select government educational expenditure as a proportion of regional GDP. The specific indicator of rationalization and upgrading of the industrial structure across various prefecture-level cities are following the former research [25, 26]. The model for assessing the moderating effect is structured as Model (3):
|
(1) |
(2) |
(3) |
(4) |
|
|
smart |
0.046*** |
0.143*** |
0.003 |
0.634* |
|
(0.002) |
(0.003) |
(0.896) |
(0.070) |
|
|
edu |
0.006 |
|||
|
(0.623) |
||||
|
smart*edu |
-0.032** |
|||
|
(0.018) |
||||
|
edu2 |
||||
|
smart*edu*edu |
||||
|
indus |
-0.071 |
|||
|
(0.337) |
||||
|
smart*indus |
0.156* |
|||
|
(0.056) |
||||
|
indus2 |
0.062 |
|||
|
(0.499) |
||||
|
smart*indus2 |
-0.091* |
|||
|
(0.086) |
||||
|
Control variables |
YES |
YES |
YES |
YES |
|
cons |
0.512*** |
0.513*** |
0.565*** |
0.154 |
|
(0.000) |
(0.000) |
(0.000) |
(0.796) |
|
|
N |
2316 |
2316 |
2316 |
2316 |
|
r2 |
0.091 |
0.094 |
0.088 |
0.088 |
|
id |
Yes |
Yes |
Yes |
Yes |
|
year |
Yes |
Yes |
Yes |
Yes |
|
cluster |
Yes |
Yes |
Yes |
Yes |
Note: p-values in parentheses, * p < 0.1,** p < 0.05,*** p < 0.01.
Table 8 reveals that regardless of the presence of moderating variables, the development of smart cities can significantly enhance the EGE at a 5% significance level. More precisely, the coefficients of both the interaction term (smart*edu) and SCC policy (smart) are significantly negative. This suggests that the beneficial influence of SCC on the EGE is mitigated by the adverse adjustment effect of education and public services. The moderating effect of in upgrade of industrial structure aligns with this, adhering to theoretical predictions. Nevertheless, as seen from model (3), the rationalization of the industrial structure does not markedly influence the relationship between the two entities.
4.7. Further expansion: heterogeneity analysis
Different types of ecosystems and social environments require different approaches to strategic environmental governance, adapted to local circumstances [27]. To explore the hypothesis of heterogeneity in the influence of SCC on the EGE, the analysis encompasses three dimensions: geographical location of cities, economic development level, city types.
4.7.1. Heterogeneity of urban geographic location and economic levels
Since China's economic reforms, foreign trade has surged, driving resources and talent from the western interior to the eastern coastline. Consequently, eastern cities have advanced past central and western ones in infrastructure and technology. As urban economic growth lures key production factors, it's important to analyse the varied effects of smart city policies on environmental governance efficiency (EGE) by city location and technology status. Using median green technology for classification, Table 9 reveals cities with a higher green technology base experience enhanced EGE from smart city initiatives. Geographically, cities are classified as eastern, central, or western per the National Bureau of Statistics' criteria. Table 9 shows eastern cities benefit from smart city policies, attributed to their economic vitality and urban size.
|
Green technology level |
Urban geographic location |
|||
|
High green tech |
Low green tech |
East |
Middle and West |
|
|
smart |
0.068** |
0.057 |
0.104*** |
0.004 |
|
(0.037) |
(0.146) |
(0.004) |
(0.869) |
|
|
Control variables |
Yes |
Yes |
Yes |
Yes |
|
cons |
0.512 |
0.639*** |
0.288 |
0.559*** |
|
(0.119) |
(0.000) |
(0.215) |
(0.001) |
|
|
N |
1165 |
1151 |
1056 |
1260 |
|
r2 |
0.082 |
0.148 |
0.076 |
0.126 |
|
id |
Yes |
Yes |
Yes |
Yes |
|
year |
Yes |
Yes |
Yes |
Yes |
|
cluster |
Yes |
Yes |
Yes |
Yes |
Note: p-values in parentheses, * p < 0.1,** p < 0.05,*** p < 0.01.
4.7.2. Heterogeneity of the three city types
Urban PM2.5 concentrations, sourced from the Atmospheric Composition Analysis Group at Dalhousie University, were used to represent urban air pollution. Following Zhou [28], GDP growth objectives of prefecture-level cities and provinces were extracted from their reports. The ratio of these growth targets served as a local government performance metric. Table 10 highlights SCC effects across cities: (1) High-pollution cities show greater EGE improvements post-SCC than low-pollution cities. (2) The stronger the achievement of government goals, the greater SCC's positive impact on EGE, suggesting current prefecture-level cities haven't reached the performance pressure's inflection point.
|
Air pollution level |
Government Assessment Target Performance |
|||
|
High pollution |
Low pollution |
High Target |
Low target |
|
|
smart |
0.047** |
0.033 |
0.066** |
0.002 |
|
(0.043) |
(0.175) |
(0.023) |
(0.945) |
|
|
Control variables |
Yes |
Yes |
Yes |
Yes |
|
cons |
0.524*** |
0.517*** |
0.544*** |
0.546** |
|
(0.001) |
(0.001) |
(0.008) |
(0.015) |
|
|
N |
1158 |
1158 |
1261 |
1055 |
|
r2 |
0.081 |
0.081 |
0.073 |
0.082 |
|
id |
Yes |
Yes |
Yes |
Yes |
|
year |
Yes |
Yes |
Yes |
Yes |
|
cluster |
Yes |
Yes |
Yes |
Yes |
Note: p-values in parentheses, * p < 0.1,** p < 0.05,*** p < 0.01.
5. Discussion and conclusion
5.1. Review of research questions, hypotheses and core findings
This study aims to explore the impact of China's smart city construction on Environmental Governance Efficiency (EGE) and its mechanism of action, and to evaluate the environmental effectiveness of this national policy. We assume that smart city construction can improve EGE, but its effect is moderated by public education services and industrial structure. Through multi-period DID analysis of panel data of 193 prefecture-level cities in China from 2007 to 2018, it is confirmed that smart city policies significantly promote the improvement of EGE, but this positive effect disappears three years after implementation. The analysis of key regulatory mechanisms found that public education services and advanced industrial structure both have an inhibitory negative regulation on the positive effect of smart cities on improving EGE, and the rationalization of industrial structure has a positive regulatory effect. In addition, there is significant urban heterogeneity in policy effects in terms of economic foundation, geographical location, environmental pressure, government assessment and green innovation capabilities.
5.2. Comparison with existing studies
This study resonates with and innovates with existing literature. The positive impact of smart city construction on EGE is consistent with the widely recognized view that smart technology can empower environmental monitoring and resource optimization [29]. The heterogeneity of policy effects also echoes the law that local conditions constrain policy effectiveness in regional development [30, 31]. However, this study is unique in that it explicitly focuses on the efficiency of government environmental governance rather than just focusing on environmental quality improvement, providing direct evidence for evaluating the role of smart cities in improving the effectiveness of public sector environmental management. More importantly, we innovatively examine the moderating role of public education services and industrial structure. Regarding public education services, this study reveals that they may have negative regulation due to resource competition and skill mismatch in the early stages of smart city construction, which contrasts and complements the view of [16] Niu, Wang, and Lin that education needs to effectively stimulate public participation to improve governance. Regarding industrial structure, consistent with Zhao and Zhang [32], this paper also confirms the contribution of industrial structure rationalization to environmental sustainability, but this study finds that industrial structure upgrading may produce negative regulation, which suggests the complexity of the coordination between smart technology and industrial base [18]. also confirmed this point in their discussion on the complexity of the relationship between environmental regulation, industrial transformation, and green economy. These differences may be due to the uniqueness of the research perspective, sample period and policy promotion model in China's specific context.
5.3. Explanation of the research results
The core of smart city construction to improve EGE lies in its intelligent and precise environmental management through ICT technology. The non-permanence of policy effectiveness reminds us that after the initial technological dividend, continuous institutional innovation and deep integration are the key. The negative regulation of public education services can be attributed to the crowding out of financial resources by smart city infrastructure construction [14], as well as the lag of the traditional education system in cultivating environmental governance talents needed in the smart era, and the failure to quickly transform environmental awareness into effective digital participation [16]. The negative regulation of industrial structure upgrading may be due to the reduction of the marginal space for smart technology to improve the efficiency of traditional pollution control in cities with relatively optimized industrial structures, or the lack of deep integration of the governance focus and industry in the early stage of smart cities [18]. The heterogeneity effect clearly shows that a good economic foundation, a developed eastern location, urgent governance needs, clear policy orientation and strong technology absorption capacity are important prerequisites for the full release of the environmental dividends of smart cities.
5.4. Limitations and deficiencies of the study
Although this study strives to be rigorous, it still has limitations. First, due to data availability, the sample only covers 193 prefecture-level cities, and the conclusions should be cautiously promoted to all types of cities across the country. Secondly, in terms of variable measurement, the measurement of EGE itself is complex, and there is a lack of direct energy input data for government environmental governance. Finally, the mechanism analysis is mainly carried out through the regulatory effect, and the "black box" revelation of more micro-level technology applications, data sharing and other specific paths within smart cities still needs to be deepened.
5.5. Significance and application of research results
This study has significant theoretical and practical significance for China and other countries committed to improving environmental governance capabilities through digital transformation. In theory, it confirms the positive role of smart city construction in improving government EGE, expands the research boundaries of smart city environmental effects, and deepens the understanding of the complexity of smart city policy implementation by revealing the complex regulatory mechanism of public education services and industrial structure.
This study suggests three key strategies to optimize the impact of smart city policies on regional EGE:
Develop a Comprehensive Smart City Framework: SCC boosts EGE, supporting carbon goals. We recommend a nationwide adoption of SCC policies, incorporating innovation, entrepreneurship, supply-side reforms, and digital transformation. A data-driven, innovative, and green evaluation system, rooted in user-centric design, is essential.
Enhance Public Education & Industrial Structure:
Public Education: The government should unify data standards in smart education, streamlining fragmented educational data, and emphasize the role of smart education in cultivating environmental governance expertise.
Industrial Restructuring: Encourage a shift towards green tech talent and transform high-pollution industries. Promote inter-industry collaboration, spotlighting sectors like AI as green development accelerators, to uplift EGE.
Implement Region-Specific Policies: Given the varied effects of smart city policies by city characteristics, targeted strategies are crucial. Coastal cities should influence adjacent areas, with central and western regions prioritized for SCC. Economically challenged cities should adopt a staged approach, while those with poor air quality should strengthen regulations.
Overall, these strategies seek balanced city development, enhancing national EGE.
References
[1]. Kampa, Marilena, and Elias Castanas. 2008. “Human Health Effects of Air Pollution.”Environmental Pollution151 (2). Elsevier: 362–367.
[2]. Usman, Ahmed, Ilhan Ozturk, Syed Muhammad Muddassir Abbas Naqvi, Sana Ullah, and Muhammad Imran Javed. 2022. “Revealing the Nexus between Nuclear Energy and Ecological Footprint in STIRPAT Model of Advanced Economies: Fresh Evidence from Novel CS-ARDL Model.”Progress in Nuclear Energy148. Elsevier: 104220.
[3]. Schaffers, Hans, Nicos Komninos, Marc Pallot, Brigitte Trousse, Michael Nilsson, and Alvaro Oliveira. 2011. Smart Cities and the Future Internet: Towards Cooperation Frameworks for Open Innovation. Springer Berlin Heidelberg.
[4]. Hasan, Iftekhar, Chun-Keung Stan Hoi, Qiang Wu, and Hao Zhang. 2020. “Is Social Capital Associated with Corporate Innovation? Evidence from Publicly Listed Firms in the US.”Journal of Corporate Finance62. Elsevier: 101623.
[5]. Ren, Fei, Yuke Zhu, and Dong Le. 2022. “The Spatial Effect of Air Pollution Governance on Labor Productivity: Evidence from 262 Chinese Cities.”International Journal of Environmental Research and Public Health19 (20). MDPI: 13694.
[6]. Khan, Huma H, Muhammad N Malik, Raheel Zafar, Feybi A Goni, Abdoulmohammad G Chofreh, Jiří J Klemeš, and Youseef Alotaibi. 2020. “Challenges for Sustainable Smart City Development: A Conceptual Framework.”Sustainable Development28 (5). Wiley Online Library: 1507–1518.
[7]. Díaz-Parra, Ocotlán, Alejandro Fuentes-Penna, Ricardo A Barrera-Cámara, Francisco Rafael Trejo-Macotela, Julio César Ramos Fernández, Jorge A Ruiz-Vanoye, Alberto Ochoa-Zezzatti, and Jazmín Rodríguez-Flores. 2022. “Smart Education and Future Trends.”Int. J. Comb. Optim. Probl. Informatics13 (1): 65–74.
[8]. Lemos, Maria Carmen, and Arun Agrawal. 2006. “Environmental Governance.”Annual Review of Environment and Resources31 (2006). Annual Reviews: 297–325.
[9]. Peng, Benhong, Hong Chen, Ehsan Elahi, and Guo Wei. 2020. “Study on the Spatial Differentiation of Environmental Governance Performance of Yangtze River Urban Agglomeration in Jiangsu Province of China.”Land Use Policy99. Elsevier: 105063.
[10]. Guo, Chong, Yuelin Wang, Yiteng Hu, Yingyu Wu, and Xiaobing Lai. 2022. “Does Smart City Policy Improve Corporate Green Technology Innovation? Evidence from Chinese Listed Companies.”Journal of Environmental Planning and Management. Taylor & Francis, 1–30.
[11]. Tone, Kaoru. 2001. “A Slacks-Based Measure of Efficiency in Data Envelopment Analysis.”European Journal of Operational Research130 (3). Elsevier: 498–509.
[12]. Liu, Kui, Chuyan Meng, Jing Tan, and Guanglu Zhang. 2023. “Do Smart Cities Promote a Green Economy? Evidence from a Quasi-Experiment of 253 Cities in China.”Environmental Impact Assessment Review99. Elsevier: 107009.
[13]. Luque-Ayala, Andrés, and Simon Marvin. 2015. “Developing a Critical Understanding of Smart Urbanism?”Urban Studies52 (12). Sage Publications Sage UK: London, England: 2105–2116.
[14]. Mutambik, Ibrahim, Abdullah Almuqrin, Fawaz Alharbi, and Majed Abusharhah. 2023. “How to Encourage Public Engagement in Smart City Development—Learning from Saudi Arabia.”Land12 (10). MDPI: 1851.
[15]. Kaiser, Z R M Abdullah. 2024. “Smart Governance for Smart Cities and Nations.”Journal of Economy and Technology2. Elsevier: 216–234.
[16]. Niu, Yifei, Xi Wang, and Ciyun Lin. 2022. “A Study on the Impact of Organizing Environmental Awareness and Education on the Performance of Environmental Governance in China.”International Journal of Environmental Research and Public Health19 (19). MDPI: 12852.
[17]. Liu, Yu, Chun-Ni Xie, Zi-Shuang Wang, Noure-El Houda Rebai, and Xiao-Min Lai. 2023. “The Role of Industrial Structure Upgrading in Moderating the Impact of Environmental Regulation on Air Pollution: Evidence from China.”Atmosphere14 (10). MDPI: 1537.
[18]. Shao, Huimin, Qiong Peng, Fei Zhou, and Walton Wider. 2024. “Environmental Regulation, Industrial Transformation, and Green Economy Development.”Frontiers in Environmental Science12. Frontiers Media SA: 1442072.
[19]. Zhu, Shengjun, Canfei He, and Ying Liu. 2014. “Going Green or Going Away: Environmental Regulation, Economic Geography and Firms’ Strategies in China’s Pollution-Intensive Industries.”Geoforum55. Elsevier: 53–65.
[20]. Kim, Kyunam, Jung-Kyu Jung, and Jae Young Choi. 2016. “Impact of the Smart City Industry on the Korean National Economy: Input-Output Analysis.”Sustainability8 (7). MDPI: 649.
[21]. Beck, Thorsten, Ross Levine, and Alexey Levkov. 2010. “Big Bad Banks? The Winners and Losers from Bank Deregulation in the United States.”The Journal of Finance65 (5). Wiley Online Library: 1637–1667.
[22]. Yao, Tingting, Zelin Huang, and Wei Zhao. 2020. “Are Smart Cities More Ecologically Efficient? Evidence from China.”Sustainable Cities and Society60. Elsevier: 102008.
[23]. Heckman, James J, Hidehiko Ichimura, and Petra Todd. 1998. “Matching as an Econometric Evaluation Estimator.”The Review of Economic Studies65 (2). Wiley-Blackwell: 261–294.
[24]. Li, Pei, Yi Lu, and Jin Wang. 2016. “Does Flattening Government Improve Economic Performance? Evidence from China.”Journal of Development Economics123. Elsevier: 18–37.
[25]. Wu, Ning, and ZuanKuo Liu. 2021. “Higher Education Development, Technological Innovation and Industrial Structure Upgrade.”Technological Forecasting and Social Change162. Elsevier: 120400.
[26]. Zhang, L, and H Cui. 2018. “Impact of Urban Industrial Structure Optimization on Carbon Emissions of Urban Agglomeration in the Middle Reaches of the Yangtze River.”Reform11: 130–138.
[27]. Bennett, Nathan J, and Terre Satterfield. 2018. “Environmental Governance: A Practical Framework to Guide Design, Evaluation, and Analysis.”Conservation Letters11 (6). Wiley Online Library: e12600.
[28]. Zhou, Li-an. 2007. “Governing China’s Local Officials: An Analysis of Promotion Tournament Model.”Economic Research Journal7 (36): 36–50.
[29]. Olawade, David B, Ojima Z Wada, Abimbola O Ige, Bamise I Egbewole, Adedayo Olojo, and Bankole I Oladapo. 2024. “Artificial Intelligence in Environmental Monitoring: Advancements, Challenges, and Future Directions.”Hygiene and Environmental Health Advances. Elsevier, 100114.
[30]. Guan, Shuai, Jinquan Liu, Yongfu Liu, and Mingze Du. 2022. “The Nonlinear Influence of Environmental Regulation on the Transformation and Upgrading of Industrial Structure.”International Journal of Environmental Research and Public Health19 (14). MDPI: 8378.
[31]. Nizalov, Denys, and Scott Loveridge. 2005. “The Differential Impact of Regional Policies on Economic Growth: One Size Does Not Fit All.”
[32]. Zhao, Dandan, and Jinsong Zhang. 2021. “Research on the Influence of Industrial Structure on the Investment Efficiency of Regional Environmental Pollution
Cite this article
Wang,Z. (2025). Towards sustainable urban development: analysing Smart City Construction for better environmental governance. Journal of Applied Economics and Policy Studies,18(6),69-83.
Data availability
The datasets used and/or analyzed during the current study will be available from the authors upon reasonable request.
Disclaimer/Publisher's Note
The statements, opinions and data contained in all publications are solely those of the individual author(s) and contributor(s) and not of EWA Publishing and/or the editor(s). EWA Publishing and/or the editor(s) disclaim responsibility for any injury to people or property resulting from any ideas, methods, instructions or products referred to in the content.
About volume
Journal:Journal of Applied Economics and Policy Studies
© 2024 by the author(s). Licensee EWA Publishing, Oxford, UK. This article is an open access article distributed under the terms and
conditions of the Creative Commons Attribution (CC BY) license. Authors who
publish this series agree to the following terms:
1. Authors retain copyright and grant the series right of first publication with the work simultaneously licensed under a Creative Commons
Attribution License that allows others to share the work with an acknowledgment of the work's authorship and initial publication in this
series.
2. Authors are able to enter into separate, additional contractual arrangements for the non-exclusive distribution of the series's published
version of the work (e.g., post it to an institutional repository or publish it in a book), with an acknowledgment of its initial
publication in this series.
3. Authors are permitted and encouraged to post their work online (e.g., in institutional repositories or on their website) prior to and
during the submission process, as it can lead to productive exchanges, as well as earlier and greater citation of published work (See
Open access policy for details).
References
[1]. Kampa, Marilena, and Elias Castanas. 2008. “Human Health Effects of Air Pollution.”Environmental Pollution151 (2). Elsevier: 362–367.
[2]. Usman, Ahmed, Ilhan Ozturk, Syed Muhammad Muddassir Abbas Naqvi, Sana Ullah, and Muhammad Imran Javed. 2022. “Revealing the Nexus between Nuclear Energy and Ecological Footprint in STIRPAT Model of Advanced Economies: Fresh Evidence from Novel CS-ARDL Model.”Progress in Nuclear Energy148. Elsevier: 104220.
[3]. Schaffers, Hans, Nicos Komninos, Marc Pallot, Brigitte Trousse, Michael Nilsson, and Alvaro Oliveira. 2011. Smart Cities and the Future Internet: Towards Cooperation Frameworks for Open Innovation. Springer Berlin Heidelberg.
[4]. Hasan, Iftekhar, Chun-Keung Stan Hoi, Qiang Wu, and Hao Zhang. 2020. “Is Social Capital Associated with Corporate Innovation? Evidence from Publicly Listed Firms in the US.”Journal of Corporate Finance62. Elsevier: 101623.
[5]. Ren, Fei, Yuke Zhu, and Dong Le. 2022. “The Spatial Effect of Air Pollution Governance on Labor Productivity: Evidence from 262 Chinese Cities.”International Journal of Environmental Research and Public Health19 (20). MDPI: 13694.
[6]. Khan, Huma H, Muhammad N Malik, Raheel Zafar, Feybi A Goni, Abdoulmohammad G Chofreh, Jiří J Klemeš, and Youseef Alotaibi. 2020. “Challenges for Sustainable Smart City Development: A Conceptual Framework.”Sustainable Development28 (5). Wiley Online Library: 1507–1518.
[7]. Díaz-Parra, Ocotlán, Alejandro Fuentes-Penna, Ricardo A Barrera-Cámara, Francisco Rafael Trejo-Macotela, Julio César Ramos Fernández, Jorge A Ruiz-Vanoye, Alberto Ochoa-Zezzatti, and Jazmín Rodríguez-Flores. 2022. “Smart Education and Future Trends.”Int. J. Comb. Optim. Probl. Informatics13 (1): 65–74.
[8]. Lemos, Maria Carmen, and Arun Agrawal. 2006. “Environmental Governance.”Annual Review of Environment and Resources31 (2006). Annual Reviews: 297–325.
[9]. Peng, Benhong, Hong Chen, Ehsan Elahi, and Guo Wei. 2020. “Study on the Spatial Differentiation of Environmental Governance Performance of Yangtze River Urban Agglomeration in Jiangsu Province of China.”Land Use Policy99. Elsevier: 105063.
[10]. Guo, Chong, Yuelin Wang, Yiteng Hu, Yingyu Wu, and Xiaobing Lai. 2022. “Does Smart City Policy Improve Corporate Green Technology Innovation? Evidence from Chinese Listed Companies.”Journal of Environmental Planning and Management. Taylor & Francis, 1–30.
[11]. Tone, Kaoru. 2001. “A Slacks-Based Measure of Efficiency in Data Envelopment Analysis.”European Journal of Operational Research130 (3). Elsevier: 498–509.
[12]. Liu, Kui, Chuyan Meng, Jing Tan, and Guanglu Zhang. 2023. “Do Smart Cities Promote a Green Economy? Evidence from a Quasi-Experiment of 253 Cities in China.”Environmental Impact Assessment Review99. Elsevier: 107009.
[13]. Luque-Ayala, Andrés, and Simon Marvin. 2015. “Developing a Critical Understanding of Smart Urbanism?”Urban Studies52 (12). Sage Publications Sage UK: London, England: 2105–2116.
[14]. Mutambik, Ibrahim, Abdullah Almuqrin, Fawaz Alharbi, and Majed Abusharhah. 2023. “How to Encourage Public Engagement in Smart City Development—Learning from Saudi Arabia.”Land12 (10). MDPI: 1851.
[15]. Kaiser, Z R M Abdullah. 2024. “Smart Governance for Smart Cities and Nations.”Journal of Economy and Technology2. Elsevier: 216–234.
[16]. Niu, Yifei, Xi Wang, and Ciyun Lin. 2022. “A Study on the Impact of Organizing Environmental Awareness and Education on the Performance of Environmental Governance in China.”International Journal of Environmental Research and Public Health19 (19). MDPI: 12852.
[17]. Liu, Yu, Chun-Ni Xie, Zi-Shuang Wang, Noure-El Houda Rebai, and Xiao-Min Lai. 2023. “The Role of Industrial Structure Upgrading in Moderating the Impact of Environmental Regulation on Air Pollution: Evidence from China.”Atmosphere14 (10). MDPI: 1537.
[18]. Shao, Huimin, Qiong Peng, Fei Zhou, and Walton Wider. 2024. “Environmental Regulation, Industrial Transformation, and Green Economy Development.”Frontiers in Environmental Science12. Frontiers Media SA: 1442072.
[19]. Zhu, Shengjun, Canfei He, and Ying Liu. 2014. “Going Green or Going Away: Environmental Regulation, Economic Geography and Firms’ Strategies in China’s Pollution-Intensive Industries.”Geoforum55. Elsevier: 53–65.
[20]. Kim, Kyunam, Jung-Kyu Jung, and Jae Young Choi. 2016. “Impact of the Smart City Industry on the Korean National Economy: Input-Output Analysis.”Sustainability8 (7). MDPI: 649.
[21]. Beck, Thorsten, Ross Levine, and Alexey Levkov. 2010. “Big Bad Banks? The Winners and Losers from Bank Deregulation in the United States.”The Journal of Finance65 (5). Wiley Online Library: 1637–1667.
[22]. Yao, Tingting, Zelin Huang, and Wei Zhao. 2020. “Are Smart Cities More Ecologically Efficient? Evidence from China.”Sustainable Cities and Society60. Elsevier: 102008.
[23]. Heckman, James J, Hidehiko Ichimura, and Petra Todd. 1998. “Matching as an Econometric Evaluation Estimator.”The Review of Economic Studies65 (2). Wiley-Blackwell: 261–294.
[24]. Li, Pei, Yi Lu, and Jin Wang. 2016. “Does Flattening Government Improve Economic Performance? Evidence from China.”Journal of Development Economics123. Elsevier: 18–37.
[25]. Wu, Ning, and ZuanKuo Liu. 2021. “Higher Education Development, Technological Innovation and Industrial Structure Upgrade.”Technological Forecasting and Social Change162. Elsevier: 120400.
[26]. Zhang, L, and H Cui. 2018. “Impact of Urban Industrial Structure Optimization on Carbon Emissions of Urban Agglomeration in the Middle Reaches of the Yangtze River.”Reform11: 130–138.
[27]. Bennett, Nathan J, and Terre Satterfield. 2018. “Environmental Governance: A Practical Framework to Guide Design, Evaluation, and Analysis.”Conservation Letters11 (6). Wiley Online Library: e12600.
[28]. Zhou, Li-an. 2007. “Governing China’s Local Officials: An Analysis of Promotion Tournament Model.”Economic Research Journal7 (36): 36–50.
[29]. Olawade, David B, Ojima Z Wada, Abimbola O Ige, Bamise I Egbewole, Adedayo Olojo, and Bankole I Oladapo. 2024. “Artificial Intelligence in Environmental Monitoring: Advancements, Challenges, and Future Directions.”Hygiene and Environmental Health Advances. Elsevier, 100114.
[30]. Guan, Shuai, Jinquan Liu, Yongfu Liu, and Mingze Du. 2022. “The Nonlinear Influence of Environmental Regulation on the Transformation and Upgrading of Industrial Structure.”International Journal of Environmental Research and Public Health19 (14). MDPI: 8378.
[31]. Nizalov, Denys, and Scott Loveridge. 2005. “The Differential Impact of Regional Policies on Economic Growth: One Size Does Not Fit All.”
[32]. Zhao, Dandan, and Jinsong Zhang. 2021. “Research on the Influence of Industrial Structure on the Investment Efficiency of Regional Environmental Pollution