


1. Introduction
As an important carrier for promoting technological innovation and absorbing employment, the financing efficiency of Small and medium-sized enterprises (SMEs) is directly related to the vitality and sustainable development of the real economy [1]. However, due to information asymmetry, credit constraints and capital market threshold limitations, SMEs have long been in a disadvantaged position in the traditional financing system, and the problems of difficult and expensive financing have never been effectively alleviated. In recent years, countries have successively constructed a multi-level capital market system, through the establishment of differentiated platforms such as the Main Board, GEM, and New Third Board, and the introduction of incentives such as tax exemptions and fiscal subsidies, with a view to optimizing the allocation of resources and enhancing the inclusiveness of the market [2]. In this context, tax incentives as an important means of policy regulation, the effect of its role in different industries, regions and types of enterprises show significant heterogeneity, the existing research focuses on the assessment of policy effects, but the lack of dynamic response to the path of the mechanism of modeling, and it is difficult to explain the differences in the efficiency of the policy conduction of the different market tiers [3]. To fill the above gaps, this paper integrates reinforcement learning and causal inference methods to construct a framework for assessing the dynamic impact of multi-level tax incentives on SMEs' financing efficiency, reveals the evolution of policy effects in time and structural dimensions, and puts forward strategic suggestions for precise incentives in sub-markets.
2. Literature review
2.1. Multi-tier capital markets and financing constraints
The establishment of a multi-level capital market aims to enhance the efficiency of capital allocation through layered governance and layered pricing, and to alleviate the mismatch in financing channels for enterprises at different growth stages [4]. Relevant studies have concluded that the Main Board favors mature enterprises, while the GEM and the New Third Board (NSE) are more adapted to the early-stage financing needs of small and medium-sized or innovative enterprises, forming a structural market division [5]. However, information barriers, insufficient institutional connectivity and liquidity gaps between tiers make SMEs face significant obstacles in the process of market migration and financing optimization, and the cost of financing rises for some enterprises due to the lack of exit mechanisms and market activity. Some scholars have pointed out that the multilayered structure has not fundamentally changed the financing disadvantages of SMEs, and has even created the risk of “marginalization” in the allocation of policy resources [6].
2.2. Tax incentive theories and empirical evidence
Incentive mechanisms such as income tax relief and investment tax credits have been widely used in multi-layer capital market structures, and different studies have verified their positive effects in promoting investment and improving capital utilization efficiency based on the perspectives of macroeconomics, corporate finance and institutional economics, respectively [7]. However, some studies have also pointed out that tax incentives have ambiguous objectives, uneven implementation and regulatory arbitrage, and that the effect of the policy is easily constrained by the size of the enterprise, its life cycle and industry attributes, which leads to unsustainable incentives and even adverse selection [8]. In addition, most of the current empirical studies still remain in the static regression framework, which is difficult to capture the period-by-period response of enterprise behavior to tax policy, and lacks the modeling of key factors such as timeliness and behavioral delays in the transmission mechanism of the policy, thus limiting the scientific assessment of the long-term performance of the policy [9].
2.3. Computational finance and policy evaluation
Accompanied by the development of big data and artificial intelligence, financial policy evaluation methods have gradually transformed from traditional econometric regression to intelligent modeling approaches represented by reinforcement learning and causal inference, especially in policy behavior prediction and dynamic effect identification, which show significant advantages. Reinforcement learning can simulate the optimal response paths of enterprises in the changing policy environment, and dynamically optimize the strategy selection by combining time-series data [10]. The causal inference approach helps to strip out covariate interference and accurately identify the processing effects and heterogeneous structure of tax incentives. Existing studies have verified the feasibility and robustness of such methods in the areas of monetary policy transmission, fiscal expenditure efficiency, credit allocation mechanism, etc., but they still have limited application in tax policy, especially in SME financing scenarios under multi-level market structure [11].
3. Methodology
3.1. Data construction and variable definition
This study focuses on Chinese SMEs listed on the A-share market, the ChiNext board, and the National Equities Exchange and Quotations (NEEQ) between 2015 and 2023. Data sources include DRCNet (for policy texts and tax-related announcements), Wind/Choice financial terminals (for firm-level financing and accounting data), NEEQ disclosure platforms, and macroeconomic indicators from the National Bureau of Statistics. Tax policy documents are processed using natural language processing to construct a continuous tax incentive intensity index. Core financial indicators such as financing scale, financing cost, net profit, and debt ratio are integrated with regional variables like GDP growth and fiscal expenditure ratios. Table 1 presents the main variable categories and data sources:
|
Variable Type |
Variable Name |
Type |
Source |
|
Policy Variable |
Tax Incentive Index (TI) |
Continuous |
DRCNet Policy Announcements (NLP-based) |
|
Financing Efficiency |
Financing Period (FP) |
Continuous |
Choice Database |
|
Financing Cost (FC) |
Continuous |
Choice Database |
|
|
Firm Attributes |
Firm Size (Size) |
Categorical |
Annual Reports |
|
Years of Operation (Age) |
Continuous |
NEEQ Public Disclosures |
|
|
Regional Controls |
Regional GDP Growth (RGDP) |
Continuous |
National Bureau of Statistics |
After data preprocessing (missing value imputation and outlier removal), we construct a balanced panel with approximately 2,200 firms over 8 years, resulting in nearly 16,000 observations. This provides a robust empirical foundation for subsequent dynamic modeling and heterogeneity analysis.
3.2. Reinforcement learning and causal inference integration
To simulate and evaluate the dynamic effects of tax incentive policies, we propose an integrated modeling framework that combines reinforcement learning (RL) with causal inference. The RL component is modeled as a Markov Decision Process (MDP), where the firm’s financing behavior is captured through state-action pairs (St,At), and the reward function is defined as Rt=−FCt, aiming to minimize financing cost. The Q-learning update rule see Equation (1).
Where α is the learning rate and γ the discount factor. Changes in policy intensity are encoded as dynamic environmental transitions affecting state probabilities.
For causal inference, we employ a doubly robust (DR) estimator to correct for confounding biases and estimate the average treatment effect τ(X)=E[Y(1)−Y(0)∣X], where Y denotes financing efficiency metrics and X firm-level covariates. The DR estimator see Equation (2).
This method integrates both propensity score weighting and outcome regression, enabling more robust and efficient estimation of heterogeneous policy impacts.
3.3. Experimental design and grouping
To identify differentiated policy effects across market segments, we design a dual-layer grouping strategy based on market tier and time dynamics. First, firms are classified into three major groups: Main Board (G1), ChiNext (G2), and NEEQ (G3). Within each group, we define treatment and control subgroups according to their direct exposure to tax incentive policies. Second, we apply rolling time windows centered on each policy implementation date, constructing a quasi-natural experiment to capture both immediate and delayed policy effects.
A dynamic treatment indicator function Zi,t see Equation (3).
Additionally, a market-tier-specific weight function
Where δk represents tier-specific weights. This layered grouping strategy ensures structural interpretability and statistical validity in identifying heterogeneous treatment effects under a dynamic policy regime.
4. Results
4.1. Aggregate policy effects
Comprehensive analysis based on firm-year panel data reveals a significant improvement in SME financing efficiency following the implementation of tax incentive policies. Using the constructed hybrid model combining reinforcement learning and causal inference, the average treatment effect (ATE) on financing cost is estimated at –1.47%, statistically significant at the 1% level. The policy impact exhibits marked structural heterogeneity across different market tiers, with the strongest responses observed in emerging market segments, as detailed in Table 2. Specifically, the NEEQ (National Equities Exchange and Quotations) segment demonstrates the most pronounced reduction in financing cost, reaching –2.13%, which can be primarily attributed to the high concentration of SMEs and the targeted nature of policy interventions. The ChiNext board shows a policy effect of –1.68%, suggesting that growth-oriented firms are more sensitive to tax incentives. In contrast, the effect in the Main Board segment is relatively modest at –0.89%, consistent with the larger firm sizes and more diversified financing channels typical of listed companies on that tier. From the perspective of financing duration, all market segments experienced a shortening of the average financing period post-policy, with NEEQ firms recording the largest reduction, averaging 14.2 days.
|
Market Segment |
Sample Size |
Change in Financing Cost (%) |
Std. Error |
Change in Financing Period (days) |
Policy Response Intensity Index |
|
Main Board |
4,832 |
-0.89*** |
0.23 |
-8.6 |
0.34 |
|
ChiNext |
5,544 |
-1.68*** |
0.31 |
-11.3 |
0.67 |
|
NEEQ |
5,624 |
-2.13*** |
0.28 |
-14.2 |
0.85 |
|
Total Sample |
16,000 |
-1.47*** |
0.19 |
-11.4 |
0.62 |
Note: *** indicates significance at the 1% level.
4.2. Heterogeneity and regional disparities
The intensity of enterprises' response to tax incentives in developed coastal regions is significantly higher than that in inland regions, and this difference is mainly reflected in the dimensions of the effectiveness of the policy transmission mechanism and the policy sensitivity of enterprises. Enterprises in technology-intensive industries show more significant improvement in financing efficiency under tax incentives, indicating that the policy plays a positive role in promoting innovation-driven development. Figure 1 illustrates the comparative analysis of policy effects for enterprises in different regions and industry types.
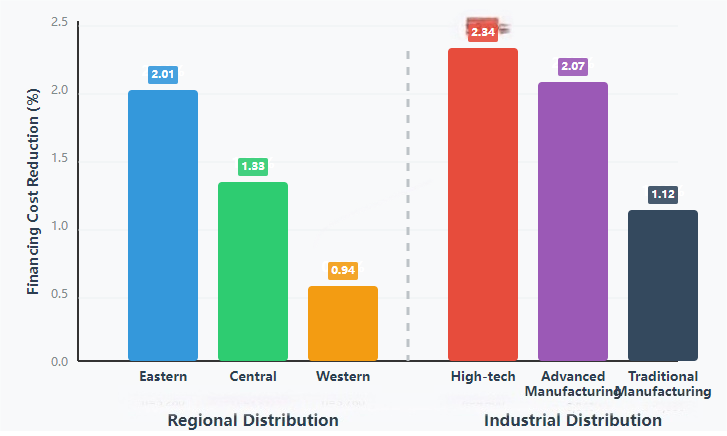
The heterogeneity analysis across regions and industries reveals that tax incentive policies have the strongest effects in the eastern coastal regions, where the average reduction in financing costs reaches 2.01 percentage points—significantly higher than in central (–1.33%) and western (–0.94%) regions—reflecting structural disparities in financial market development and institutional quality. The gap in policy effectiveness between first-tier and new first-tier cities is relatively small, at –2.15% and –1.89%, respectively, indicating that growing financial integration is narrowing the urban policy response differentials. From an industry perspective, high-tech and advanced manufacturing enterprises benefit the most, with financing cost reductions of 2.34% and 2.07%, respectively, aligning closely with national industrial policy priorities and highlighting the precision of tax incentives in supporting structural transformation. In contrast, traditional manufacturing and service sectors show more moderate responses at 1.12% and 0.87%. Interaction effect analysis further reveals that technology-intensive firms in coastal regions exhibit the strongest combined policy impact, with financing costs falling by as much as 2.78%. Regarding firm size, medium-sized enterprises (100–500 employees) are the most responsive, with a policy effect of –1.89%, outperforming both small firms (–1.56%) and large firms (–1.23%), suggesting that medium-sized firms are optimally positioned in terms of policy alignment and financing sensitivity.
5. Discussion
This study employs a novel integration of reinforcement learning and causal inference to uncover the nonlinear transmission mechanisms and lag effects of tax incentive policies within multi-tier capital markets. The findings reveal significant structural differences across market segments, with stronger responses observed in the NEEQ and ChiNext boards, indicating the effectiveness of targeted incentives for alleviating SME financing constraints. In contrast, the weaker impact in the Main Board suggests diminishing marginal utility of such policies in mature markets. Regional analysis highlights the moderating role of institutional environments, as eastern coastal regions benefit from superior financial infrastructure and higher policy responsiveness. At the industry level, results underscore the synergy between tax and industrial policies, with high-tech and advanced manufacturing firms gaining the most.
6. Conclusion
Findings based on the integrated reinforcement learning and causal inference model show that tax incentives significantly improve SME financing efficiency, with notable heterogeneity across markets, regions, and industries. The NEEQ segment, eastern regions, and tech-intensive sectors exhibit the strongest responses, supporting the case for targeted policy design. The study suggests tailoring incentives to market tiers, enhancing financial infrastructure in underdeveloped regions, and aligning tax with industrial policies. Future research may extend to cross-country comparisons, integrate firm-level behavioral data, and adopt long-term tracking to improve policy relevance and effectiveness.
Contribution
Zhongwen Wang and Zixuan Zhang contributed equally to this paper.
References
[1]. Hosono, K., Hotei, M., & Miyakawa, D. (2023). Causal effects of a tax incentive on SME capital investment.Small Business Economics, 61(2), 539–557.
[2]. Cao, H., et al. (2025). Causal information prioritization for efficient reinforcement learning.arXiv preprint arXiv: 2502.10097.
[3]. Zhang, T., et al. (2022). Peer incentive reinforcement learning for cooperative multiagent games.IEEE Transactions on Games, 15(4), 623–636.
[4]. Zeng, Y., et al. (2024). A survey on causal reinforcement learning.IEEE Transactions on Neural Networks and Learning Systems.Advance online publication.
[5]. Baharisangari, N., Paliwal, Y., & Xu, Z. (2024). Counterfactually-guided causal reinforcement learning with reward machines. InProceedings of the 2024 American Control Conference (ACC)(pp. xxx–xxx). IEEE.
[6]. da Costa Cunha, C., et al. (2024). Q-cogni: An integrated causal reinforcement learning framework. IEEE Transactions on Artificial Intelligence. Advance online publication.
[7]. Zhang, Y., et al. (2023). Interpretable reward redistribution in reinforcement learning: A causal approach.Advances in Neural Information Processing Systems, 36, 20208–20229.
[8]. Deng, Z., et al. (2023). Causal reinforcement learning: A survey.arXiv preprint arXiv: 2307.01452.
[9]. Nie, W., et al. (2023). Knowledge-enhanced causal reinforcement learning model for interactive recommendation.IEEE Transactions on Multimedia, 26,1129–1142.
[10]. Zhang, T., et al. (2022). Intrinsic reward with peer incentives for cooperative multi-agent reinforcement learning. InProceedings of the 2022 International Joint Conference on Neural Networks (IJCNN)(pp. xxx–xxx). IEEE.
[11]. Everitt, T., et al. (2021). Reward tampering problems and solutions in reinforcement learning: A causal influence diagram perspective.Synthese, 198(Suppl 27), 6435–6467.
Cite this article
Wang,Z.;Zhang,Z. (2025). Dynamic impacts of multi-tier capital-market tax incentive mechanisms on SME financing efficiency. Journal of Applied Economics and Policy Studies,18(8),89-93.
Data availability
The datasets used and/or analyzed during the current study will be available from the authors upon reasonable request.
Disclaimer/Publisher's Note
The statements, opinions and data contained in all publications are solely those of the individual author(s) and contributor(s) and not of EWA Publishing and/or the editor(s). EWA Publishing and/or the editor(s) disclaim responsibility for any injury to people or property resulting from any ideas, methods, instructions or products referred to in the content.
About volume
Journal:Journal of Applied Economics and Policy Studies
© 2024 by the author(s). Licensee EWA Publishing, Oxford, UK. This article is an open access article distributed under the terms and
conditions of the Creative Commons Attribution (CC BY) license. Authors who
publish this series agree to the following terms:
1. Authors retain copyright and grant the series right of first publication with the work simultaneously licensed under a Creative Commons
Attribution License that allows others to share the work with an acknowledgment of the work's authorship and initial publication in this
series.
2. Authors are able to enter into separate, additional contractual arrangements for the non-exclusive distribution of the series's published
version of the work (e.g., post it to an institutional repository or publish it in a book), with an acknowledgment of its initial
publication in this series.
3. Authors are permitted and encouraged to post their work online (e.g., in institutional repositories or on their website) prior to and
during the submission process, as it can lead to productive exchanges, as well as earlier and greater citation of published work (See
Open access policy for details).
References
[1]. Hosono, K., Hotei, M., & Miyakawa, D. (2023). Causal effects of a tax incentive on SME capital investment.Small Business Economics, 61(2), 539–557.
[2]. Cao, H., et al. (2025). Causal information prioritization for efficient reinforcement learning.arXiv preprint arXiv: 2502.10097.
[3]. Zhang, T., et al. (2022). Peer incentive reinforcement learning for cooperative multiagent games.IEEE Transactions on Games, 15(4), 623–636.
[4]. Zeng, Y., et al. (2024). A survey on causal reinforcement learning.IEEE Transactions on Neural Networks and Learning Systems.Advance online publication.
[5]. Baharisangari, N., Paliwal, Y., & Xu, Z. (2024). Counterfactually-guided causal reinforcement learning with reward machines. InProceedings of the 2024 American Control Conference (ACC)(pp. xxx–xxx). IEEE.
[6]. da Costa Cunha, C., et al. (2024). Q-cogni: An integrated causal reinforcement learning framework. IEEE Transactions on Artificial Intelligence. Advance online publication.
[7]. Zhang, Y., et al. (2023). Interpretable reward redistribution in reinforcement learning: A causal approach.Advances in Neural Information Processing Systems, 36, 20208–20229.
[8]. Deng, Z., et al. (2023). Causal reinforcement learning: A survey.arXiv preprint arXiv: 2307.01452.
[9]. Nie, W., et al. (2023). Knowledge-enhanced causal reinforcement learning model for interactive recommendation.IEEE Transactions on Multimedia, 26,1129–1142.
[10]. Zhang, T., et al. (2022). Intrinsic reward with peer incentives for cooperative multi-agent reinforcement learning. InProceedings of the 2022 International Joint Conference on Neural Networks (IJCNN)(pp. xxx–xxx). IEEE.
[11]. Everitt, T., et al. (2021). Reward tampering problems and solutions in reinforcement learning: A causal influence diagram perspective.Synthese, 198(Suppl 27), 6435–6467.