


1. Introduction
In recent years, the digital economy—an emerging direction in innovative economic development—has become a key strategic choice for seizing opportunities arising from the new round of scientific and technological revolution and industrial transformation. Driven by digital technology and informatization, this new economic form plays a pivotal role in innovating the mode of economic growth, advancing economic structural transformation, and boosting economic growth through comprehensive upgrades in digital production, transactions, and management. As a major coastal economic province in eastern China, Shandong Province achieved a record-high economic output in 2024. According to the Report on the Assessment of Regional Digital Economy Development Level in Shandong Province, the province’s GDP reached 9.86 trillion yuan in 2024, with the digital economy accounting for over 49% of GDP and having emerged as the core engine of economic growth. This trend underscores that the digital economy is profoundly reshaping Shandong’s industrial landscape while injecting new impetus into the transformation and upgrading of its traditional industries.
Simultaneously, Shandong's total import and export volume reached RMB 3.38 trillion in 2024. Three coastal cities—Qingdao, Yantai, and Weifang—serve as pillars of the province's foreign trade, contributing half of this total. Moreover, cross-border e-commerce, a key driver of foreign trade growth, has flourished in recent years; its scale exceeded RMB 200 billion as early as 2022, demonstrating the deep integration and remarkable outcomes of the digital economy and open economy. However, significant regional disparities in development persist across Shandong. The gap between the advanced “smart port” initiatives in coastal areas and the relatively lagging inland regions provides a typical case for examining the impact of regional heterogeneity in the digital economy. Consequently, this study not only aims to assist Shandong in formulating differentiated development strategies but also seeks to offer valuable insights for digital economy development in other regions of China.
2. Literature review
The digital economy, a prominent topic in contemporary academic discourse, has attracted extensive scholarly attention. Emerging in the 1990s amid the advancement of information and communication technology (ICT), it was first formally defined by the American scholar Don Tapscott in his seminal work The Digital Economy: Hope and Danger in the Age of Networked Intelligence as “an economic system that extensively utilizes modern information networks and ICT” (Tapscott, 1996)[1] . A key distinction between this economic system and the traditional economy lies in its treatment of data as a factor of production—one that transcends geographical constraints to drive economic growth (Li, 2019)[2] .
Current academic research on the digital economy primarily focuses on four areas:
The connotation and institutional composition of the digital economy (Li, 2017; Zhang & Jiang, 2021)[3][4]
The construction and measurement of digital economy indicators (Liu et al., 2020; Wang et al., 2021)[5][6]
The role of the digital economy in promoting high-quality economic development (Ren, 2020) [7][8][9]
In studies linking the digital economy to export trade, scholars have reached several key conclusions: Lang and Chu (2022) [11]found that the digital economy exerts a significantly positive effect on exports; Jiang and Jia (2022) [12] focused on service trade, arguing that high-level digitalized services boost the global export of service trade; and Li and Wang (2022) [13] examined micro-enterprises, demonstrating that digital technology development enhances firms’ innovation capabilities, thereby promoting high-quality export trade.
Notably, regional disparities in digital economy development have also been a focus of research. Scholars generally agree that China’s eastern and western regions exhibit marked differences in digital economy development (Han et al., 2021)[14]. The eastern region, with its stronger economic foundation, has achieved a higher overall level of digital economy development (Liu et al., 2020; Feng, 2024)[15][16]. In terms of export trade, Shandong—one of China’s major foreign trade provinces—has long ranked among the top in national trade growth; its export growth rate in 2020 led the country (Liu, 2024)[17].
Existing research on the digital economy and export trade has mostly focused on the national level or the export resilience of micro-enterprises, with a few studies exploring the digital economy in the context of the marine economy (Jian et al., 2021)[18]. However, few studies have adopted a provincial perspective that compares coastal and inland regions. To address this gap, this study uses panel data from 16 prefecture-level cities in Shandong Province (2010–2023) to conduct an in-depth empirical analysis of the digital economy’s impact on export trade. It compares the heterogeneous effects of the digital economy on exports across coastal and inland regions and explores new pathways for coordinated regional development. The findings provide empirical evidence for formulating differentiated digital economy strategies in Shandong and offer insights for promoting coordinated regional development amid digital transformation in other provinces.
3. Digital economy development in shandong province
The Chinese government attaches great importance to digital economy development. General Secretary Xi Jinping has emphasized: “We should accelerate the development of the digital economy, promote digital industrialization, leverage the innovative power of information technology to foster the emergence of new industries and new business models, and drive new economic growth with new drivers.” This underscores China’s commitment to building an internationally competitive digital economy. Aligning with national economic development priorities, Shandong Province has prioritized digital development and accelerated the construction of “Digital Shandong.” To objectively assess Shandong’s digital economy, this study constructs an evaluation index system, measures its development trends, and provides a comprehensive analysis of digital economy development across the province’s cities.
3.1. Evaluation indicators of digital economy development in shandong province
Existing frameworks for evaluating digital economy development primarily include two approaches: the direct method and the comparative approach. This study adopts the comparative approach, which involves constructing a multi-dimensional indicator system to measure and compare the relative level of digital economy development across regions. Drawing on the digital economy evaluation index system developed by Zhou (2023)[19], this study establishes a framework for Shandong Province covering four primary dimensions—digital infrastructure, digital industrialization, industrial digitization, and digital financial inclusion—with 22 secondary indicators. Table 1 presents the specific indicators and their weights.
|
Level 1 Indicators |
Secondary Indicators |
Indicator weight (%) |
|
Digital Infrastructure |
Number of websites owned by enterprises (per hundred) |
0.51 |
|
Number of mobile phone subscribers (million) |
3.77 |
|
|
Number of fixed telephone subscribers (million) |
3.5 |
|
|
Number of Internet broadband access subscribers (10,000) |
3.63 |
|
|
Computer penetration rate (units/100 households) |
2.99 |
|
|
Mobile phone penetration rate (units/100 households) |
0.95 |
|
|
Industrial Digitization |
Total power of agricultural machinery (kW) |
3.66 |
|
Labor productivity (million yuan/person) |
4.30 |
|
|
Per capita consumption expenditure on transport and communications (yuan/person) |
2.71 |
|
|
Volume of express delivery business (10,000 pieces) |
5.28 |
|
|
Number of computers used by enterprises (units) |
6.33 |
|
|
Share of enterprises with e-commerce trading activities (%) |
4.02 |
|
|
E-commerce sales (million yuan) |
7.56 |
|
|
Digital Industrialization |
Total telecoms business (yuan) |
4.71 |
|
Software business revenue (billion yuan) |
10.89 |
|
|
Number of enterprises in the computer, communications and other electronic equipment manufacturing industry (number) |
5.79 |
|
|
Employment in information transmission, software and information technology services (10,000) |
11.22 |
|
|
Number of enterprises in the information transmission, software and information technology services industry (number) |
7.34 |
|
|
Revenue from information technology services (ten thousand yuan) |
6.07 |
|
|
Digital Financial Inclusion |
Breadth of digital financial coverage |
1.91 |
|
Depth of use of digital finance |
1.56 |
|
|
Degree of digitalization of inclusive finance |
1.31 |
3.2. Measurement of digital economy development level in shandong province
For the measurement method, this study draws on Wang et al. (2021)[7] and employs the entropy weight method to assign weights to the digital economy evaluation indicators. This method determines indicator weights by calculating their information entropy, thereby enhancing the objectivity of the comprehensive evaluation of digital economy development across Shandong’s 16 prefecture-level cities. Table 2 presents the measured digital economy development levels from 2010 to 2023.
|
2010 |
2011 |
2012 |
2013 |
2014 |
2015 |
2016 |
2017 |
2018 |
2019 |
2020 |
2021 |
2022 |
2023 |
|
|
Jinan |
0.11434 |
0.11192 |
0.12926 |
0.08275 |
0.28584 |
0.24527 |
0.45337 |
0.27595 |
0.25939 |
0.33791 |
0.45762 |
0.62799 |
0.52180 |
0.39022 |
|
Qingdao |
0.06363 |
0.09022 |
0.15091 |
0.20175 |
0.12496 |
0.21420 |
0.40283 |
0.32845 |
0.28752 |
0.26769 |
0.42735 |
0.47416 |
0.47206 |
0.38593 |
|
Yantai |
0.01373 |
0.05304 |
0.02683 |
0.01609 |
0.22512 |
0.36138 |
0.57982 |
0.40147 |
0.47456 |
0.36932 |
0.42883 |
0.26493 |
0.23958 |
0.28120 |
|
Weihai |
0.04029 |
0.04383 |
0.06931 |
0.10345 |
0.23753 |
0.30680 |
0.40627 |
0.37169 |
0.45700 |
0.36916 |
0.36693 |
0.29318 |
0.33889 |
0.28221 |
|
Weifang |
0.10084 |
0.02602 |
0.02469 |
0.17766 |
0.08042 |
0.29467 |
0.48062 |
0.38542 |
0.41438 |
0.20530 |
0.29206 |
0.17662 |
0.26566 |
0.33058 |
|
Zaozhuang |
0.00000 |
0.03113 |
0.03382 |
0.07366 |
0.17091 |
0.25033 |
0.34806 |
0.25399 |
0.59055 |
0.31980 |
0.43265 |
0.17760 |
0.14278 |
0.14290 |
|
Linyi |
0.04120 |
0.04322 |
0.02603 |
0.03904 |
0.22276 |
0.19554 |
0.36948 |
0.20171 |
0.35978 |
0.21527 |
0.26141 |
0.39735 |
0.23610 |
0.21623 |
|
Taian |
0.01537 |
0.04441 |
0.02991 |
0.04799 |
0.07053 |
0.13919 |
0.56433 |
0.16267 |
0.22192 |
0.17935 |
0.35931 |
0.26731 |
0.32672 |
0.35324 |
|
Heze |
0.03427 |
0.01583 |
0.01740 |
0.06117 |
0.06321 |
0.10907 |
0.48054 |
0.36865 |
0.41607 |
0.16234 |
0.24681 |
0.31040 |
0.30163 |
0.18278 |
|
Zibo |
0.01586 |
0.01534 |
0.02752 |
0.04256 |
0.05974 |
0.01683 |
0.26416 |
0.14286 |
0.25419 |
0.20914 |
0.34617 |
0.35220 |
0.31271 |
0.28917 |
|
Binzhou |
0.01986 |
0.05599 |
0.08675 |
0.09443 |
0.02208 |
0.11943 |
0.14671 |
0.22763 |
0.24412 |
0.18321 |
0.29015 |
0.32480 |
0.21755 |
0.24399 |
|
Jijing |
0.04188 |
0.07395 |
0.01453 |
0.09178 |
0.17328 |
0.22235 |
0.21155 |
0.22588 |
0.21732 |
0.16677 |
0.18364 |
0.17582 |
0.26236 |
0.19310 |
|
Liaocheng |
0.04175 |
0.03787 |
0.01336 |
0.05592 |
0.04711 |
0.24233 |
0.20431 |
0.17432 |
0.29970 |
0.15007 |
0.23844 |
0.19766 |
0.20058 |
0.18572 |
|
Rizhao |
0.03751 |
0.06953 |
0.05278 |
0.03922 |
0.07883 |
0.16307 |
0.06236 |
0.14544 |
0.12285 |
0.14639 |
0.15646 |
0.25738 |
0.33102 |
0.31299 |
|
Dongying |
0.02845 |
0.04132 |
0.02657 |
0.08475 |
0.09131 |
0.07524 |
0.08256 |
0.12285 |
0.21682 |
0.13603 |
0.17819 |
0.26823 |
0.23263 |
0.18791 |
|
Dezhou |
0.02542 |
0.01468 |
0.03332 |
0.00000 |
0.01740 |
0.06395 |
0.17963 |
0.09515 |
0.09016 |
0.15342 |
0.26697 |
0.16905 |
0.23128 |
0.24288 |
Data Source: Calculated according to the Statistical Yearbook of Shandong Province and the official website of Shandong Statistics Bureau
3.3. Key findings on digital economy development
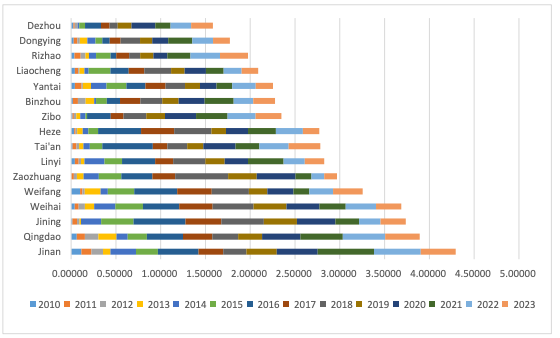
The digital economy development level in Shandong Province exhibited an overall upward trend from 2010 to 2023 (see Figure 1). However, horizontal comparisons reveal significant regional disparities:
Top-performing cities: Jinan, Qingdao, Weihai, Weifang, and Yantai rank among the top five in digital economy development. Notably, Jinan has maintained the highest digital economy level in the province since 2019, serving as a model and driver for regional growth.
Lagging cities: Cities with lower digital economy levels—such as Liaocheng, Rizhao, and Zaozhuang—generally exhibit weaker overall economic development.
These disparities indicate that digital economy development in Shandong remains uneven. The progress of the digital economy in each prefecture-level city is closely tied to its local economic conditions: cities with stronger economic foundations, superior infrastructure, convenient transportation, abundant human resources, and more active trade tend to achieve higher digital economy development levels.
4. Regional heterogeneity of digital economy development in shandong
The digital economy in Shandong Province exhibits a clear “coastal leadership, inland catch-up” gradient pattern. According to 2024 statistics from the Shandong Provincial Big Data Bureau, the added value of core digital economy industries in Qingdao, Yantai, and Weihai has accounted for nearly 30% of the provincial total. This regional differentiation is manifested in three key dimensions:
4.1. Digital infrastructure: coastal advantages in coverage and quality
Coastal regions hold a distinct edge in digital infrastructure. As of June 2024, five coastal cities—Qingdao, Yantai, Weihai, Weifang, and Rizhao—had built a total of 90,000 5G base stations, far exceeding the number in western inland cities such as Heze, Liaocheng, and Dezhou. Coastal cities have also achieved full 5G network coverage in key industrial parks; for example, Qingdao alone has built 42,700 5G base stations. In contrast, inland regions lag significantly in 5G infrastructure deployment.
4.2. Industrial digitization: coastal leadership in transformation models
There are significant gaps in the level of industrial digital transformation. Qingdao has pioneered the “Qingdao Model” of digital transformation, which empowers industrial upgrading through platformization, drives enterprise innovation through data utilization, facilitates scenario-based applications, and deepens industrial digitization. To date, Qingdao has established 68 smart factories in key industries and secured six global “Lighthouse Factory” designations (and one sustainable “Lighthouse Factory” designation)—more than any other city at the same level in China. In contrast, inland enterprises face multiple constraints (e.g., capital shortages and technological gaps) that hinder their digital transformation.
4.3. Development models: divergent paths for coastal and inland regions
Coastal and inland regions have developed distinct digital economy models:
Coastal regions: Guided by General Secretary Xi Jinping’s instruction to “accelerate the construction of world-class marine ports,” Shandong’s coastal ports have achieved historic breakthroughs. The integration reform of the Shandong Port Group in 2019 transformed the province’s ports from “a scattered group” to “a coordinated cluster,” providing strong support for regional economic development and global supply chain stability. This integration has become a model for the synergy between the digital economy and the real economy.
Inland regions: Inland cities are exploring differentiated paths. For example, Linyi has adopted the “Market Purchase Trade + Digital Logistics” model; Jinan, leveraging its advantages as the provincial capital, focuses on fostering big data and next-generation information technology industries, with over 5,000 digital economy enterprises now located in its high-tech zone.
4.4. Drivers of regional heterogeneity
The formation of these regional disparities is influenced by both objective factors (e.g., geographical location and industrial foundation) and subjective factors (e.g., policy resource allocation and talent mobility). An in-depth analysis of how coastal and inland digital economy development impacts export trade is critical for formulating differentiated regional strategies and enhancing the province’s overall export competitiveness.
5. Export trade situation in shandong province
As a major foreign trade province in China, Shandong exhibits four key characteristics in its export trade: large scale, diversified trade methods, optimized commodity structure, and a distinctive regional market layout.
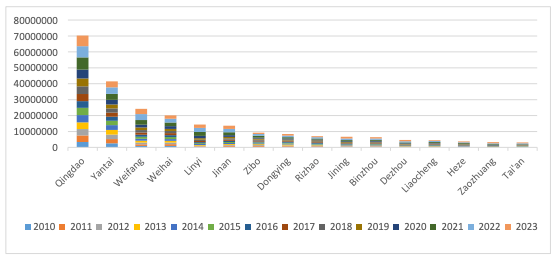
5.1. Total export trade: steady expansion
Shandong’s export scale has continued to grow, driven by its abundant resources, labor advantages, and favorable transportation/port conditions. It has long ranked among the top provinces in China in terms of export volume. According to statistics, Shandong’s total exports have increased year by year, solidifying its position as a key national export base (see Figure 2). Amid global economic integration, Shandong’s export scale is expected to maintain steady growth. Table 3 presents the total export volume of Shandong’s prefecture-level cities from 2010 to 2023.
5.2. Export trade modes: diversification with general trade dominance
Shandong’s export trade modes have become increasingly diversified. Traditionally, its exports primarily rely on two modes: general trade and processing trade. As shown in Table 4, the share of general trade has gradually increased, reaching 73.29% in 2020, while the share of processing trade has declined to less than 20% (17.70%) by 2021. This shift reflects the competitive advantages of general trade: for example, local brands such as Haier and Gree have leveraged industrial internet platforms to increase the share of high-value-added products; digital infrastructure (e.g., customs clearance “single window” and smart industrial internet) has reduced customs clearance and logistics costs for general trade.
|
City |
2010 |
2011 |
2012 |
2013 |
2014 |
2015 |
2016 |
2017 |
2018 |
2019 |
2020 |
2021 |
2022 |
2023 |
|
Qingdao |
338.90 |
405.81 |
407.91 |
419.60 |
457.77 |
453.27 |
424.65 |
445.93 |
479.55 |
494.33 |
560.89 |
761.36 |
707.22 |
670.42 |
|
Yantai |
254.80 |
266.95 |
283.59 |
294.75 |
294.04 |
280.45 |
248.46 |
256.63 |
267.52 |
251.06 |
284.23 |
378.86 |
412.36 |
377.39 |
|
Weifang |
86.96 |
103.64 |
109.68 |
116.04 |
123.29 |
129.84 |
123.49 |
139.61 |
157.02 |
163.71 |
175.73 |
288.27 |
372.32 |
327.43 |
|
Weihai |
89.17 |
107.42 |
106.59 |
107.02 |
113.72 |
126.21 |
116.71 |
125.88 |
138.22 |
133.63 |
168.64 |
231.27 |
234.70 |
213.91 |
|
Linyi |
28.26 |
36.22 |
38.97 |
46.35 |
56.94 |
60.57 |
59.23 |
72.75 |
80.62 |
98.30 |
144.03 |
244.53 |
252.82 |
217.46 |
|
Jinan |
40.51 |
60.47 |
57.14 |
54.81 |
60.61 |
59.96 |
73.44 |
75.06 |
85.52 |
93.48 |
108.96 |
181.89 |
211.30 |
195.15 |
|
Zibo |
40.31 |
53.24 |
53.19 |
52.50 |
55.98 |
57.87 |
52.37 |
54.92 |
63.25 |
60.57 |
71.04 |
112.17 |
109.39 |
88.88 |
|
Dongying |
27.58 |
43.59 |
49.82 |
58.03 |
60.95 |
49.68 |
45.59 |
49.29 |
55.84 |
49.73 |
66.32 |
85.91 |
101.53 |
93.53 |
|
Rizhao |
22.11 |
39.06 |
38.76 |
38.79 |
47.89 |
41.34 |
42.23 |
51.50 |
61.55 |
59.03 |
49.65 |
62.28 |
81.50 |
72.08 |
|
Jining |
22.99 |
30.70 |
31.96 |
33.34 |
32.69 |
34.35 |
33.66 |
34.87 |
33.10 |
41.09 |
56.13 |
75.21 |
92.85 |
111.85 |
|
Binzhou |
25.50 |
28.45 |
28.29 |
35.43 |
37.82 |
36.32 |
37.62 |
39.84 |
46.15 |
45.21 |
47.37 |
71.56 |
76.02 |
85.49 |
|
Dezhou |
13.36 |
17.46 |
18.68 |
20.26 |
22.27 |
22.07 |
22.43 |
26.50 |
28.49 |
29.51 |
35.84 |
51.67 |
72.34 |
81.75 |
|
Liaocheng |
12.89 |
18.75 |
18.49 |
20.03 |
23.86 |
25.37 |
29.25 |
34.51 |
36.95 |
30.01 |
32.88 |
56.73 |
60.89 |
51.16 |
|
Heze |
12.11 |
14.41 |
15.28 |
17.50 |
21.58 |
21.97 |
24.35 |
23.09 |
22.98 |
25.49 |
31.03 |
43.64 |
46.48 |
51.17 |
|
Zaozhuang |
7.46 |
8.44 |
9.39 |
9.47 |
11.54 |
14.03 |
12.18 |
13.02 |
14.92 |
20.09 |
36.43 |
43.17 |
59.34 |
68.17 |
|
Taian |
9.26 |
11.85 |
12.22 |
13.67 |
17.31 |
17.49 |
16.16 |
17.30 |
18.83 |
19.18 |
21.19 |
29.91 |
52.31 |
55.80 |
Data Source: Calculated based on the Statistical Yearbook of Shandong Province (2010–2023).
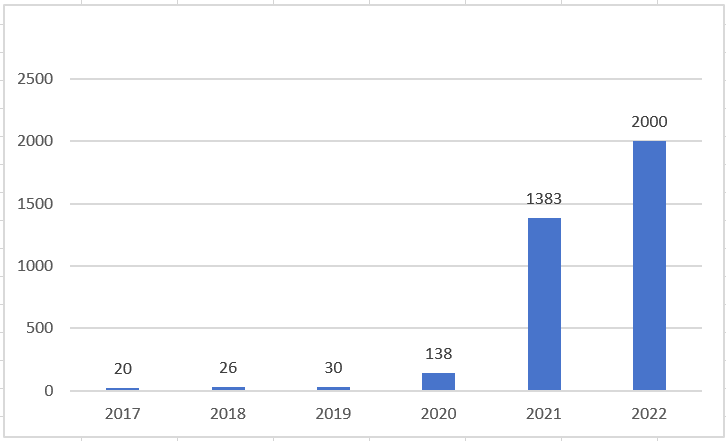
While traditional trade remains dominant, new trade modes—such as cross-border e-commerce—have grown rapidly with the digital economy. These new modes provide additional sales channels and market opportunities for Shandong’s export enterprises, further diversifying its export structure. Figure 3 shows the growth trend of cross-border e-commerce import and export value in Shandong from 2017 to 2022, indicating strong future prospects for cross-border e-commerce.
5.3. Export commodity structure: optimization toward high-value-added products
Shandong’s export commodity structure has gradually optimized. Its exports cover machinery and equipment, chemical products, textiles, and foodstuffs. Table 5 shows the export value of major commodity categories from 2010 to 2023. Notably, the export volume of mechanical and electrical products increased by 34.1% in 2020 and 44.8% in 2021, respectively. This trend indicates that with continuous technological progress and industrial upgrading, Shandong’s exports are shifting toward high-value-added, high-tech products—enhancing overall export competitiveness.
|
Year |
General trade |
Share of export value (%) |
Processing Trade |
Share of export value (%) |
|
|
2010 |
497.3 |
48.03 % |
498.1 |
48.11 % |
|
|
2011 |
646.7 |
51.88 % |
558.1 |
44.77 % |
|
|
2012 |
687.5 |
53.71% |
543.4 |
42.45 % |
|
|
2013 |
760.4 |
56.85 % |
525.9 |
39.32% |
|
|
2014 |
837.4 |
58.22 % |
553.7 |
38.50 % |
|
|
2015 |
904.2 |
63.20 % |
492.4 |
34.42 % |
|
|
2016 |
865.4 |
63.55 % |
462.1 |
33.93% |
|
|
2017 |
942.9 |
64.55% |
480.4 |
32.89 % |
|
|
2018 |
1104.8 |
69.46 % |
452 |
28.42% |
|
|
2019 |
1125.7 |
69.73 % |
410.1 |
25.40 % |
|
|
2020 |
1385.4 |
73.29 % |
396.4 |
20.97 % |
|
|
2021 |
1956.7 |
71.98 % |
481.1 |
17.70% |
|
|
2022 |
2073 |
70.43% |
558.7 |
18.98% |
|
|
2023 |
2000.3 |
72.43 % |
532 |
19.26 % |
|
In terms of product quality, as international markets impose stricter requirements on quality and safety, Shandong’s export enterprises have strengthened quality control and technological innovation. Many Shandong-made products have gained a good reputation in international markets, winning greater market share for the province’s exports.
|
2010 |
2011 |
2012 |
2013 |
2014 |
2015 |
2016 |
2017 |
2018 |
2019 |
2020 |
2021 |
2022 |
2023 |
|
|
Textile and clothing |
173.3 |
203.8 |
197.5 |
216 |
221.6 |
2125 |
206.5 |
213.2 |
230.4 |
219.7 |
264.3 |
318.0 |
308.4 |
290.6 |
|
Agricultural products |
127.0 |
153.7 |
150.2 |
152 |
157.3 |
153.1 |
162.9 |
170.1 |
1742 |
178.9 |
181.7 |
191.7 |
208.3 |
209.8 |
|
Electromechanical products |
450.7 |
508.4 |
503.3 |
508.8 |
561.6 |
576.3 |
524.9 |
572.4 |
602.6 |
603.6 |
809.5 |
1172.2 |
1248.9 |
1270.5 |
|
High-tech products |
175.8 |
152 |
143.2 |
172.6 |
205.9 |
177.1 |
147.8 |
146.2 |
153.6 |
133.3 |
153.6 |
202.4 |
199.5 |
202.7 |
|
General trade |
497.3 |
646.7 |
687.5 |
760.4 |
837.4 |
904.2 |
865.4 |
942.9 |
1104.8 |
1125.7 |
1385.4 |
1956.7 |
2073.0 |
2000.3 |
|
Processing trade |
498.1 |
558.1 |
543.4 |
525.9 |
553.7 |
492.4 |
462.1 |
480.4 |
452 |
410.1 |
396.4 |
481.1 |
558.7 |
532 |
5.4. Export regional market structure: growing focus on ASEAN
In 2024, ASEAN became Shandong’s largest export market, with an export value of 351.59 billion yuan accounting for 30% of the province’s total exports to major markets (see Figure 4). The EU (22%), the United States (20%), and South Korea (16%) followed, with Japan accounting for 12%.
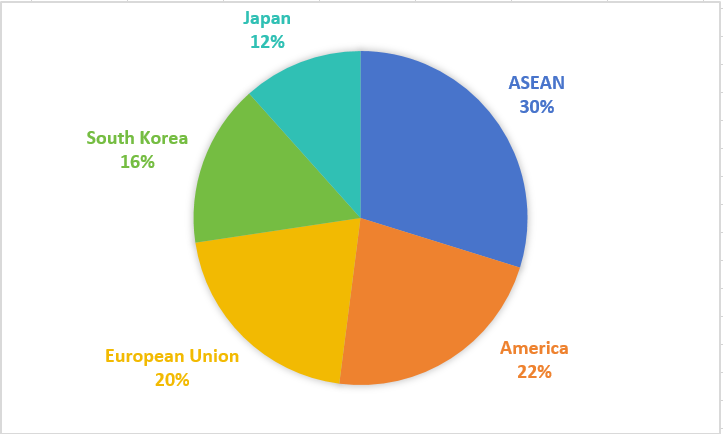
Data Source: Statistical Bulletin of National Economic and Social Development of Shandong Province
Notably, Shandong’s export share to ASEAN has increased year by year. As shown in Figure 5, the United States was Shandong’s top export market in 2020; however, starting in 2021, Shandong gradually increased its export share to ASEAN, reflecting the province’s success in diversifying its export markets and leveraging opportunities from regional economic cooperation (e.g., the Regional Comprehensive Economic Partnership, RCEP).
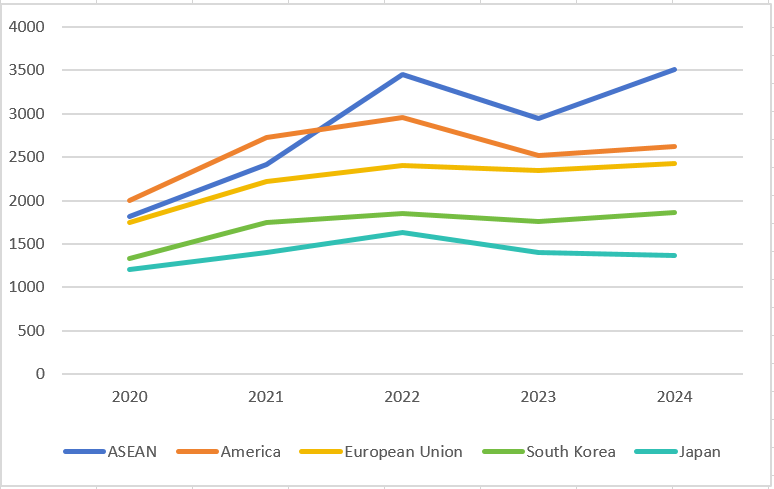
Source: Shandong Province National Economic and Social Development Statistics Bulletin
6. Empirical analysis
6.1. Variable selection
This study uses panel data from 16 prefecture-level cities in Shandong Province (2010–2023). Data sources include the Statistical Yearbook of Shandong Province, China Statistical Yearbook, and China Economic Database. Missing data points were either imputed or excluded.
6.1.1. Explained variable
Total export trade (lnEX): Measured by the natural logarithm of the total export value of each prefecture-level city. This transformation mitigates the impact of heteroscedasticity and aligns with the logarithmic form commonly used in trade empirical studies.
6.1.2. Core explanatory variable
Digital economy development level (DE): Constructed using the four dimensions outlined in Section 3.1 (digital infrastructure, digital industrialization, industrial digitization, digital financial inclusion). The entropy weight method was used to calculate the comprehensive index, ensuring objectivity and scientific rigor.
6.1.3. Control variables
To isolate the net impact of the digital economy on exports, four control variables were introduced:
Degree of openness (OPEN): Measured by the ratio of total import and export volume to GDP of each city, reflecting the level of integration with the global economy.
Foreign direct investment (lnFDI): Measured by the natural logarithm of actual utilized FDI. FDI can promote exports by introducing advanced technology and optimizing the industrial structure.
Financial development level (FD): Measured by the ratio of financial institution loans to GDP. Li et al. (2021)[20] demonstrated that financial openness enhances the domestic value-added rate of enterprise exports, so this variable controls for financial market effects.
Fiscal investment strength (FIS): Measured by the ratio of fiscal expenditure to GDP. This controls for the impact of government intervention, as Shandong’s “targeted fiscal support” for digital infrastructure may indirectly promote exports (Zhang & Gong, 2005)[21].
6.2. Model construction
To examine the impact of the digital economy on export trade in Shandong, this study constructs a two-way fixed-effects panel data model (controlling for regional and time fixed effects) as follows:
6.3. Empirical tests
6.3.1. Descriptive statistics
Table 6 presents the descriptive statistics of the variables. The explanatory variable lnEX has a mean of 13.334, a standard deviation of 1.026, a maximum of 15.845, and a minimum of 11.219—indicating significant variation in export scale across Shandong’s cities. The core explanatory variable DE has a mean of 0.199, a standard deviation of 0.140, a maximum of 0.628, and a minimum of 0.0001—reflecting large disparities in digital economy development. Control variables also exhibit significant variation, consistent with regional differences in openness, FDI inflows, and financial development.
6.3.2. Multicollinearity test
To avoid multicollinearity among variables, this study conducts a variance inflation factor (VIF) test. As shown in Table 7, the VIF values of all variables range from 1.146 to 2.701, with a mean VIF of 1.8—far below the critical threshold of 5. This indicates no severe multicollinearity, ensuring the reliability of the regression results.
|
Variables |
Sample Size |
Mean |
Standard Deviation |
Minimum |
Maximum |
|
|
lnEX |
224 |
13.334 |
1.026 |
11.219 |
15.845 |
|
|
DE |
224 |
.199 |
.14 |
.14 |
.628 |
|
|
OPEN |
.224 |
.275 |
.222 |
.04 |
1.364 |
|
|
lnFDI |
6.609 |
6.609 |
1.757 |
0 |
12.835 |
|
|
FD |
224 |
2.165 |
.737 |
1.129 |
4.338 |
|
|
FIS |
224 |
9.004 |
4.2 |
1.983 |
24.77 |
|
6.3.3. Model selection (f-test and hausman test)
F-Test: Compares the individual fixed-effects model and the pooled OLS model. The F-statistic is 113.24 (p < 0.001), rejecting the null hypothesis of “no individual effects” and supporting the use of the individual fixed-effects model.
Hausman Test: Compares the fixed-effects model and the random-effects model. The chi-square statistic is 28.89 (p < 0.001), rejecting the null hypothesis of “random effects” and confirming the appropriateness of the two-way fixed-effects model (controlling for both regional and time fixed effects).
|
Variable |
VIF |
1/VIF |
|
DE |
1.41 |
.709 |
|
FD |
2.701 |
.37 |
|
lnFDI |
1.835 |
.545 |
|
FIS |
1.671 |
.598 |
|
OPEN |
1.146 |
.872 |
|
Mean VIF |
1.8 |
. |
6.3.4. Benchmark regression analysis
Table 9 presents the benchmark regression results using the two-way fixed-effects model. The core findings are as follows:
The digital economy (DE) exerts a significantly positive impact on export trade (lnEX). In Model (1) (controlling only for regional and time fixed effects), the coefficient of DE is 1.808 (p < 0.01), indicating that a 1-unit increase in the digital economy level drives a 180.8% increase in exports. After sequentially adding control variables (Models 2–5), the coefficient of DE remains positive and significant at the 10% level (p < 0.072) in Model (5), with a coefficient of 0.414. This suggests that a 1-unit increase in the digital economy level promotes exports by 43.1%—confirming the robust positive effect of the digital economy on exports.
Control variables also exhibit expected signs:
OPEN: The coefficient is positive and significant at the 5% level, reflecting Shandong’s “opening-up-driven transformation” strategy—greater openness reduces trade costs and boosts exports.
lnFDI: The coefficient is positive (though weakly significant), indicating that FDI inflows contribute to export growth by transferring technology and expanding market access.
FD: The coefficient is positive and significant at the 1% level, highlighting the critical role of financial development in supporting export activities (e.g., providing trade financing).
FIS: The coefficient is positive and significant at the 5% level, suggesting that targeted fiscal investment in digital infrastructure reduces enterprise transformation costs and indirectly promotes exports.
|
Model Selection |
Test Method |
Test Value |
P-value |
Test Conclusion |
|
Individual effect model and mixed effect model |
F-test |
F=113.24 |
P=0.000 |
Individual effect model |
|
Random effects model and fixed effects model |
Hausman test |
Chi2=28.89 |
P=0.000 |
Fixed effects model |
6.3.5. Control variables
The regression coefficients for the control variables—degree of openness to the outside world, foreign direct investment (FDI) level, financial development level, and financial investment intensity—are all positive and statistically significant. The degree of openness in each prefecture-level city in Shandong Province is significant at the 5% level, reflecting the strategic emphasis of Shandong’s “opening-up to promote transformation” policy, which reduces trade costs and facilitates firm exports. The coefficients for FDI and financial investment intensity are also positive, though their significance is relatively weaker, indicating a modest positive impact on export trade. The effect of financial development is the most significant, underscoring the supportive role of financial center construction in Shandong for exports.
6.3.6. Robustness tests
To ensure the robustness of the model, this study employs two approaches: sample adjustment and replacement of the core explanatory variable. First, considering that various levels of Chinese government implemented large-scale temporary fiscal stimulus measures (e.g., special treasury bonds, tax cuts, and fee reductions) in 2020 to address the pandemic, these policies may have altered fiscal expenditure structures (FIS) and financial resource allocation (FD), potentially interfering with the estimation of the core explanatory variable (DE). To mitigate bias from such exogenous policy shocks, the 2020 sample is excluded. Additionally, Qingdao—a separately listed city with provincial-level economic management authority—has a distinct fiscal system and foreign investment policies (e.g., bonded zone policies, international port status) compared to other cities in the sample. To avoid estimation bias due to these structural differences, Qingdao is also excluded from the robustness test, enhancing the generalizability of the findings.
Second, the core explanatory variable is replaced. Mobile Internet Penetration (MIP) reflects the coverage of digital infrastructure and captures a core dimension of digital transformation, making it a theoretically valid alternative. Thus, MIP is used to replace DE in measuring the digital economy development level in each prefecture-level city in Shandong Province. The regression results are presented in Table 10.
|
Variable Name |
(1) |
(2) |
(3) |
(4) |
(5) |
|
lnEX |
lnEX |
lnEX |
lnEX |
lnEX |
|
|
DE |
1.808*** |
1.790*** |
1.410*** |
0.487* |
0.414* |
|
(0.272) |
(0.280) |
(0.221) |
(0.237) |
(0.229) |
|
|
OPEN |
1.152 |
0.748 |
0.407* |
0.413** |
|
|
(0.882) |
(0.626) |
(0.220) |
(0.181) |
||
|
lnFDI |
0.144*** |
0.0471*** |
0.0255 |
||
|
(0.0224) |
(0.0122) |
(0.0147) |
|||
|
FD |
0.550*** |
0.369*** |
|||
|
(0.0891) |
(0.0834) |
||||
|
FIS |
0.0382** |
||||
|
(0.0134) |
|||||
|
Constant |
12.97*** |
12.66*** |
11.89*** |
11.62*** |
11.83*** |
|
(0.0541) |
(0.221) |
(0.212) |
(0.197) |
(0.163) |
|
|
N |
224 |
224 |
224 |
224 |
224 |
|
R2 |
0.278 |
0.359 |
0.560 |
0.750 |
0.775 |
|
Area fixed effects |
YES |
YES |
YES |
YES |
YES |
|
Time fixed effects |
YES |
YES |
YES |
YES |
YES |
Note: *** , ** , * indicate the significance of 1%, 5%, 10% respectively, and the t-value in parentheses, the same as the table below.
As shown in columns (1) and (2), after excluding Qingdao and the 2020 sample, the significance level of DE improves from 10% to 1%, and the regression coefficients remain stable. This confirms that Qingdao’s unique economic status and the short-term impact of the pandemic led to an underestimation of DE’s statistical significance in the benchmark regression. After removing these disturbances, the export-promoting effect of DE remains robust under stricter tests, with enhanced statistical reliability.
Column (3) presents the results after replacing the core explanatory variable. The estimated coefficient of MIP is 1.004 and significant at the 1% level, consistent in direction and significance with DE, indicating that digital technology penetration is a robust driver of export trade.
|
Variable Name |
Excluding Qingdao |
Exclude 2020 |
Replacement of core explanatory variables |
|
DE |
0.402*** |
0.398*** |
|
|
(3.027) |
(3.068) |
||
|
OPEN |
0.366*** |
0.328** |
1.406*** |
|
(2.715) |
(2.471) |
(0.396) |
|
|
lnFDI |
0.023* |
0.013 |
0.206 *** |
|
(1.711) |
(1.019) |
(0.035) |
|
|
FD |
0.383*** |
0.480*** |
0.126* |
|
(7.065) |
(8.390) |
(0.074) |
|
|
FIS |
0.051*** |
0.041*** |
0.006 |
|
(6.425) |
(5.284) |
(0.012) |
|
|
MIP |
1.004 *** |
||
|
(0.195) |
|||
|
_cons |
11.893*** |
11.992*** |
10.166*** |
|
(137.033) |
(132.942) |
(0.189) |
|
|
N |
210 |
208 |
224 |
|
R2 |
0.812 |
0.818 |
0.655 |
6.3.7. Heterogeneity analysis
Given the actual development of coastal cities in Shandong—such as the Qingdao Free Trade Zone and the Yantai Cross-Border E-Commerce Pilot Zone—which benefit from comprehensive national open platforms, regional disparities are evident. Krugman’s (1991) “core-periphery” model suggests that economic agglomeration naturally occurs in port cities due to advantages in shipping costs, while inland areas face market access barriers. The coastal belt of Qingdao-Yantai-Weihai represents a typical core area in Shandong. To examine regional heterogeneity, this study divides the 16 prefecture-level cities into coastal and inland groups. The regression results are shown in Table 10.
The heterogeneity analysis reveals significant regional differences in the impact of the digital economy (DE) on export trade (lnEX). The promoting effect of DE is substantially stronger in coastal areas, with a coefficient of 1.903 (p < 0.01), compared to 0.679 (p < 0.05) in inland areas. This suggests that digital technology applications in inland regions are still at an early stage, constrained by limited digital infrastructure.
The strong effect in coastal cities may be attributed to the deep integration of the digital economy with global trade—through cross-border e-commerce and digital services—which significantly boosts exports. Supported by policies such as the “Shandong Province Cross-Border E-Commerce Leapfrog Development Action Plan (2023–2025)”, ports in Qingdao, Yantai, and Weihai have accelerated the layout of shipping routes to serve cross-border e-commerce. Cities like Qingdao, Yantai, Weihai, and Weifang have achieved considerable success in coupling cross-border e-commerce with industrial zones.
|
Variable name |
(1) |
(2) |
|
Coastal cities |
Inland Cities |
|
|
DE |
1.903*** |
0.679*** |
|
(0.610) |
(0.234) |
|
|
OPEN |
0.095 |
6.698*** |
|
(0.339) |
(0.533) |
|
|
lnFDI |
0.360*** |
0.099*** |
|
(0.065) |
(0.026) |
|
|
FD |
-0.021 |
0.306*** |
|
(0.163) |
(0.047) |
|
|
FIS |
-0.032 |
-0.011 |
|
(0.025) |
(0.009) |
|
|
_cons |
11.374*** |
10.621*** |
|
(0.420) |
(0.117) |
|
|
N |
98 |
126 |
|
R2 |
0.532 |
0.823 |
In contrast, the weaker effect in inland cities may be due to a current focus on localized applications rather than global trade integration, resulting in a modest marginal contribution to exports. Inadequate infrastructure—such as underdeveloped cross-border e-commerce logistics and digital trade platforms—further raises barriers to international market entry. Although open economic policies exhibit a significant stimulative effect in inland regions, geographical disadvantages—such as inefficient international logistics and limited capacity for overseas market expansion—remain major constraints.
7. Conclusion and policy recommendations
7.1. Conclusion
Based on empirical analysis of panel data from prefecture-level cities in Shandong Province, the development level of the digital economy has shown a continuous upward trend from 2010 to 2023, with significant regional variations influenced by economic scale and policy emphasis. Cities such as Jinan, Qingdao, and Yantai lead in digital economy development, while Rizhao, Dongying, and Dezhou lag. Coastal cities—including Qingdao, Yantai, and Weifang—demonstrate higher export volumes, benefiting from agglomeration economies and advantages in shipping costs, as predicted by core-periphery models.
Benchmark regression analysis confirms a statistically positive impact of digital economy development on export trade in Shandong, which remains robust after controlling for trade openness, FDI, financial development, and fiscal investment intensity. The positive association persists under rigorous robustness checks, including sample restriction and alternative core explanatory variables.
From a regional perspective, coastal cities such as Qingdao and Weihai have leveraged geographic advantages to develop distinctive digital-economic models (e.g., Qingdao’s “Smart Port” and Weihai’s “Digital Ocean”), enabling deeper integration of digital technologies with the real economy and generating more pronounced export benefits. In contrast, inland regions face constraints such as insufficient digital infrastructure and lagging cross-border logistics capabilities, limiting though not negating the positive effects of digital economic development on exports. These patterns highlight the need for regionally coordinated policies to address developmental imbalances.
In summary, this study provides empirical evidence that the digital economy is a key driver of export trade upgrading in Shandong Province, with effects shaped significantly by regional geographic and infrastructural contexts.
7.2. Policy recommendations
To enhance the integrated development of the digital economy and export trade, the government should implement measures to strengthen digital infrastructure, promote technological innovation and digital transformation, support cross-border e-commerce and digital trade, cultivate and attract talent, and provide financial support. These steps will improve Shandong’s international market competitiveness and foster sustained economic growth.
Construct a Differentiated Digital Infrastructure System: Increase investment in digital infrastructure, such as data centers and IoT nodes. In less-developed areas (e.g., Don1gying, Dezhou), expand basic digital facilities and develop digital dry ports and smart logistics systems. In advanced cities (e.g., Jinan, Qingdao), promote the digital transformation of traditional infrastructure and enhance the synergy between digital technology and the port economy. Strengthen digital transport networks, port digitalization, and e-commerce infrastructure.
Strengthen Scientific and Technological Innovation and Talent Support: Implement a multi-tiered talent strategy. In advanced regions, attract world-class experts in cross-border e-commerce and industrial internet through incentives such as tax benefits and talent green cards. In less-developed areas, focus on localized digital skills training and encourage skilled professionals to return through initiatives like the “Returning Talent Initiative.” Establish provincial-level coordination mechanisms—such as special scholarships and international digital forums—to attract high-end talent and address basic digital skill gaps.
Cultivate New Cross-Border E-Commerce Business Models: Leverage the policy advantages of the Qingdao and Jinan Cross-Border E-Commerce Comprehensive Pilot Zones to streamline customs procedures and optimize regulatory models. Develop international logistics channels using Shandong’s port resources to launch dedicated cross-border e-commerce shipping routes. Establish robust intellectual property protection mechanisms. Encourage traditional foreign trade enterprises to undergo digital transformation and support key industries in expanding into international markets. Promote innovative approaches such as “cross-border e-commerce + live streaming” and establish e-commerce industrial parks. Create special funds for overseas warehouse construction and brand promotion. Enhance talent development through university-enterprise partnerships.
Implement Digital Transformation of Regional Characteristic Industries: Advance industrial digitalization based on the “One Cluster, Two Hubs, Three Circles” regional framework. In the Jiaodong Economic Circle, deepen the integration of Qingdao’s smart home appliance and Yantai’s high-end chemical industries with industrial internet platforms. In the Provincial Capital Economic Circle, utilize Jinan’s strengths in big data to establish a hub for digital technological innovation. In the Southern Shandong Economic Circle, focus on characteristic sectors such as commerce and logistics in Linyi and biomedicine in Heze, developing regional industrial internet platforms and digitally restructuring agricultural supply chains. Introduce a “chain leader + digital specialist” mechanism and establish a provincial guidance fund for industrial digitalization. Support industry-university-research collaboration through digital twin labs and promote smart agriculture applications in demonstration zones. Aim for full digital transformation of all designated scale-industrial enterprises within three years.
8. Authors’ contributions
Jiayi Sun and Yaxin Liu contributed equally to this work.
References
[1]. Tapscott D. The digital economy: Promise and peril in the age of networked intelligence [M]. New York: McGraw-Hill, 1996.
[2]. Li Xiaohua. Digital economy characteristics and the formation mechanism of new momentum of digital economy [J]. Reform, 2019, 309(11): 40-51.
[3]. Li Changjiang. A preliminary discussion on the connotation of digital economy [J]. E-government, 2017(09).
[4]. Zhang Xinwei, Jiang Changliu. Research on the factorisation process of data and its integration mechanism with the digitalisation of traditional industries [J]. Shanghai Economic Research, 2021(3: 60-69).
[5]. WANG Jun, ZHU Jie, LUO Xi. Development level and evolution measurement of China's digital economy [J]. Research on Quantitative and Technical Economics, 2021(7): 26-42.
[6]. LIU Jun, YANG Yuanjun, ZHANG Sanfeng. A Study on the Measurement and Driving Factors of China's Digital Economy [J]. Shanghai Economic Research, 2020(06)
[7]. PANG Jian, ZHU Xinmin. Development trend of foreign digital economy and national development strategy of digital economy [J]. Science and Technology Progress and Countermeasures, 2013 (08): 124-128.
[8]. ZHANG Xueling, CHEN Fang. Research on the development quality of China's digital economy and its influencing factors [J]. Productivity Research 2018 (06): 67-71.
[9]. Ren Baoping: The Logic, Mechanism and Path of Digital Economy Leading High Quality Development [J]. Journal of Xi'an Finance and Economics College 2020, Issue 2 .
[10]. Lang Lihua, Chu Tingting. Research on the export effect of digital economy development [J]. Journal of Soochow University (Philosophy and Social Science Edition), 2022, 43(4): 121-131.
[11]. Jiang M, Jia P. Does the level of digitalised service drive the global export of digital service trade ? Evidence from global Perspective [J]. Telematics and Informatics, 2022, 72: 101853.
[12]. Li Ruiqin, Wang Liyong. Mechanisms, Challenges and Countermeasures of the Digital Technology Revolution to Promote High-Quality Development of China's Manufacturing Export Trade [J]. International Trade, 2022(11): 11-18.
[13]. HAN Zhao'an, ZHAO Jingfeng, WU Haizhen. A study on the size measurement, non-equilibrium and regional differences of China's inter-provincial digital economy [J]. Research on Quantitative and Technical Economics, 2021, 38(08): 164-181.
[14]. LIU Chuanming, YIN Xiu, WANG Linsuan. Regional differences and distributional dynamics of China's digital economy [J]. China Science and Technology Forum, 2020(3): 97-109.
[15]. Feng Xiaoyu. Regional differences in the development of digital economy and the dynamic evolution of distribution [J]. E-Commerce Review, 2024.13(3): 8857-8871.
[16]. LIU Jincheng. Research on the Impact of Digital Economy Development on Export Trade of Shandong Province [D]. Ningxia: Northern University for Nationalities, 2024.
[17]. Jian Lingxiang, Su Yuling, Cao Shanshan. Study on the High Quality Development of Marine Industry in Coastal Areas Driven by Digital Economy [J]. Statistics and Information Forum. 2021 , 36 (11) : 28-40.
[18]. Li Hongliang, Xie Jianguo, Yang Jijun. Financial sector liberalisation and the export value-added rate of Chinese firms [J]. International Trade Issues, 2021, (07): 54-73.DOI: 10.13510/j.cnki.jit.2021.07.004.
[19]. Zhang Yan, Gong Liutang. Taxation Reform, Fiscal Decentralisation and China's Economic Growth [J]. Economics(Quarterly), 2005, (04): 75-108.
[20]. O'brien, R.M. A Caution Regarding Rules of Thumb for Variance Inflation Factors. Qual Quant 41, 673-690 (2007). https: //doi.org/10.1007/s11135-006-9018-6
[21]. Krugman P .Increasing Returns and Economic Geography [J].Journal of Political Economy, 1991, 99(3): 483-499.DOI: 10.2307/2937739.
Cite this article
Sun,J.;Liu,Y.;Li,J. (2025). Research and policy recommendations on the level of digital economy and trade exports in Shandong Province. Journal of Applied Economics and Policy Studies,18(9),194-209.
Data availability
The datasets used and/or analyzed during the current study will be available from the authors upon reasonable request.
Disclaimer/Publisher's Note
The statements, opinions and data contained in all publications are solely those of the individual author(s) and contributor(s) and not of EWA Publishing and/or the editor(s). EWA Publishing and/or the editor(s) disclaim responsibility for any injury to people or property resulting from any ideas, methods, instructions or products referred to in the content.
About volume
Journal:Journal of Applied Economics and Policy Studies
© 2024 by the author(s). Licensee EWA Publishing, Oxford, UK. This article is an open access article distributed under the terms and
conditions of the Creative Commons Attribution (CC BY) license. Authors who
publish this series agree to the following terms:
1. Authors retain copyright and grant the series right of first publication with the work simultaneously licensed under a Creative Commons
Attribution License that allows others to share the work with an acknowledgment of the work's authorship and initial publication in this
series.
2. Authors are able to enter into separate, additional contractual arrangements for the non-exclusive distribution of the series's published
version of the work (e.g., post it to an institutional repository or publish it in a book), with an acknowledgment of its initial
publication in this series.
3. Authors are permitted and encouraged to post their work online (e.g., in institutional repositories or on their website) prior to and
during the submission process, as it can lead to productive exchanges, as well as earlier and greater citation of published work (See
Open access policy for details).
References
[1]. Tapscott D. The digital economy: Promise and peril in the age of networked intelligence [M]. New York: McGraw-Hill, 1996.
[2]. Li Xiaohua. Digital economy characteristics and the formation mechanism of new momentum of digital economy [J]. Reform, 2019, 309(11): 40-51.
[3]. Li Changjiang. A preliminary discussion on the connotation of digital economy [J]. E-government, 2017(09).
[4]. Zhang Xinwei, Jiang Changliu. Research on the factorisation process of data and its integration mechanism with the digitalisation of traditional industries [J]. Shanghai Economic Research, 2021(3: 60-69).
[5]. WANG Jun, ZHU Jie, LUO Xi. Development level and evolution measurement of China's digital economy [J]. Research on Quantitative and Technical Economics, 2021(7): 26-42.
[6]. LIU Jun, YANG Yuanjun, ZHANG Sanfeng. A Study on the Measurement and Driving Factors of China's Digital Economy [J]. Shanghai Economic Research, 2020(06)
[7]. PANG Jian, ZHU Xinmin. Development trend of foreign digital economy and national development strategy of digital economy [J]. Science and Technology Progress and Countermeasures, 2013 (08): 124-128.
[8]. ZHANG Xueling, CHEN Fang. Research on the development quality of China's digital economy and its influencing factors [J]. Productivity Research 2018 (06): 67-71.
[9]. Ren Baoping: The Logic, Mechanism and Path of Digital Economy Leading High Quality Development [J]. Journal of Xi'an Finance and Economics College 2020, Issue 2 .
[10]. Lang Lihua, Chu Tingting. Research on the export effect of digital economy development [J]. Journal of Soochow University (Philosophy and Social Science Edition), 2022, 43(4): 121-131.
[11]. Jiang M, Jia P. Does the level of digitalised service drive the global export of digital service trade ? Evidence from global Perspective [J]. Telematics and Informatics, 2022, 72: 101853.
[12]. Li Ruiqin, Wang Liyong. Mechanisms, Challenges and Countermeasures of the Digital Technology Revolution to Promote High-Quality Development of China's Manufacturing Export Trade [J]. International Trade, 2022(11): 11-18.
[13]. HAN Zhao'an, ZHAO Jingfeng, WU Haizhen. A study on the size measurement, non-equilibrium and regional differences of China's inter-provincial digital economy [J]. Research on Quantitative and Technical Economics, 2021, 38(08): 164-181.
[14]. LIU Chuanming, YIN Xiu, WANG Linsuan. Regional differences and distributional dynamics of China's digital economy [J]. China Science and Technology Forum, 2020(3): 97-109.
[15]. Feng Xiaoyu. Regional differences in the development of digital economy and the dynamic evolution of distribution [J]. E-Commerce Review, 2024.13(3): 8857-8871.
[16]. LIU Jincheng. Research on the Impact of Digital Economy Development on Export Trade of Shandong Province [D]. Ningxia: Northern University for Nationalities, 2024.
[17]. Jian Lingxiang, Su Yuling, Cao Shanshan. Study on the High Quality Development of Marine Industry in Coastal Areas Driven by Digital Economy [J]. Statistics and Information Forum. 2021 , 36 (11) : 28-40.
[18]. Li Hongliang, Xie Jianguo, Yang Jijun. Financial sector liberalisation and the export value-added rate of Chinese firms [J]. International Trade Issues, 2021, (07): 54-73.DOI: 10.13510/j.cnki.jit.2021.07.004.
[19]. Zhang Yan, Gong Liutang. Taxation Reform, Fiscal Decentralisation and China's Economic Growth [J]. Economics(Quarterly), 2005, (04): 75-108.
[20]. O'brien, R.M. A Caution Regarding Rules of Thumb for Variance Inflation Factors. Qual Quant 41, 673-690 (2007). https: //doi.org/10.1007/s11135-006-9018-6
[21]. Krugman P .Increasing Returns and Economic Geography [J].Journal of Political Economy, 1991, 99(3): 483-499.DOI: 10.2307/2937739.