


1. Introduction
Since the 1990s, China’s e-commerce industry has grown from scratch and gone through several stages, including the incubation period (1999–2005), the innovation period (2005–2015), and the maturity stage starting in 2015, when the scale of online retail transactions surpassed one trillion yuan. With the support of 4G networks and the advent of 5G technology, e-commerce has gained a broader environment and market. Various new business models have emerged, such as Business-to-Customer (B2C), Consumer-to-Consumer (C2C), and group-buying platforms. Among them, the Online-to-Offline (O2O) model — which integrates online payment channels with offline store experiences — has become a representative e-commerce form that guides consumers to physical stores through online promotions, thereby increasing sales volumes and improving the conversion of online traffic into offline customers [1,2].
With the development of 4G and 5G technologies, more and more sectors in China, including group-buying, retail, tourism, and catering, have adopted the O2O model to bridge online and offline channels. After a period of exploration, issuing online coupons has become the preferred strategy for businesses to attract customers to brick-and-mortar stores, as coupons not only stimulate consumption but also increase the proportion of offline revenue. However, many businesses still distribute coupons randomly without any scientific method to improve their redemption rates . The indiscriminate issuance of coupons may disturb consumers and damage brand reputation, while also making marketing costs difficult to estimate [3]. Therefore, it is necessary to build machine learning models based on users’ historical consumption data and merchants’ coupon redemption records to predict the likelihood of coupon usage. Such models enable personalized coupon targeting, which is an effective approach to increase redemption rates, deliver tangible benefits to consumers with specific preferences, and create more marketing opportunities for businesses .
Against this backdrop, this study uses real-world data provided by the Alibaba Tianchi competition and constructs three machine learning models — LightGBM (which offers faster training speed, lower memory consumption, and better accuracy), GBDT (which performs well without feature scaling), and XGBoost (which incorporates regularization into the objective function to prevent overfitting) — to predict the likelihood of coupon usage and provide actionable insights for merchants’ personalized coupon distribution strategies.
2. Literature review
In recent years, with the rapid development of e-commerce, offline retailers have been increasingly losing market share to online platforms. Against this backdrop, O2O coupons have become an important tool for offline merchants to attract customers. However, the indiscriminate issuance of coupons can lead to waste and damage brand reputation, while inappropriate distribution strategies may reduce their effectiveness. Therefore, predicting consumer behavior and implementing personalized coupon distribution has become a major research trend. A substantial body of literature — both domestic and international — has examined O2O coupon usage and characteristics, producing a wide range of findings. The studies most relevant to this paper focus on three areas: factors influencing O2O coupon usage, personalized recommendation, and model algorithms.
2.1. Research on factors influencing O2O coupon usage
Numerous scholars have explored the factors affecting O2O coupon usage and identified a wide range of determinants. Chiang et al. [5] argued that users’ redemption behavior is influenced by their perceived value, coupon characteristics, and perceived usefulness. Young et al. [6] found that gender plays a significant role: female users are more concerned with timeliness and enjoyment, whereas male users value convenience. Ma [7] showed that the distance to the nearest store significantly influences coupon usage, while Ling [8] highlighted that macro-environmental factors, consumption environment, coupon characteristics, and consumer attributes jointly affect redemption rates.
Many studies have also adopted machine learning techniques to further explore the determinants of coupon usage. In China, Huang et al. [9] collected survey data and applied the PAM algorithm to categorize consumers into five groups: (1) those who rarely shop online, (2) and (3) consumers who mainly spend on food and beverages, (4) those who spend on food, beverages, travel, and accommodation, and (5) users with broader spending patterns. Internationally, Jayasingh [10] employed the Technology Acceptance Model (TAM) to analyze consumer attitudes and behavioral intentions toward mobile coupons, concluding that enhancing perceived usefulness is essential for marketing practitioners. Coupon usefulness, ease of use, merchant reputation, and social influence all have a positive impact on consumer behavior. Moreover, concerns about security and privacy are also important determinants of coupon usage.
2.2. Research on personalized recommendation
Research on personalized recommendation systems began in the 1970s and has since expanded into various domains, with e-commerce being the most prominent. Major platforms such as JD.com, Taobao, and Meituan have all experimented with personalized recommendation technologies [11]. Huang et al. [12] proposed an improved trust-level recommendation algorithm that integrates similarity and trust metrics to enhance recommendation accuracy. Gao et al. [13] developed a personalized recommendation model based on the Latent Dirichlet Allocation (LDA) topic model to predict content users are most likely to be interested in on microblogging platforms, thereby improving the precision of content delivery.
2.3. Research on model algorithms
One of the key aspects of data mining is the development of effective model algorithms. Many scholars have applied random forest and logistic regression models in various fields. Wu et al. [14], for example, used naïve Bayes, k-nearest neighbors, logistic regression, neural networks, decision trees, and random forests to predict O2O coupon usage, with results showing that random forest models achieved the highest prediction accuracy. Liu and Li [15] built a credit risk assessment model for P2P lending using random forests, extending the algorithm’s application scope. Yue [16] proposed a business intelligence-based marketing prediction model that forecasts sales of promotional products based on coupon value and distribution timing, providing theoretical support for marketing decision-making.
In recent years, Gradient Boosted Decision Trees (GBDT) and the improved XGBoost algorithm proposed by Chen et al. [17] have been widely applied. Cai et al.[18] extracted feature combinations using GBDT and then employed logistic regression to construct a personal credit risk assessment model, achieving higher prediction accuracy. Jia et al. [19] applied XGBoost to build a predictive scoring model for clinical data, demonstrating its effectiveness in the medical field. Ye et al. [20] analyzed retail data from Germany’s Rossmann stores and showed that the XGBoost-based ensemble learning algorithm achieved high computational efficiency and predictive accuracy. He et al. [21] used Bayesian hyperparameter optimization to improve the LGBM model for network intrusion classification, significantly enhancing recall and detection performance.
3. Construction of the O2O coupon usage prediction model
3.1. Feature extraction
The dataset used in this study comes from real consumer data provided by a public competition. The raw dataset inevitably contains missing values, outliers, and other types of noise. Therefore, appropriate data preprocessing methods are required to clean and transform the data. Once extracted, cleaned, and converted, the data are integrated into a complete dataset that provides a solid basis for decision-making.
Feature extraction is performed prior to feature selection. Its purpose is to automatically construct new features from the raw data and transform them into a set of features with clear physical meanings. This process reduces dimensionality and eliminates redundancy. Feature selection is a crucial step in data preprocessing: selecting the most important features mitigates the “curse of dimensionality” and removing irrelevant features reduces the complexity of the learning task.
In this study, we extract the following categories of features within the prediction period: coupon-related features, merchant-related features, user-related features, and user-merchant interaction features.
3.2. Model construction
The Gradient Boosting Decision Tree (GBDT) algorithm has strong expressive power due to its rich nonlinear transformations and does not require complex feature engineering or feature transformations. XGBoost, an optimized distributed gradient boosting library, is designed to be efficient, flexible, and portable. LightGBM, on the other hand, offers faster training speed, lower memory consumption, higher accuracy, and support for distributed computing, making it suitable for large-scale data processing.
Therefore, this study constructs and compares three models — GBDT, XGBoost, and LightGBM — and selects the one with the best predictive performance as the optimal model.
3.3. Model evaluation
Model evaluation refers to the process of assessing the performance of one or more models based on their categories using various metrics. It is a crucial step in the machine learning workflow. In this study, we adopt the F1-score and Area Under the Curve (AUC) as evaluation metrics to determine the optimal model through comparative analysis.
To calculate accuracy, precision, recall, and the F1-score, we consider the confusion matrix, which is structured as shown in Table 1 below:
|
Positive |
Negative |
|
|
True |
TruePositive(TP) |
TrueNegative(TN) |
|
False |
FalsePositive(FP) |
FalseNegative(FN) |
4. Results of O2O coupon usage prediction
4.1. Data description
The dataset used in this study originates from real online and offline consumer data provided by the Alibaba Tianchi O2O Coupon Usage Prediction Competition. A partial sample of users’ offline consumption and coupon redemption behavior is shown below in Table 2.
|
Field |
Description |
|
User_id |
User ID |
|
Merchant_id |
Merchant ID |
|
Coupon_id |
Coupon ID |
|
Discount_rate |
Discount rate |
|
Distance |
The shortest distance between the user’s frequently visited location and the merchant’s nearest store |
|
Date_received |
Date when the coupon was received |
|
Date |
Date of consumption |
|
Action |
0: Click, 1: Purchase, 2: Receive coupon |
4.2. Data preprocessing
4.2.1. Results of exploratory data analysis
Exploring the dataset is the first step in the data analysis process. Through exploratory analysis, one can gain an understanding of the available data, identify relevant research questions, determine how to construct them, and find the best way to manipulate data sources to obtain the desired answers.
Based on the dataset and the description of its attributes, a variety of useful hidden information can be derived. In particular, by examining whether the fields Date_received and Date are null or not, the dataset can be divided into four categories:
1. Coupon received and product purchased
2. Coupon received but product not purchased
3. No coupon received but product purchased
4. No coupon received and product not purchased
The classification results are shown in Table 3.
|
Purchased Products |
Did Not Purchase Products |
|
|
With Coupon |
75382 |
977900 |
|
Without Coupon |
701602 |
0 |
It can be observed that consumers who did not use coupons fall mainly into two categories: (1) those who purchased products without having coupons, and (2) those who received coupons but did not use them when making purchases. The proportion of consumers who actually redeemed coupons when purchasing products is relatively small. Therefore, it is necessary to improve the precision of coupon distribution and increase coupon utilization rates.
4.2.2. Feature extraction results
Feature extraction is a fundamental operation in data processing and is often used to examine each data element to determine whether it represents a meaningful feature. It serves two main purposes: reducing data dimensionality and standardizing the dataset. The feature extraction process in this study is described as follows:
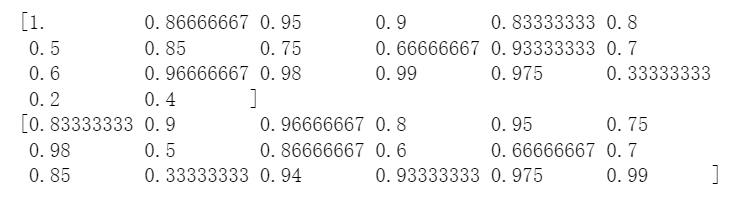
4.2.2.1. Discount rate
As shown in Table 2, the data in the Discount_rate field are expressed in three different formats:
• “null” — indicating no discount;
• A value in the range [0, 1] — representing the discount rate directly;
• “x:y” — indicating a reduction of y when spending at least x.
These three formats were standardized through data transformation, and the results are illustrated in Figure 1.
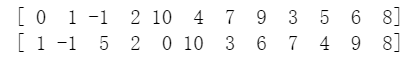
4.2.2.2. Distance
The Distance field contains both numerical values and character types (such as “null”). To unify the data format, all “null” values were replaced with -1, converting the field from string type to integer type. The transformation results are shown in Figure 2.
4.2.2.3. Date
Another important factor affecting coupon usage is the date. The date on which the coupon is received (Date_received) can influence the date of consumption (Date). Since both fields contain “null” values and differ in data type, conversion is necessary. Considering that consumers are more likely to use coupons received on weekends, Saturday and Sunday were encoded as 1, while other days were encoded as 0. Additionally, one-hot encoding was applied to extract and transform coupon receipt dates from Monday to Sunday. The results are shown in Table 4.
|
weekday |
weekday_type |
weekday_1 |
weekday_2 |
weekday_3 |
weekday_4 |
weekday_5 |
weekday_6 |
weekday_7 |
|
null |
0 |
0 |
0 |
0 |
0 |
0 |
0 |
0 |
|
6 |
1 |
0 |
0 |
0 |
0 |
0 |
1 |
0 |
|
3 |
0 |
0 |
0 |
1 |
0 |
0 |
0 |
0 |
|
6 |
1 |
0 |
0 |
0 |
0 |
0 |
1 |
0 |
|
1 |
0 |
1 |
0 |
0 |
0 |
0 |
0 |
0 |
To further explore relationships within the data, we also analyzed the number of coupons received by users each day and the number of coupons used for purchasing products. The daily number of coupons received by users is shown in Table 5, while the number of coupons used for purchases is shown in Table 6.
|
Date_received |
count |
|
|
0 |
20160101 |
554 |
|
1 |
20160102 |
542 |
|
2 |
20160103 |
536 |
|
3 |
20160104 |
577 |
|
4 |
20160105 |
691 |
|
Date_received |
count |
|
|
0 |
20160101 |
74 |
|
1 |
20160102 |
67 |
|
2 |
20160103 |
74 |
|
3 |
20160104 |
98 |
|
4 |
20160105 |
107 |
The daily coupon redemption rate is a crucial feature. Based on the dataset analysis, we define positive samples as cases where a coupon was received and subsequently used within the prediction period, and negative samples as cases where a coupon was received but not used. According to the dataset, there are 75,382 positive samples and 977,900 negative samples. The proportion of positive and negative samples is illustrated in Figure 3.
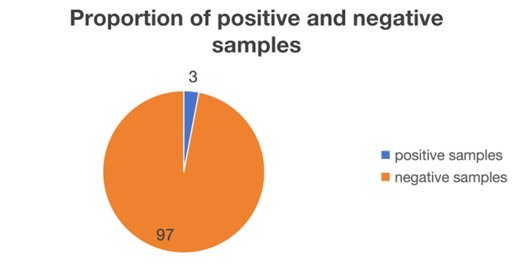
From Figure 6, it can be seen that there is a significant imbalance between positive and negative samples. Due to this imbalance, the model tends to minimize loss by predicting most samples as negative in many regions of the feature space. As a result, the model may fail to learn meaningful patterns, and its predictions may concentrate around zero.
The idea of using a sliding window sampling method originates from the sliding window algorithm commonly used in computer communications. A sliding window means that after each time interval, the window moves forward, and the length of each window equals the duration of the signal. According to the First-In-First-Out (FIFO) principle, the data within the window are continuously updated while the number of data points remains unchanged [22].
Although the dataset used in this study is not a text stream, it records the timing of each consumer’s activities — such as when they received and used coupons — and therefore exhibits time-series characteristics. A schematic of the dataset segmentation using the sliding window method is shown in Table 7.
|
Dataset |
Prediction Interval |
Feature Interval |
|
Test Set |
20160701-20160731 |
20160701-20160731 |
|
Test Set1 |
20160701-20160731 |
20160701-20160731 |
|
Test Set2 |
20160701-20160731 |
20160701-20160731 |
After applying the sliding window sampling approach, the division of sample intervals becomes more granular, enabling the generation of more training sets for model learning. Moreover, this method helps alleviate the problem of extreme class imbalance between positive and negative samples.
4.2.3. Feature selection results
Feature selection refers to the process of selecting N features from an existing set of M features such that a specific system metric is optimized. It is a process aimed at reducing data dimensionality, lowering model complexity and computational cost, and ultimately improving the performance of machine learning algorithms. The primary objectives of feature selection are threefold: to reduce dimensionality, to decrease the difficulty of the learning task, and to enhance the efficiency of the model.
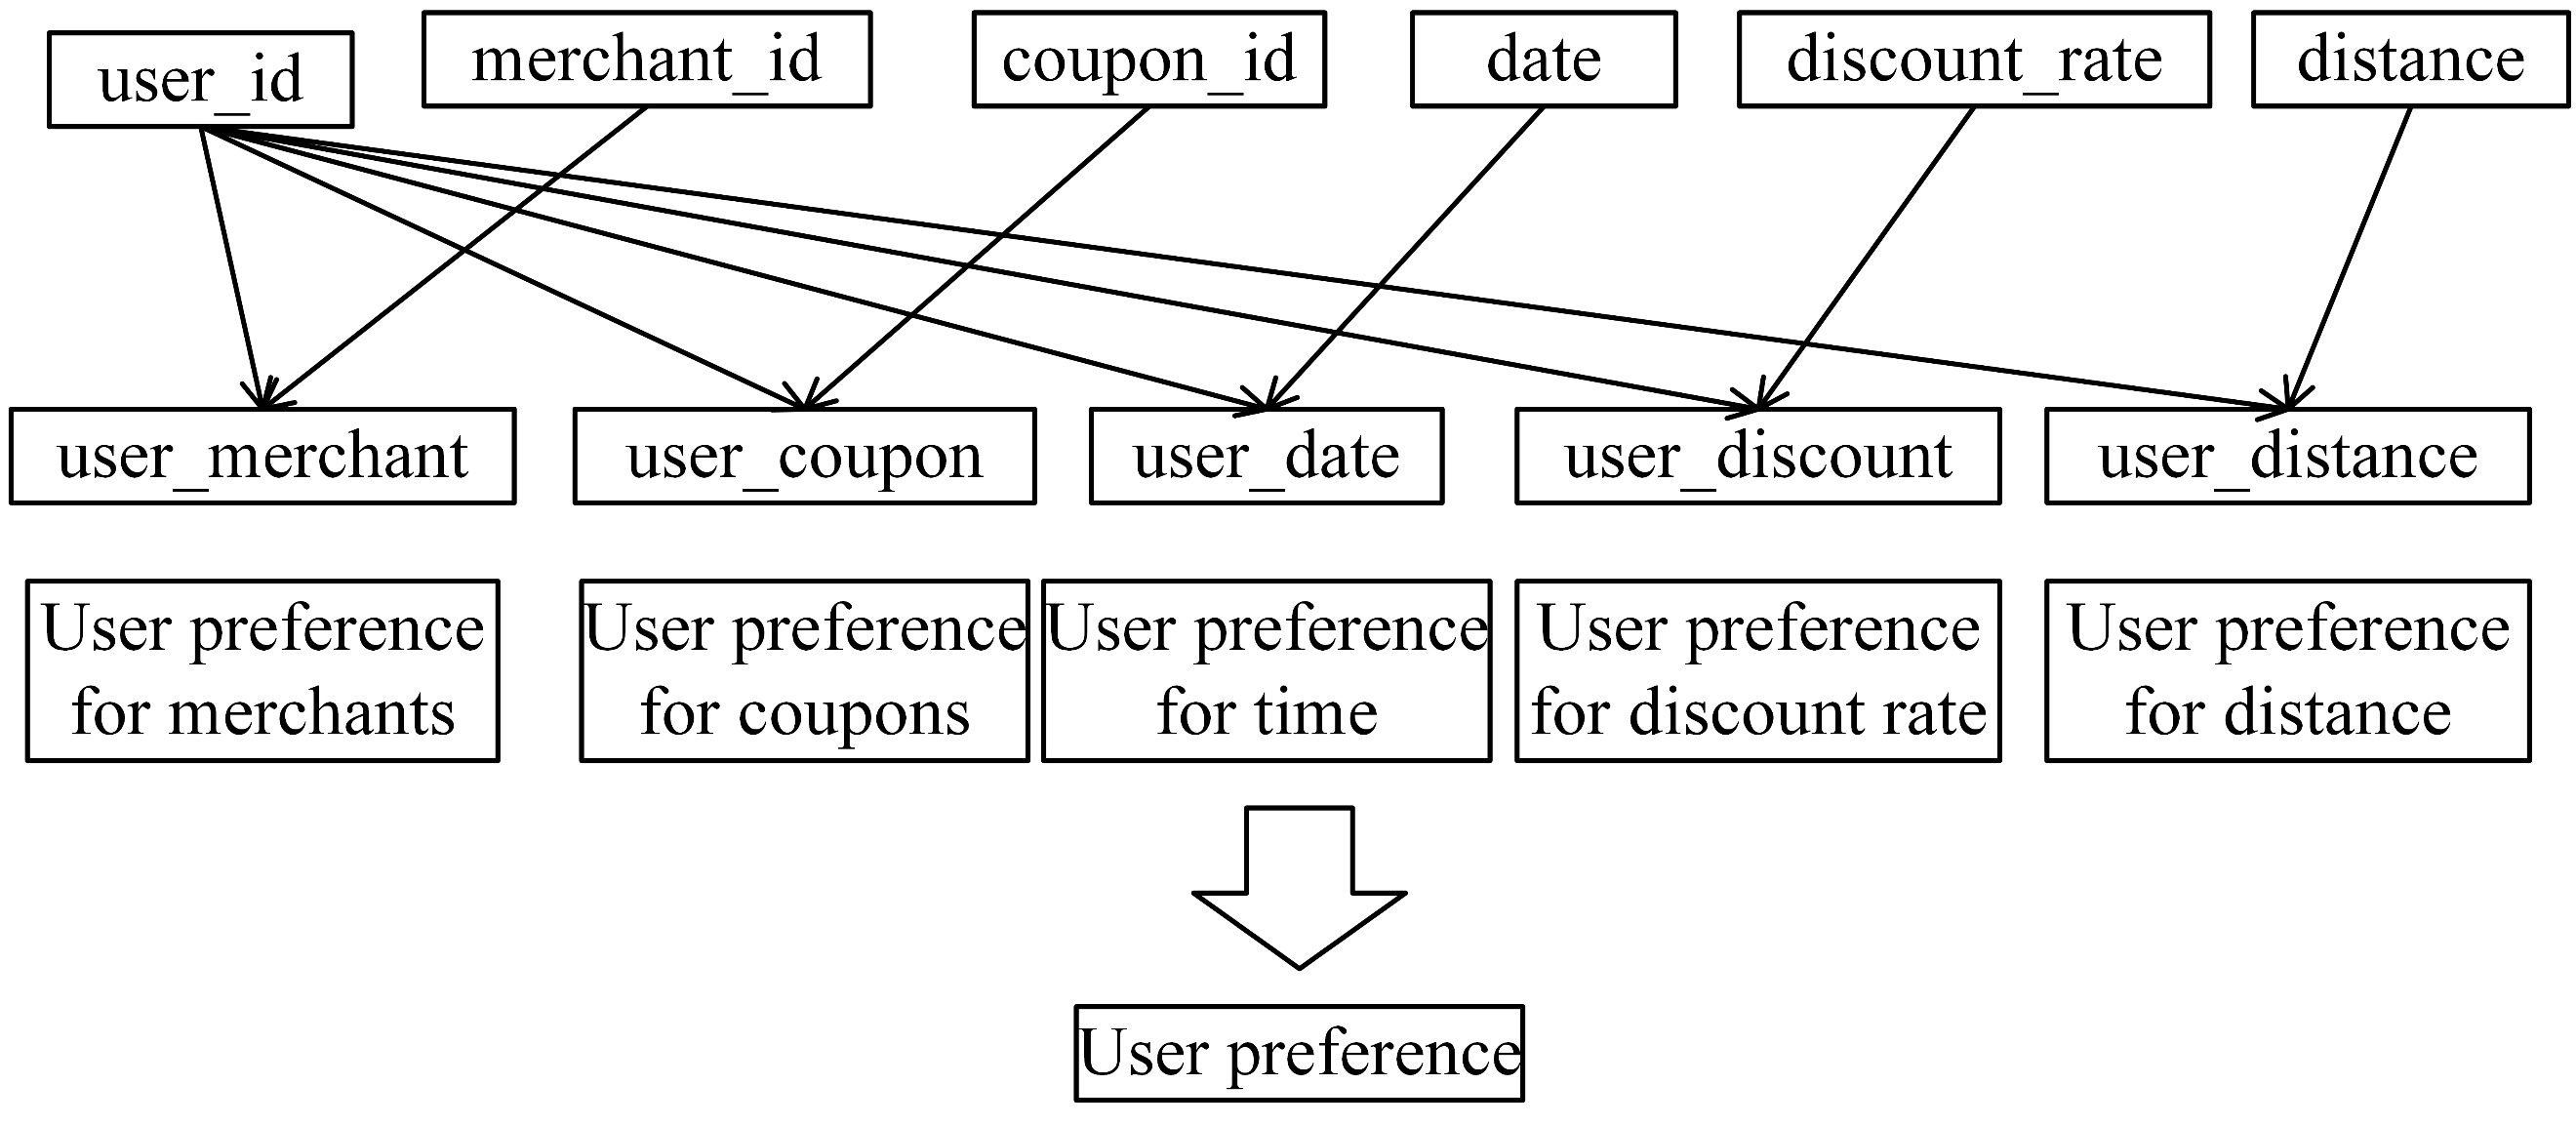
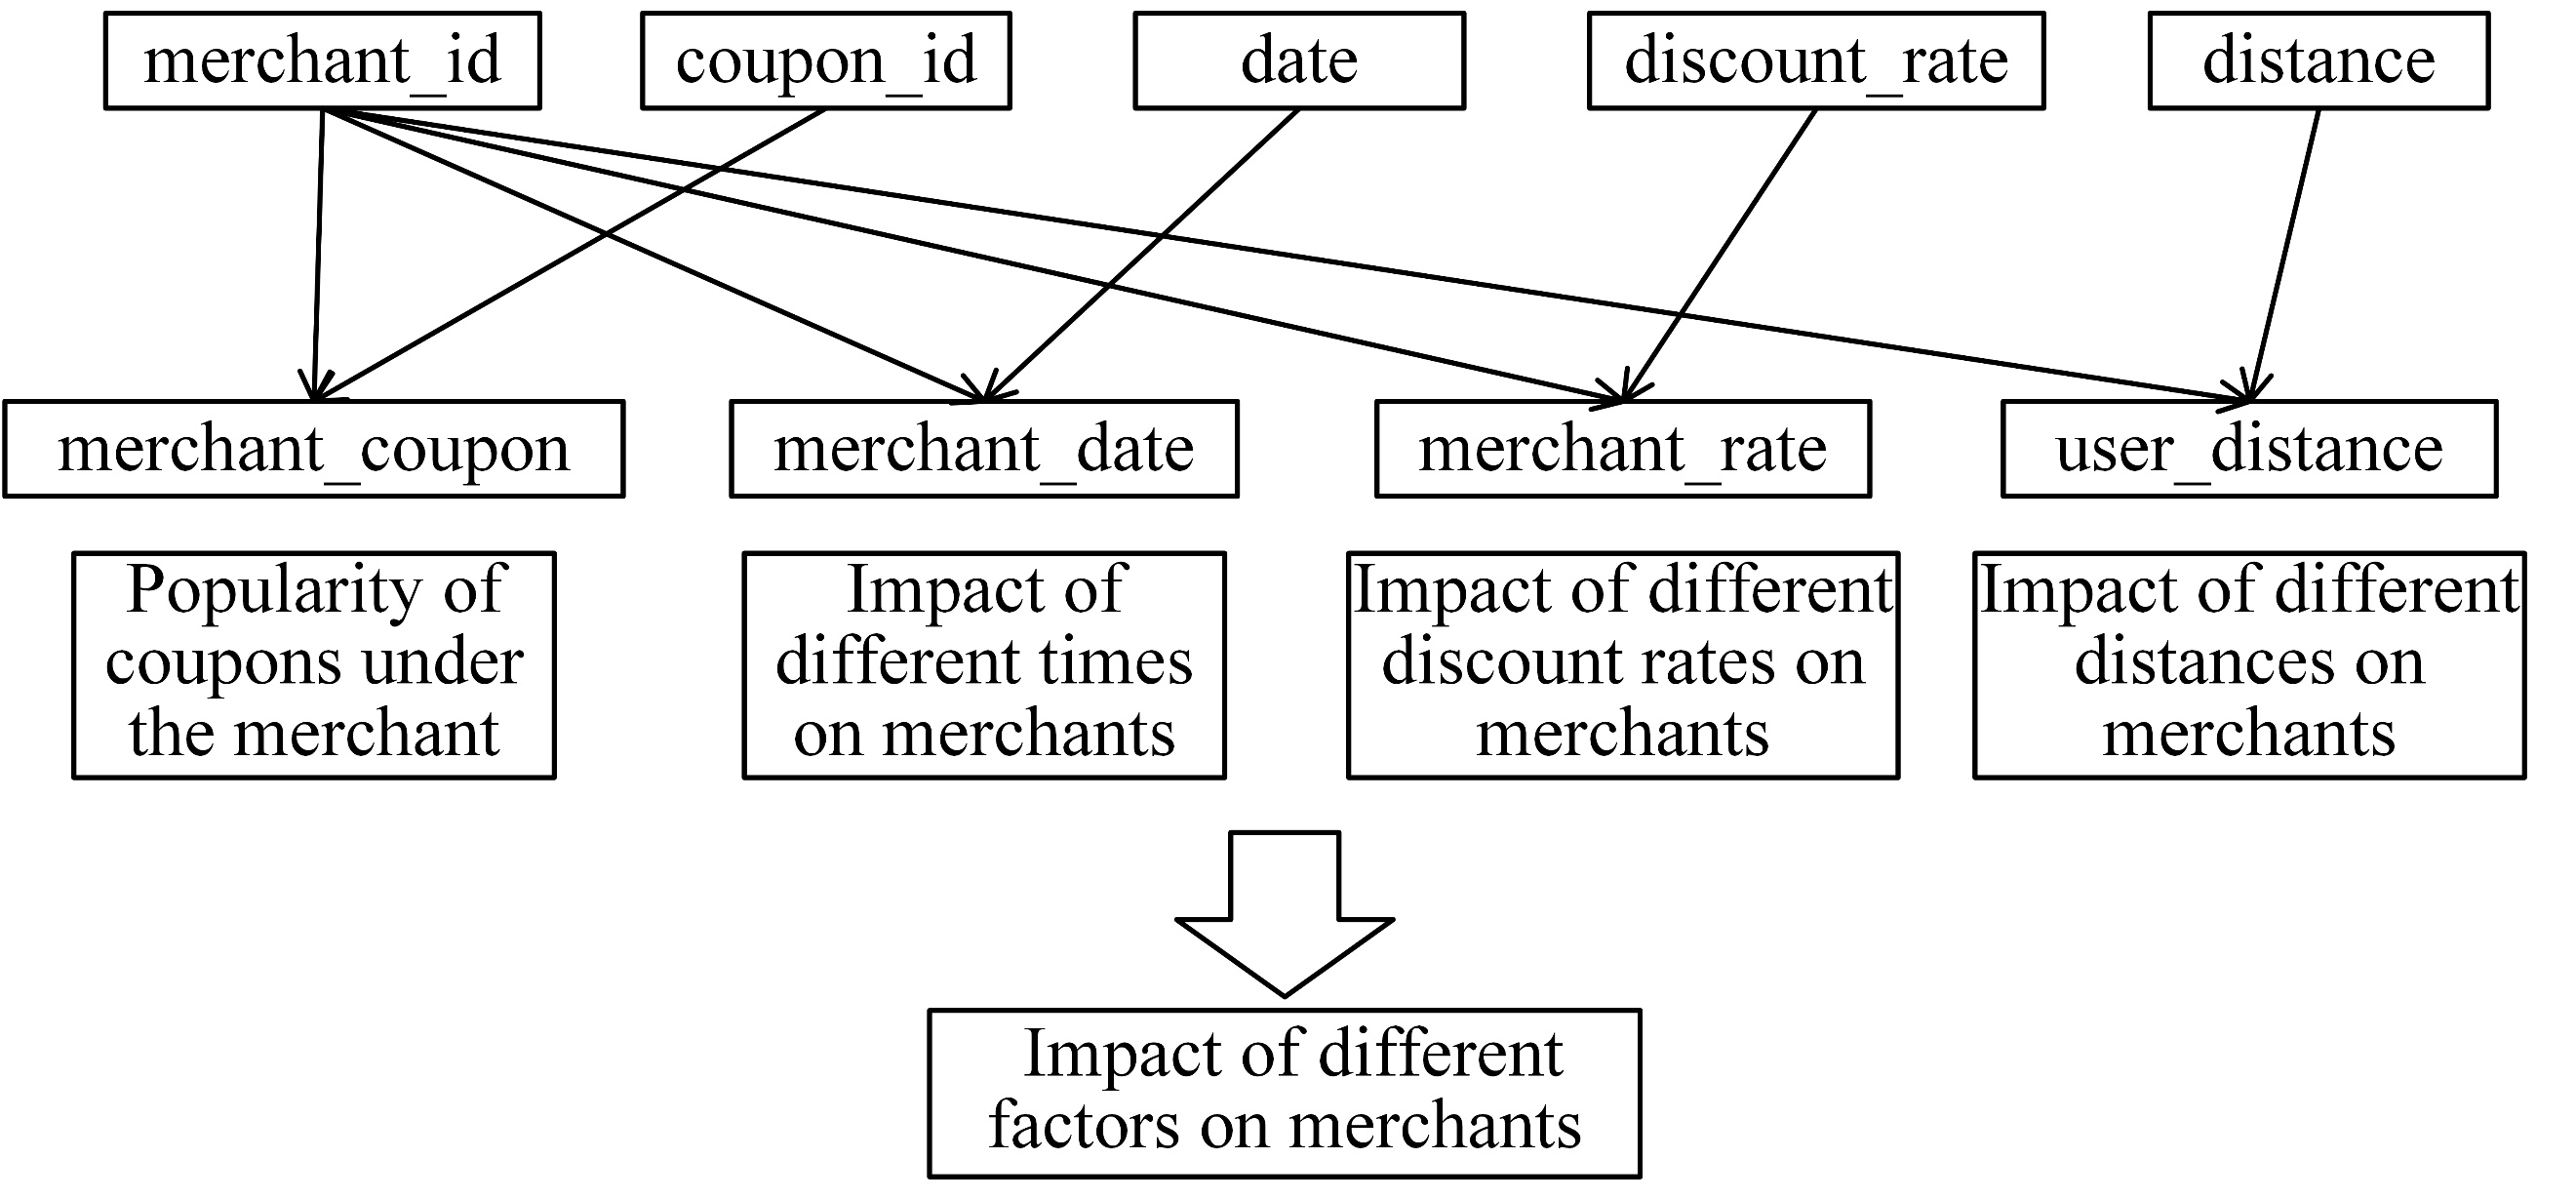
From an intuitive perspective, the dataset allows for the extraction of several fundamental categories of features, including user-related features, merchant-related features, and coupon-related features. Among these, the user-level combined features are illustrated in Figure 4, while the merchant-level combined features are shown in Figure 5.
4.3. Prediction model construction and result analysis
4.3.1. Prediction based on the GBDT algorithm
The parameter settings of the Gradient Boosting Decision Tree (GBDT) model are shown in Table 8.
|
Parameter Name |
Setting |
|
learning_rate n_estimators max_depth min_samples_leaf min_samples_split max_features subsample random_state |
0.1 60 7 60 1200 sqrt 0.8 10 |
For the learning_rate (weight shrinkage coefficient), selecting a value less than 1 can make the model more robust and help reduce variance. It is typically chosen within the range of 0.1 to 0.5, and after experimentation, a value of 0.1 was selected. For n_estimators (the maximum number of iterations), the optimal performance was observed when the value was set to 60. The max_depth (maximum depth of the tree) was set to 7. The min_samples_leaf (minimum number of samples required at a leaf node) was determined to be 60 through testing. The min_samples_split (minimum number of samples required to split an internal node) should be neither too small nor too large; the best result was achieved when it was set to 1200. The max_features (maximum number of features considered for splitting) was set to the default value “sqrt”. The subsample (fraction of samples used for random sampling) was chosen as 0.8, and the random_state parameter was set to 10 by default.
After training the model with the above parameter configuration, the resulting confusion matrix based on the GBDT prediction results is shown in Table 9.
|
Predict Actual |
0 |
1 |
Total |
|
0 |
85000 |
4592 |
89592 |
|
1 |
1256 |
7060 |
8316 |
|
Total |
86256 |
11652 |
97908 |
The F1-score is 70.713%, and the AUC of the prediction results based on the GBDT algorithm is 0.7643.
4.3.2. Prediction based on the XGBoost algorithm
The parameter settings of the XGBoost model are shown in Table 10.
|
Parameter Name |
Setting |
|
gamma min_child_weight max_depth lambda subsample colsample_bytree eta tree_method seed nthread |
0.1 1.1 5 10 0.7 0.7 0.01 exact 0 12 |
The parameter max_depth is straightforward — it represents the maximum depth of each base decision tree. The parameter subsample controls the proportion of samples randomly selected for each tree, typically ranging from 0.5 to 1. The parameter colsample_bytree determines the proportion of features (columns) randomly sampled for each tree, while colsample_bylevel controls the proportion of features sampled at each level for every split. The parameter seed is used to reproduce the results of random data generation and can also assist in parameter tuning. Finally, nthread specifies the number of threads for parallel processing and should match the number of CPU cores in the system.
After running the code, the resulting confusion matrix is shown in Table 11.
|
Predict Actual |
0 |
1 |
Total |
|
0 |
82651 |
3980 |
86631 |
|
1 |
1090 |
10187 |
11277 |
|
Total |
83741 |
14167 |
97908 |
The parameters listed above represent only the most important ones. Using the trained model to make predictions on the test set, the model achieved an F1-score of 80.074% and an AUC value of 0.8137.
4.3.3. Prediction based on the lightgbm algorithm
The parameter settings of the LightGBM model are shown in Table 12.
|
Parameter Name |
Setting |
|
application num_iterations boosting_type learning_rate min_data_in_leaf metric feature_fraction bagging_fraction bagging_freq metric_freq |
regression 500 gbdt 0.01 10 auc 0.7 1 10 1 |
The parameter num_iterations (number of iterations) is typically set as a multiple of 100, and in this study, it was finally determined to be 500. The parameter boosting_type is usually set to “gbdt”. The learning_rate was set to the default value of 0.01. After experimentation, the parameter min_data_in_leaf performed best when set to 10. The metric was set to “auc”, as the AUC value is used as the primary evaluation metric in this study. The feature_fraction parameter is generally chosen between 0.1 and 1, and a value of 0.7 yielded the best performance. The bagging_freq parameter was set to 10, while metric_freq was kept at its default value of 1.
After running the code with these parameter settings, the resulting confusion matrix based on the LightGBM model is shown in Table 13.
|
Predict Actual |
0 |
1 |
Total |
|
0 |
82491 |
4196 |
86687 |
|
1 |
1198 |
10023 |
11221 |
|
Total |
83689 |
14219 |
97908 |
Using the trained model to make predictions on the test set, the model achieved an F1-score of 78.797% and an AUC value of 0.8054.
4.3.4. Comparison of prediction performance across single models
The Area Under the Curve (AUC) is defined as the area under the Receiver Operating Characteristic (ROC) curve. As a numerical indicator, a classifier with a higher AUC value demonstrates better performance, as AUC reflects the model’s ability to distinguish between different classes — the larger the AUC, the higher the probability that the model will classify samples correctly. Similarly, a higher F1-score indicates greater prediction stability and overall model quality. The AUC and F1-score results of the three algorithms are presented in Table 14.
|
Model |
AUC |
F1-Score |
|
GBDT |
0.7643 |
70.713% |
|
XGBoost |
0.8137 |
80.074% |
|
LightGBM |
0.8054 |
78.797% |
The GBDT algorithm has strong expressive power due to its extensive nonlinear transformations and does not require complex feature engineering or transformations. XGBoost, on the other hand, is an optimized distributed gradient boosting library designed for efficiency, flexibility, and portability. One of the key advantages of XGBoost over GBDT is that it explicitly introduces a regularization term into the objective function, which helps control model complexity. As a result, the learned model is simpler and less prone to overfitting.
According to the results shown in the table, the XGBoost algorithm outperforms GBDT in terms of both prediction accuracy and stability. LightGBM, building upon XGBoost, further optimizes cache hit rates and introduces histogram-based sparse feature processing. This results in faster training speed and lower memory consumption compared with XGBoost. However, its overall performance is slightly inferior.
Therefore, from the perspective of this experiment, XGBoost demonstrates the best predictive performance among the three algorithms.
5. Conclusion and future prospects
In this study, Python was employed to build a predictive model for O2O coupon usage using deep learning methods, particularly the XGBoost algorithm. The proposed model offers valuable insights for O2O merchants and managers by providing a scientific approach to coupon distribution and redemption prediction.
5.1. Overall summary
With the development of 4G and 5G networks, an increasing number of industries in China are leveraging O2O coupons to drive offline consumption. However, many merchants still distribute coupons randomly, lacking a systematic method to improve redemption rates. For merchants, indiscriminate coupon issuance can lead to resource waste, brand reputation damage, and unpredictable marketing costs, while for consumers, it can disrupt their purchasing decisions.
To address the problem of blind coupon distribution, this study aimed to improve the precision of O2O coupon issuance. Using user behavioral data provided by the Alibaba Tianchi platform, we conducted data exploration, feature extraction, and feature selection. Three predictive models — GBDT, XGBoost, and LightGBM — were constructed and compared. Experimental results showed that XGBoost achieved the best prediction accuracy and stability, while LightGBM had the lowest memory usage and fastest processing speed.
The key managerial insights drawn from this research are as follows: merchants should pay attention to the effects of distance and coupon issuance date on different consumer groups and aim to simplify the coupon redemption process.
The main innovations of this study are summarized below:
1. The introduction of the LightGBM algorithm into the field of O2O coupon prediction, which expands its application scope and further validates its effectiveness.
2. The use of a sliding window sampling method for splitting training and test sets. This approach enables a more granular division of sampling intervals, generates more training data, and effectively mitigates the issue of extreme class imbalance between positive and negative samples.
5.2. Limitations and future work
Although this study conducted a series of analyses and built a predictive model with satisfactory performance for O2O coupon redemption, several limitations remain due to technical and data constraints:
1. Data limitations: Due to the limited detail of the dataset, more comprehensive information on users and merchants — such as age, education level, and business type — was not available. Since O2O coupons are widely used across industries such as catering, tourism, and transportation, enhancing dataset richness is necessary. Future research could involve collecting and integrating data from more sectors to improve the model’s generalizability and applicability.
2. Model limitations: All predictive models developed in this study are single models. Future research could explore ensemble methods such as Stacking [23] to further improve prediction accuracy and enhance model performance.
References
[1]. Zhu, N. (2019). Research on the Innovation of O2O Marketing Models in the Era of Big Data.E-commerce, (03), 42–43.
[2]. Cao, J., Shi, Z., Dou, H., & Guo, Q. (2014). Analysis and Prospect of the Development Process of O2O Model in China’s Online Retail.China Business & Trade, (25), 120–123.
[3]. Yin, J. (2019). Research and Application of O2O Coupon Usage Prediction Method Based on Data Mining (Master’s thesis). Huazhong University of Science and Technology.
[4]. Huang, L. (2019). Research on O2O Coupon Conversion Rate Based on Machine Learning (Master’s thesis). Shanxi University.
[5]. Chiang, H. H., Lin, H. Y., & Tu, S. C. (2013). Analyzing Behaviors Influencing Use of Mobile Coupons from the Perspective of Transaction Utility.Social Behavior and Personality: An International Journal, 41(3), 433–441.
[6]. Ha, Y., & Im, H. (2014). Determinants of Mobile Coupon Service Adoption: Assessment of Gender Difference. International Journal of Retail & Distribution Management.
[7]. Ma, X. (2019). Research on the Impact of Online Coupons on Consumer Behavior — Based on O2O Model Analysis.Price Theory and Practice, (02), 117–120.
[8]. Ling, P. (2016). Research on E-coupon Pricing (Master’s thesis). Southwestern University of Finance and Economics.
[9]. Huang, Z., Sun, J., Liu, D., Lu, H., & Hu, H. (2018). Research on Coupon Distribution on O2O Platforms Based on Cluster Analysis.Modern Business, (12), 32–34.
[10]. Jayasingh, S., & Eze, U. C. (2009). Exploring the Factors Affecting the Acceptance of Mobile Coupons in Malaysia. In Proceedings of the 2009 Eighth International Conference on Mobile Business (pp. 329–334). IEEE.
[11]. Yao, T. (2015). Research on Personalized Recommendation Based on Collaborative Filtering Algorithms (Master’s thesis). Beijing Institute of Technology.
[12]. Huang, W., Meng, X., & Wang, L. (2011). Collaborative Filtering Algorithm Based on User Social Relationship Mining in Mobile Communication Networks.Journal of Electronics & Information Technology, 33(12), 3002–3007.
[13]. Gao, M., Jin, C., Qian, W., Wang, X., & Zhou, A. (2014). Real-Time Personalized Recommendation for Microblogging Systems.Chinese Journal of Computers, 37(04), 963–975.
[14]. Wu, J., Zhang, Y., & Wang, J. (2018). Research on Usage Prediction Methods for O2O Coupons. In International Conference on Neural Information Processing (pp. 175–183). Springer, Cham.
[15]. Liu, X., & Li, F. (2016). Credit Risk Assessment of Online Lending under Big Data — A Case Study of Renrendai.Statistics & Information Forum, 31(05), 41–48.
[16]. Yue, H. (2014). Research on Marketing Prediction Models and Algorithms in Business Intelligence (Master’s thesis). Shenyang University of Technology.
[17]. Chen, T., & Guestrin, C. (2016). XGBoost: A Scalable Tree Boosting System. In Proceedings of the 22nd ACM SIGKDD International Conference on Knowledge Discovery and Data Mining (pp. 785–794). ACM.
[18]. Cai, W., Luo, Y., Zhang, G., & Zhong, H. (2017). Personal Credit Risk Assessment Model Based on the Integration of GBDT and Logistic Regression.Management Modernization, 37(02), 1–4.
[19]. Jia, W., Sun, L., & Jing, Y. (2018). Prediction of Postoperative Prognostic Scores for Femoral Neck Fracture Surgery Based on XGBoost Model.Journal of Taiyuan University of Technology, 49(01), 174–178.
[20]. Ye, Q., Rao, H., & Ji, M. (2017). Business Sales Forecasting Based on XGBoost.Journal of Nanchang University (Science Edition), 41(03), 275–281.
[21]. He, H., Huang, G., Zhang, B., et al. (2022). Anomaly Detection Model Based on Extreme Tree Recursive Feature Elimination and LightGBM. Information Network Security.
[22]. Zheng, G., & Chen, X. (2014). Dynamic Prediction of Intelligent Switch Operation Time Based on Sliding Window Method.Automation and Instrumentation, 29(8), 61–64.
[23]. Li, H., Lin, H., & Yang, L., et al. (2018). A Two-Level Fusion Algorithm Framework for User Profiling.Computer Science, 45(1), 157–161
Cite this article
Han,Y.;Yuan,C. (2025). Research on O2O coupon usage prediction based on XGBoost model. Journal of Applied Economics and Policy Studies,18(9),226-236.
Data availability
The datasets used and/or analyzed during the current study will be available from the authors upon reasonable request.
Disclaimer/Publisher's Note
The statements, opinions and data contained in all publications are solely those of the individual author(s) and contributor(s) and not of EWA Publishing and/or the editor(s). EWA Publishing and/or the editor(s) disclaim responsibility for any injury to people or property resulting from any ideas, methods, instructions or products referred to in the content.
About volume
Journal:Journal of Applied Economics and Policy Studies
© 2024 by the author(s). Licensee EWA Publishing, Oxford, UK. This article is an open access article distributed under the terms and
conditions of the Creative Commons Attribution (CC BY) license. Authors who
publish this series agree to the following terms:
1. Authors retain copyright and grant the series right of first publication with the work simultaneously licensed under a Creative Commons
Attribution License that allows others to share the work with an acknowledgment of the work's authorship and initial publication in this
series.
2. Authors are able to enter into separate, additional contractual arrangements for the non-exclusive distribution of the series's published
version of the work (e.g., post it to an institutional repository or publish it in a book), with an acknowledgment of its initial
publication in this series.
3. Authors are permitted and encouraged to post their work online (e.g., in institutional repositories or on their website) prior to and
during the submission process, as it can lead to productive exchanges, as well as earlier and greater citation of published work (See
Open access policy for details).
References
[1]. Zhu, N. (2019). Research on the Innovation of O2O Marketing Models in the Era of Big Data.E-commerce, (03), 42–43.
[2]. Cao, J., Shi, Z., Dou, H., & Guo, Q. (2014). Analysis and Prospect of the Development Process of O2O Model in China’s Online Retail.China Business & Trade, (25), 120–123.
[3]. Yin, J. (2019). Research and Application of O2O Coupon Usage Prediction Method Based on Data Mining (Master’s thesis). Huazhong University of Science and Technology.
[4]. Huang, L. (2019). Research on O2O Coupon Conversion Rate Based on Machine Learning (Master’s thesis). Shanxi University.
[5]. Chiang, H. H., Lin, H. Y., & Tu, S. C. (2013). Analyzing Behaviors Influencing Use of Mobile Coupons from the Perspective of Transaction Utility.Social Behavior and Personality: An International Journal, 41(3), 433–441.
[6]. Ha, Y., & Im, H. (2014). Determinants of Mobile Coupon Service Adoption: Assessment of Gender Difference. International Journal of Retail & Distribution Management.
[7]. Ma, X. (2019). Research on the Impact of Online Coupons on Consumer Behavior — Based on O2O Model Analysis.Price Theory and Practice, (02), 117–120.
[8]. Ling, P. (2016). Research on E-coupon Pricing (Master’s thesis). Southwestern University of Finance and Economics.
[9]. Huang, Z., Sun, J., Liu, D., Lu, H., & Hu, H. (2018). Research on Coupon Distribution on O2O Platforms Based on Cluster Analysis.Modern Business, (12), 32–34.
[10]. Jayasingh, S., & Eze, U. C. (2009). Exploring the Factors Affecting the Acceptance of Mobile Coupons in Malaysia. In Proceedings of the 2009 Eighth International Conference on Mobile Business (pp. 329–334). IEEE.
[11]. Yao, T. (2015). Research on Personalized Recommendation Based on Collaborative Filtering Algorithms (Master’s thesis). Beijing Institute of Technology.
[12]. Huang, W., Meng, X., & Wang, L. (2011). Collaborative Filtering Algorithm Based on User Social Relationship Mining in Mobile Communication Networks.Journal of Electronics & Information Technology, 33(12), 3002–3007.
[13]. Gao, M., Jin, C., Qian, W., Wang, X., & Zhou, A. (2014). Real-Time Personalized Recommendation for Microblogging Systems.Chinese Journal of Computers, 37(04), 963–975.
[14]. Wu, J., Zhang, Y., & Wang, J. (2018). Research on Usage Prediction Methods for O2O Coupons. In International Conference on Neural Information Processing (pp. 175–183). Springer, Cham.
[15]. Liu, X., & Li, F. (2016). Credit Risk Assessment of Online Lending under Big Data — A Case Study of Renrendai.Statistics & Information Forum, 31(05), 41–48.
[16]. Yue, H. (2014). Research on Marketing Prediction Models and Algorithms in Business Intelligence (Master’s thesis). Shenyang University of Technology.
[17]. Chen, T., & Guestrin, C. (2016). XGBoost: A Scalable Tree Boosting System. In Proceedings of the 22nd ACM SIGKDD International Conference on Knowledge Discovery and Data Mining (pp. 785–794). ACM.
[18]. Cai, W., Luo, Y., Zhang, G., & Zhong, H. (2017). Personal Credit Risk Assessment Model Based on the Integration of GBDT and Logistic Regression.Management Modernization, 37(02), 1–4.
[19]. Jia, W., Sun, L., & Jing, Y. (2018). Prediction of Postoperative Prognostic Scores for Femoral Neck Fracture Surgery Based on XGBoost Model.Journal of Taiyuan University of Technology, 49(01), 174–178.
[20]. Ye, Q., Rao, H., & Ji, M. (2017). Business Sales Forecasting Based on XGBoost.Journal of Nanchang University (Science Edition), 41(03), 275–281.
[21]. He, H., Huang, G., Zhang, B., et al. (2022). Anomaly Detection Model Based on Extreme Tree Recursive Feature Elimination and LightGBM. Information Network Security.
[22]. Zheng, G., & Chen, X. (2014). Dynamic Prediction of Intelligent Switch Operation Time Based on Sliding Window Method.Automation and Instrumentation, 29(8), 61–64.
[23]. Li, H., Lin, H., & Yang, L., et al. (2018). A Two-Level Fusion Algorithm Framework for User Profiling.Computer Science, 45(1), 157–161