


1. Introduction
Signal modulation is an inseparable and characteristic part in digital communication. While under different circumstances, modulation types can be varied and unique, it is of vital importance that one first correctly classifies the modulation type before demodulating and analysing the signal.
This paper presents comprehensive overview on modulation classification in the scope of common MPSKs (i.e., BPSK, QPSK and 8PSK). Classically, there are two main method branches in MC. One is based on the ML method, which the modulation type is set as unknown variable to be determined using spectral parameters. Sapiano and Martin proposed the method of using Average Likelihood Ratio Test (ALRT) in classification of PSK [1]. Hong and Ho proposed a method in classifying PSK using unbalanced factor and Generalized Likelihood Ratio Test (GLRT) [2]. Panagiotou etc. pushed the research even forward by presenting classification algorithms using Hybrid Likelihood Ratio Test (HLRT) [3], and found its performance could noticeably outstand the ALRT-based method in accuracy. While the ML method has advantage in comparing different classifiers and achieving the optimal more easily, it suffers from the high complexity for both the algorithm and the approximation.
The other method branch in MC is based on feature recognition. There are lots of characteristic features to consider, some such as time-domain parameters [4], spectral analysis [5], wavelet transform features [6] are commonly extracted for modulation classification of MPSK. Next, classifiers based on Decision Tree [7], Neural Networks (NN) [8] and Support Vector Machines (SVM) [9-11], are adopted in further recognition of the features extracted.
The organization of this paper will be as follows: Section 1 is a brief introduction followed by the PSK modulation analysis in Section 2. Section 3 and 4 will present current methods of PSK modulation classification from likelihood and feature aspects respectively. Conclusions are provided in Section 5.
2. Signal model of MPSK
For the modulation of MPSK (M = 2, 4, 8), baseband signals will modify the phase of the carrier wave, frequency and amplitude of the carrier wave will not be changed during transmission. The MPSK-modulated signal is depicted as:
\( {S_{MPSK}}= \sum _{n}g(t-nT)cos{(2π{f_{c}}t+ {φ_{n}})}\ \ \ (1) \)
In the above expression, \( n \) symbols are being transmitted, \( g(t) \) is the rectangular pulse function, \( T \) is the duration of each symbol, \( {f_{c}} \) is the frequency of the carrier wave. \( {φ_{n}} \) represents the phase of the carrier wave with the following correspondence:
\( {φ_{n}}= \frac{2π(n-1)}{M}, n=1, 2,…, M \ \ \ (2) \)
Another way of understanding the MPSK-modulation is through constellation maps as depicted in Figure 1, where each cluster of dots represents a specific phase.
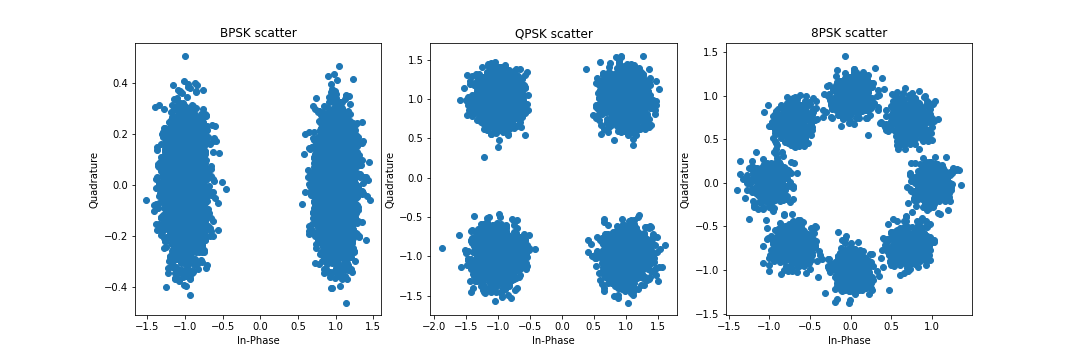
Figure 1. Scatter plots of MPSK-modulated signals at SNR = 15 dB.
3. Likelihood-based methods
1.1. ML classification
The ML ratio test is a multi-variable hypothesis testing process based on cost minimization. Let \( {λ_{i}}, i = 1, 2, …, I \) , denote the different modulation types to be classified, \( {α_{n}}, n=1, 2, …, N \) , denote different observations, then the ML function can be expressed as follows.
\( L({λ_{i}})= \prod _{n=1}^{N}p({α_{n}}|{λ_{i}})\ \ \ (3) \)
Taking the natural logarithm on both sides, the optimal modulation type will be classified through the following expression.
\( ln{(L({λ_{p}}))}≥ln{(L({λ_{q}}))}, p≠q and p, q ∈\lbrace 1, 2, …, I\rbrace \ \ \ (4) \)
A clear flow chart showing the above process is demonstrated in Figure 2. Observations \( {α_{n}} \) are derived based on the received signal, while the resulting optimal modulation type \( {λ_{p}} \) is recognized using argmax function.
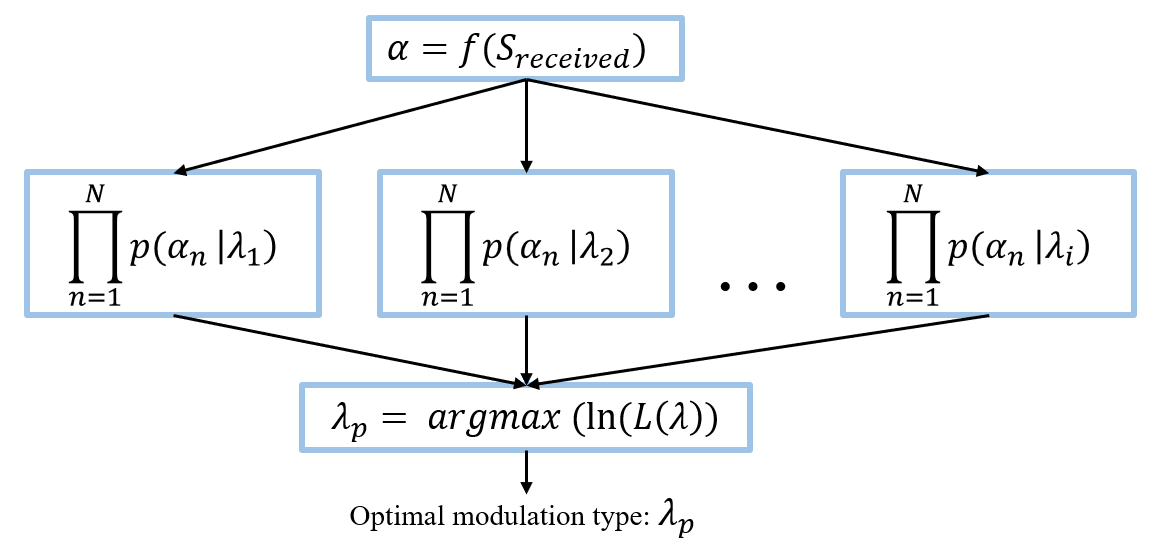
Figure 2. Flow chart of the ML ration test.
Assuming all signal and noise parameters are known, Wei and Mendel proposed a formula in assessing error probability for ML classifiers [12]. Conclusion is also drawn that ML classifier can have optimal performance with zero error when infinite symbols are available [12].
1.2. ALRT, GLRT and HLRT
In real life, however, under non-cooperative communications, signal parameters such as mean or probability density function are hardly known. When such parameters are treated as random variables, it is the ALRT. In the scope of PSK classification, ALRT is proven to have slight advantage over using DFT of phase histograms [1, 13]. When compared with quasi-Log-Likelihood Ratio (qLLR) [14] classifier, while the complexity of the two methods is close, ALRT also has slight advantage in error rate [1].
When the unresolved parameters are handled as unknown variables under maximum likelihood estimation, GLRT takes place [2]. In classifying BPSK and unbalanced QPSK, the unbalanced factor is taken into account with a maximum likelihood estimate, this attempt has great advantage over not considering the unbalanced factor at high SNR [2]. Comparing with ALRT, although GLRT need no pre-assumptions, it requires a maximum estimation procedure [3].
HLRT can be viewed as a hybrid of ALRT and GLRT. While one part of the unknown parameters is handled to be random, the rest are thought to be unknown [3]. For example, Panagiotou et al. proposed the Average Data Maximum Phase (ADMP) [3], and its performance is proven much better than the ALRT-based methods of qLLR [14].
4. Feature-based methods
1.3. Feature extracting
1.3.1. Signal parameter features. Traditional features include the instantaneous amplitude, phase and frequency in time-domain. Let \( \hat{s}(t) \) denote the Hilbert transformation of received signal \( s(t) \) . Then the instantaneous amplitude, phase and frequency are expressed in Equations (5), (6), (7) respectively.
\( A(t)= \sqrt[]{{s^{2}}(t)+\hat{{s^{2}}}(t)}\ \ \ (5) \)
\( φ(t)={tan^{-1}}{\frac{\hat{s}(t)}{s(t)}}\ \ \ (6) \)
\( f(t)= \frac{1}{2π}\frac{d}{dt}φ(t)\ \ \ (7) \)
A more generally adopted feature set nowadays is proposed by Bagga and Tripathi, using \( {γ_{max}} \) , \( {σ_{aa}} \) , \( {σ_{ap}} \) , \( {σ_{dp}} \) and \( {σ_{af}} \) [4]. Of the five features, \( {γ_{max}} \) can serve to differentiate PSK from FSK, while \( {σ_{aa}} \) can differentiate ASK from PSK [4]. \( {σ_{ap}} \) and \( {σ_{dp}} \) , which represent the absolute and direct instantaneous phases respectively, can be of crucial importance in classifying within the class of PSK since phase is the parameter being modified to different orders [4]. These features are easily extracted and are not based on prior assumption, however, they are easily distracted by noise and is dependent on the threshold of the later classifier, so to achieve acceptable error rate, high SNR environment is still preferred.
1.3.2. Spectral features. When applying non-linear transform to digital signals, different modulation types may result in differences of occurrences, positions and magnitudes of the spectrum. Square spectrum is the power spectrum after the original signal is squared. Strong spectrum is visible only to signals with \( π \) jumps in the carrier wave, such as BPSK signals [5]. This is similar with quartic spectrum, which represents the power spectrum to the power of four. The quartic spectrum can identify the QPSK, since there will be discrete spectrum at frequency zero [5]. To sum up, the classification of MPSK can be easily achieved by analyzing the square spectrum and quartic spectrum to see whether discrete spectrum near zero frequency exists. Though this method is convenient and less complex, there is still consideration on the threshold value in judging whether discrete spectrum exist near zero frequency.
1.3.3. Wavelet transform features. Wavelet transform is widely adopted in modulation classification due to its adaptability in providing a window that can be changed with frequency [6]. In the following, Haar wavelet transform will be adopted. For different types of modulations, different expressions are available using the magnitude of Haar continuous wavelet transform (CWT). An example expression of MPSK is provided below [6]:
\( {CWT_{MPSK}}(a, τ)=\frac{4\sqrt[]{S}}{j\sqrt[]{a}{ω_{c}}}{sin^{2}}({ω_{c}}\frac{a}{4}){e^{j({ω_{c}}τ+{θ_{c}}+{φ_{i}})}}\ \ \ (8) \)
In Equation 8, \( a \) is the scale, \( τ \) is the translation, S denotes power of the received signal, \( {ω_{c}} \) and \( {θ_{c}} \) denote parameters of the carrier. The amplitude value T1 and frequency value T2 can be extracted, with each being different for different modulation types, (e.g., T1 for MPSK is 1, T2 for MPSK is 1) [6]. With a specific threshold range, the modulation type can thus be classified. However, with this method, high SNR is still demanded while it is difficult to tell between different types of PSK, further improvements of classification within the PSK class can focus on the instantaneous phases and their differences [6].
1.3.4. Higher-order statistics (HOS). HOS is another method frequently used since it can reflect the constellation diagram distribution and it is resistant to noise [15]. HOS method extracts feature mainly through cumulant of the second or fourth order. HOS consists two parts, Higher-order Matrix (HOM) and Higher-order Cumulant (HOC). For the received signal, some commonly used formulas of HOC are as follows:
\( {C_{20}}={M_{20}}\ \ \ (9) \)
\( {C_{21}}= {M_{21}}\ \ \ (10) \)
\( {C_{40}}= {M_{42}}-3M_{20}^{2}\ \ \ (11) \)
\( {C_{42}}= {M_{42}}- M_{20}^{2}-2M_{21}^{2}\ \ \ (12) \)
The above HOCs can be calculated and represented as expressions of the signal energy E. As the parameters are different for BPSK, QPSK, and 8PSK, they can thus be classified. Swami developed a hierarchical classification scheme and adopted fourth order cumulants on a baseband with \( N \) samples, finding this method especially effective with complexity of \( O(N) \) [15].
1.4. Feature classification
1.4.1. Decision trees. A rather simple method in classifying different modulation types is through adopting decision trees. At each node, among all features extracted, only the feature maximizing information gain will be chosen as the attribute test [7]. Decision trees have low computing complexity, need relatively fewer data, and have good performance in accuracy. However, it may be highly dependent on the features and dataset, making it less stable. A possible solution may be using multiple decision trees together and forming a random forest.
1.4.2. NN. Neural networks mainly consist of three parts. Apart from the input and output layers, the most import component is the hidden layers, whose nodes each has their own computing expression with each term being the product of weight and input. Only when the node’s expression reaches a certain threshold will be activated and pass the value on to the next layer, and eventually to the output layer. The number of hidden layers and neurons within each layer greatly affects overall accuracy performance, which may result in overfitting. A special case when two or more hidden layer is the Deep Neural Network (DNN). Researches show that DNN networks own great flexibility in the detection of different modulation types and that it has accuracy advantage over traditional NN especially in Doppler fading channels [8].
1.4.3. SVM. The goal of SVM is to construct a hyperplane that can separate two groups of data with maximum geometric distance to each. Kernel tricks can also be adopted for non-separable data, making it a non-linear classifier. While SVMs were originally for binary classification, there are mainly two ways in multiple classification. The first solution is combining several binary SVM together, but unclassifiable region will arise due to discrete decision [9]. The second solution is multi-class support vector machines (MSVM) such as one-against-one and one-against-all methods [10]. Classifier models were also proposed in handling unclassifiable region combining theories with directed acyclic graphs, which not only gained advantage in accuracy but also retained a fast speed [11]. SVM have greater generality and can find the global extremes rather than the local extremes which shows its advantage over traditional NN.
5. Conclusion
This paper reviewed past development of modulation classification through both the likelihood-based method and feature-based method. According to the above research, in various ways can the signal features be constructed, but the final classifiers are still traditional techniques in Machine Learning. While in this area, the research of Decision Trees and NN started the earliest, currently advanced methods are mainly based on Deep Learning and SVM training. Both models are complex to train. SVM have better performance with little data and fewer modulation types, while Deep Learning and NN are more capable and preferred when abundant training data and various modulation types are present. Potential future research may lie in seeking a harmonic balance combing multiple classifiers so to have optimal performance at less cost.
References
[1]. Sapiano PC and Martin JD 1996 Maximum likelihood PSK classifier Proceedings of MILCOM '96 IEEE Military Communications Conference 3 1010-14
[2]. Ho KC and Hong L 2001 Likelihood Method for BPSK and Unbalanced QPSK Modulation Classification Proc. SPIE 4395 Digital Wireless Communication III 4395 155-162
[3]. Panagiotou P, Anastasopoulos A and Polydoros A likelihood ratio tests for modulation classification Proceedings. 21st Century Military Communications. Architectures and Technologies for Information Superiority 2 670-4
[4]. Bagga J and Tripathi N 2013 Automatic modulation classification using statistical features in fading environment International Journal of Advanced Research in Electrical, Electronics and Instrumentation Engineering 2 3701-9
[5]. Zhao L 2012 Automatic Recognition Based on Spectrum Feature for Common Used Modulations Journal of CAEIT 7 182-90
[6]. Tang W Research on modulation recognition of digital communication signals based on wavelet transform Xidian University 2010
[7]. Basumatary N, Sarma N and Nath B 2016 Signal type detection in CRN: A hierarchical modulation classification framework using SVM and Decision tree approaches 2016 ICADW 63-8
[8]. Kim B, Kim J, Chae H, Yoon D and Choi J 2016 Deep neural network-based automatic modulation classification technique 2016 ICTC 579-82
[9]. Tabatabaei TS, Krishnan S and Anpalagan A 2010 SVM-based classification of digital modulation signals 2010 IEEE International Conference on Systems, Man and Cybernetics 277-80
[10]. Vapnik VN 1999 An overview of statistical learning theory IEEE Transactions on Neural Networks 10 988-99
[11]. Kijsirikul B and Ussivakul N 2002 Multiclass support vector machines using adaptive directed acyclic graph Proceedings of the 2002 International Joint Conference on Neural Networks 1 980-5
[12]. Wei W and Mendel JM 1999 Maximum-likelihood classification for digital amplitude-phase modulations IEEE Transactions on Communications 48 189-93
[13]. Sapiano PC, Martin JD and Holbeche RJ 1995 Classification of PSK signals using the DFT of phase histogram International Conference on Acoustics, Speech, and Signal Processing 3 1868-71
[14]. Polydoros A and Kim K 1990 On the detection and classification of quadrature digital modulations in broad-band noise EEE Transactions on Communications 38 1199-211
[15]. Swami A and Sadler BM 2000 Hierarchical digital modulation classification using cumulants IEEE Transactions on Communications 48 416-429
Cite this article
Liang,Y. (2024). A comprehensive view into MPSK modulation classification. Applied and Computational Engineering,36,22-27.
Data availability
The datasets used and/or analyzed during the current study will be available from the authors upon reasonable request.
Disclaimer/Publisher's Note
The statements, opinions and data contained in all publications are solely those of the individual author(s) and contributor(s) and not of EWA Publishing and/or the editor(s). EWA Publishing and/or the editor(s) disclaim responsibility for any injury to people or property resulting from any ideas, methods, instructions or products referred to in the content.
About volume
Volume title: Proceedings of the 2023 International Conference on Machine Learning and Automation
© 2024 by the author(s). Licensee EWA Publishing, Oxford, UK. This article is an open access article distributed under the terms and
conditions of the Creative Commons Attribution (CC BY) license. Authors who
publish this series agree to the following terms:
1. Authors retain copyright and grant the series right of first publication with the work simultaneously licensed under a Creative Commons
Attribution License that allows others to share the work with an acknowledgment of the work's authorship and initial publication in this
series.
2. Authors are able to enter into separate, additional contractual arrangements for the non-exclusive distribution of the series's published
version of the work (e.g., post it to an institutional repository or publish it in a book), with an acknowledgment of its initial
publication in this series.
3. Authors are permitted and encouraged to post their work online (e.g., in institutional repositories or on their website) prior to and
during the submission process, as it can lead to productive exchanges, as well as earlier and greater citation of published work (See
Open access policy for details).
References
[1]. Sapiano PC and Martin JD 1996 Maximum likelihood PSK classifier Proceedings of MILCOM '96 IEEE Military Communications Conference 3 1010-14
[2]. Ho KC and Hong L 2001 Likelihood Method for BPSK and Unbalanced QPSK Modulation Classification Proc. SPIE 4395 Digital Wireless Communication III 4395 155-162
[3]. Panagiotou P, Anastasopoulos A and Polydoros A likelihood ratio tests for modulation classification Proceedings. 21st Century Military Communications. Architectures and Technologies for Information Superiority 2 670-4
[4]. Bagga J and Tripathi N 2013 Automatic modulation classification using statistical features in fading environment International Journal of Advanced Research in Electrical, Electronics and Instrumentation Engineering 2 3701-9
[5]. Zhao L 2012 Automatic Recognition Based on Spectrum Feature for Common Used Modulations Journal of CAEIT 7 182-90
[6]. Tang W Research on modulation recognition of digital communication signals based on wavelet transform Xidian University 2010
[7]. Basumatary N, Sarma N and Nath B 2016 Signal type detection in CRN: A hierarchical modulation classification framework using SVM and Decision tree approaches 2016 ICADW 63-8
[8]. Kim B, Kim J, Chae H, Yoon D and Choi J 2016 Deep neural network-based automatic modulation classification technique 2016 ICTC 579-82
[9]. Tabatabaei TS, Krishnan S and Anpalagan A 2010 SVM-based classification of digital modulation signals 2010 IEEE International Conference on Systems, Man and Cybernetics 277-80
[10]. Vapnik VN 1999 An overview of statistical learning theory IEEE Transactions on Neural Networks 10 988-99
[11]. Kijsirikul B and Ussivakul N 2002 Multiclass support vector machines using adaptive directed acyclic graph Proceedings of the 2002 International Joint Conference on Neural Networks 1 980-5
[12]. Wei W and Mendel JM 1999 Maximum-likelihood classification for digital amplitude-phase modulations IEEE Transactions on Communications 48 189-93
[13]. Sapiano PC, Martin JD and Holbeche RJ 1995 Classification of PSK signals using the DFT of phase histogram International Conference on Acoustics, Speech, and Signal Processing 3 1868-71
[14]. Polydoros A and Kim K 1990 On the detection and classification of quadrature digital modulations in broad-band noise EEE Transactions on Communications 38 1199-211
[15]. Swami A and Sadler BM 2000 Hierarchical digital modulation classification using cumulants IEEE Transactions on Communications 48 416-429