


1. Introduction
1.1. Background
COVID-19 is a disease that causes severe acute respiratory symptoms, which first emerged in Wuhan, China, at the end of 2019 [1] - [2]. From that point forward, travelers facilitated the transmission of the illness to virtually all nations globally, leading the WHO to announce it as a pandemic on March 22nd, 2020. The virus poses a significant risk due to its capability to incite severe symptoms such as respiratory distress, chest discomfort, speech impairment and breathing complications, which can even result in fatalities. Individuals possessing compromised immunity and the aged population are particularly susceptible to this viral contagion and its consequences. The virus propagates swiftly through direct human interaction and via respiratory particles produced during coughing or sneezing. Numerous research initiatives have been undertaken to combat COVID-19, yet a definitive cure still needs to be discovered.
Various studies have been carried out by both local and foreign researchers, including K-Means Clustering COVID- 19 Data [3], Hierarchical Clustering Analysis of COVID-19 Transmission in Wuhan, China[4], Identifying Links Between SARS-CoV-2 Transmission and Clustered Environments[5], Epithelial Cells lining Salivary Gland Ducts are Early Target Cells of Severe Acute Respiratory Syndrome Coronavirus Infection in The Upper Respiratory Tracts of Rhesus Macaques[6], Therapeutic and Triaging Strategies for 2019 Novel Coronavirus Disease in Fever Clinics[7]. This study distinctively utilizes three comparative methods - the K-Means, K-Medoids and K-Means++ algorithms - for clustering the spread of COVID-19 in China, differentiating it from the methodologies employed in prior research.
1.2. Materials and data
According to the data updated on the Netease News Epidemic Report [8] page as of December 28, 2022, the total number of confirmed cases worldwide is 624,398,550, and the death toll is 6,618,427, accounting for 10.6% of the confirmed cases. The total number of confirmed cases in China is 9,006,774, and the death toll is 31,509, accounting for 0.350% of the number of confirmed cases. The data from the Chinese Center for Disease Control and Prevention page[9] retrieved on October 31st, 2021, from 34 provinces, municipalities, and autonomous regions in China is chosen in this research, including confirmed and death cases. This research conducts a head-to-head comparison of three algorithms using a dataset to investigate grouping patterns and identify the most effective algorithms for data manipulation. The results of this study provide insights for future researchers on effectively utilizing cluster analysis to handle early-stage data of epidemic spread.
In this examination, we utilized MATLAB. Additionally, the Calinski-Harabasz index value was employed for reference in clustering. The resultant clustering pattern allowed for data analysis, transforming it into fresh information. This can assist those in decision-making roles (stakeholders) in curtailing the proliferation of the coronavirus and reducing the count of individuals confirmed as COVID-19 positive. Furthermore, this method may yield the optimal algorithm from the validity testing on K-Means, K-Medoids and K-Means++.
2. Method
Clustering analysis is a highly active research field in data mining, with numerous algorithms proposed. These algorithms can be categorized into partitioning algorithms, hierarchical, density-based , network-based, and model-based methods[10].
The method applied to analyze the spread of the coronavirus in China using K-Means, K-Medoids and K-Means++ algorithms, as portrayed in Figure 1, involves numerous steps during its execution.
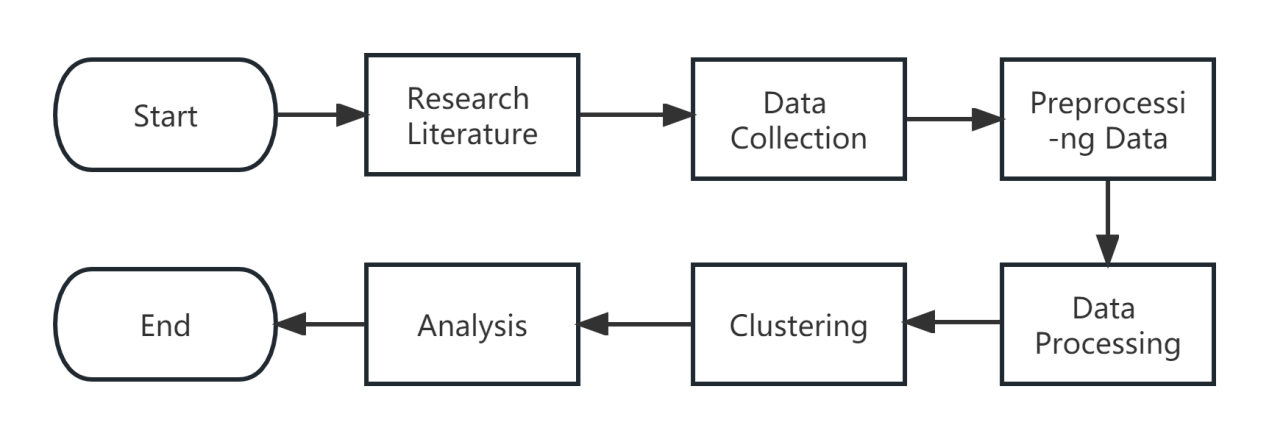
Figure 1. Research Methodology
2.1. Data mining
Data mining is extracting valuable patterns and knowledge from large datasets. As described by Witten and Frank [11], it involves various techniques such as clustering, classification, and association rule mining. These techniques are used to discover hidden patterns and relationships in the data, which can be used for decision-making and prediction. Data mining has applications in various fields like marketing, healthcare, and finance, where it helps identify trends, customer behavior, and fraud detection [11].
2.2. K-Means algorithm
The K-Means algorithm is a popular unsupervised machine learning method for clustering data. It aims to partition a given dataset into K distinct clusters, where each data point belongs to the cluster with the closest mean value. The algorithm iteratively updates the centroids of the clusters until convergence. According to Mitchell, T. M. (1997)[12], K-Means is based on minimising the within-cluster variance. On the other hand, Lloyd, S. P. (1982)[13] introduced the original algorithm that iteratively assigns data points to their closest cluster centroid.
The K-Means algorithm is a commonly used clustering technique. It aims to partition a dataset into K clusters, where each data point belongs to the cluster with the nearest mean. The algorithm follows a simple formula:
1. Initialize K cluster centroids randomly.
2. Assign each data point to the cluster with the closest centroid based on Euclidean distance.
3. Update the centroids by computing the mean of all data points in each cluster.
4. Repeat steps 2 and 3 until convergence when the cluster assignments no longer change significantly.
The K-Means algorithm process is shown in the Figure 2.
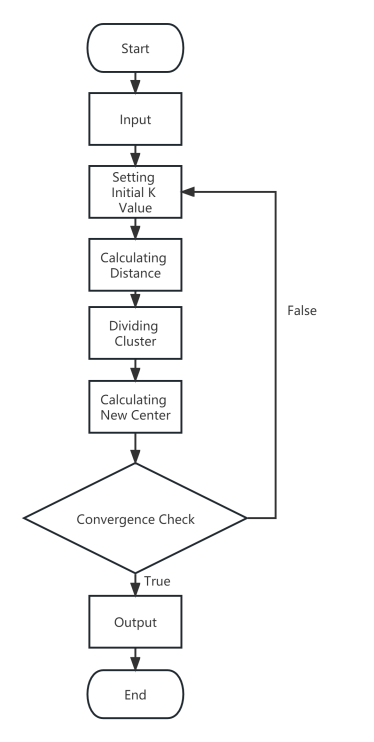
Figure 2. K-Means Algorithm Process
2.3. K-Medoids algorithm
The K-Medoids algorithm is a popular data mining and pattern recognition clustering technique. It is a variation of the K-Means algorithm that uses medoids (representative objects) instead of means to determine the cluster centroids. According to [14], the K-Medoids algorithm was first introduced by Kaufman and Rousseeuw in 1987. They proposed a method to find robust medoids, data points that minimize the sum of dissimilarities within a cluster. The algorithm iteratively replaces a medoid with a non-medoid point in order to reduce the total dissimilarity in the cluster. In a more recent study by Park et al. [15], an improved version of the K-Medoids algorithm was proposed, known as the Partitioning Around Medoids (PAM) algorithm. This variant utilizes a more efficient pairwise update approach, which reduces the computational complexity while maintaining the accuracy of the clustering results.
The K-Medoids algorithm is a clustering technique that aims to partition a given dataset into k clusters. Unlike the K-Means algorithm, which uses the mean of a cluster as its centroid, the K-Medoids algorithm employs the medoid. The medoid is the data point that minimizes the sum of distances to all other points within the cluster. By iteratively updating the medoids and reassigning data points to clusters, the algorithm converges to a solution that optimizes the overall clustering objective.
Overall, the K-Medoids algorithm and its variants have been widely applied in various fields such as image analysis, bioinformatics, and recommendation systems due to their ability to handle non-numeric data and outliers effectively.
2.4. K-Means++ algorithm
The K-Means++ algorithm is an improved version of the K-Means clustering algorithm, widely used in data mining and machine learning. It was introduced by David Arthur and Sergei Vassilvitskii in their research paper titled "K-Means++: The Advantages of Careful Seeding"[16], published in 2007. The algorithm addresses the issue of initialization bias in the original K-Means algorithm by introducing a more thoughtful and deliberate method to select initial cluster centroids. According to the paper, the algorithm improves the convergence speed and achieves better clustering results. Another critical research paper that references the K-Means++ algorithm is "Scalable K-Means++" by Bahman Bahmani, Benjamin Moseley, Andrea Vattani, Ravi Kumar, and Sergei Vassilvitskii[17] published in 2012. This paper explores scalable implementations of the K-Means++ algorithm, making it applicable to large-scale datasets and improving efficiency.
The algorithm consists of the following steps:
1. Randomly select the first centroid from the given data points.
2. For each remaining data point, calculate the shortest distance (D) to the nearest centroid from the current set of centroids.
3. Choose a new centroid with a probability proportional to D^2.
4. Repeat steps 2 and 3 until k centroids are selected.
5. Perform the standard K-Means algorithm using the initialized centroids.
2.5. Calinski-Harabasz index
Calinski-Harabasz is a popular index used for evaluating the quality and effectiveness of clustering algorithms. It measures the degree of separation between different clusters and the compactness within each cluster. The index is calculated by taking the between-cluster dispersion to within-cluster dispersion ratio.
In a study by Calinski and Harabasz (1974)[18], they introduced this index as an alternative to other clustering validity indices. They highlighted that the strength of Calinski-Harabasz lies in its ability to handle datasets with varying cluster sizes and densities. Another research conducted by Nguyen et al. (2017)[19] demonstrated the usefulness of Calinski-Harabasz in the field of image segmentation. By applying this index to evaluate different clustering algorithms, they were able to identify the most effective one for accurately segmenting images.
3. Data processing and analysis
3.1. Steps in data pre-processing
This study utilized data obtained from the Chinese Center for Disease Control and Prevention page on October 31, 2021. The data set includes confirmed and fatal cases across 34 provinces, municipalities, and autonomous regions in China.Then the data pre-processing stage is carried out before running the clustering process of some of the attributes used. The data is shown in Table 1.
Table 1. Dataset for the spread of COVID-19 in China
Region | Cumulative Infection | Cumulative Death | Population (Ten Thousand) | Millions of People Infected | Million Deaths | Infection Lethality |
Hong Kong | 12346 | 213 | 743 | 1661.64 | 28.668 | 1.73% |
Hubei Province | 68309 | 4512 | 5902 | 1157.39 | 76.449 | 6.61% |
Taiwan Province | 16412 | 847 | 2369 | 692.78 | 35.753 | 5.16% |
Aomen | 77 | 0 | 63 | 122.22 | 0.000 | 0.00% |
Shanghai | 2726 | 7 | 2418 | 112.74 | 0.289 | 0.26% |
Beijing | 1162 | 9 | 2171 | 53.52 | 0.415 | 0.77% |
Heilongjiang Province | 1768 | 13 | 3789 | 46.66 | 0.343 | 0.74% |
Xinjiang Province | 981 | 3 | 2445 | 40.12 | 0.123 | 0.31% |
Fujian Province | 1303 | 1 | 3911 | 33.32 | 0.026 | 0.08% |
Yunnan Province | 1563 | 2 | 4801 | 32.56 | 0.042 | 0.13% |
Tianjin | 504 | 3 | 1557 | 32.37 | 0.193 | 0.60% |
Guangdong Province | 3224 | 8 | 11169 | 28.87 | 0.072 | 0.25% |
Zhejiang Province | 1484 | 1 | 5657 | 26.23 | 0.018 | 0.07% |
Nei Monggol province | 594 | 1 | 2529 | 23.49 | 0.040 | 0.17% |
Jilin Province | 577 | 3 | 2717 | 21.24 | 0.110 | 0.52% |
Hainan Province | 190 | 6 | 926 | 20.52 | 0.648 | 3.16% |
Jiangxi Province | 939 | 1 | 4622 | 20.32 | 0.022 | 0.11% |
Jiangsu Province | 1600 | 0 | 8029 | 19.93 | 0.000 | 0.00% |
Chongqing | 604 | 6 | 3048 | 19.82 | 0.197 | 0.99% |
Shaanxi Province | 697 | 3 | 3835 | 18.17 | 0.078 | 0.43% |
Hebei Province | 1323 | 7 | 7520 | 17.59 | 0.093 | 0.53% |
Hunan Province | 1197 | 4 | 6860 | 17.45 | 0.058 | 0.33% |
Henan Province | 1559 | 22 | 9559 | 16.31 | 0.230 | 1.41% |
Anhui Province | 1008 | 6 | 6255 | 16.12 | 0.096 | 0.60% |
Ningxia Province | 107 | 0 | 682 | 15.69 | 0.000 | 0.00% |
Sichuan Province | 1222 | 3 | 8302 | 14.72 | 0.036 | 0.25% |
Gansu Province | 295 | 2 | 2626 | 11.23 | 0.076 | 0.68% |
Liaoning Province | 466 | 2 | 4369 | 10.67 | 0.046 | 0.43% |
Shandong Province | 978 | 7 | 10006 | 9.77 | 0.070 | 0.72% |
Shanxi Province | 260 | 0 | 3702 | 7.02 | 0.000 | 0.00% |
Guangxi Province | 338 | 2 | 4885 | 6.92 | 0.041 | 0.59% |
Guizhou Province | 158 | 2 | 3580 | 4.41 | 0.056 | 1.27% |
Qinghai Province | 22 | 0 | 598 | 3.68 | 0.000 | 0.00% |
Xizang Province | 1 | 0 | 337 | 0.30 | 0.000 | 0.00% |
3.2. Steps of data processing
The purpose of this research is to compare which algorithms are best among K-Means, K-Medoids and K-Means++ in clustering data on the spread of the COVID-19 disease in China in clusters 1 to cluster 10. There is the clustering process using these three algorithms, which in the next stage of this research is to determine the best number of clusters with MATLAB as presented on the Calinski-Harabasz index. This processing can be done to find the Calinski-Harabasz index value of each algorithm in each group. Then the test process is carried out from clusters k = 2 to k = 10. To mitigate the error caused by randomness, this study relies on repeated runs and statistical analysis. Each run records the optimal clustering result and its corresponding evaluation metric, and then the average is taken as the final evaluation metric. Generally, this approach yields more stable results and better reflects the true performance of the algorithm. Furthermore, the results of the Calinski-Harabasz index comparison can be shown in Figure 3.
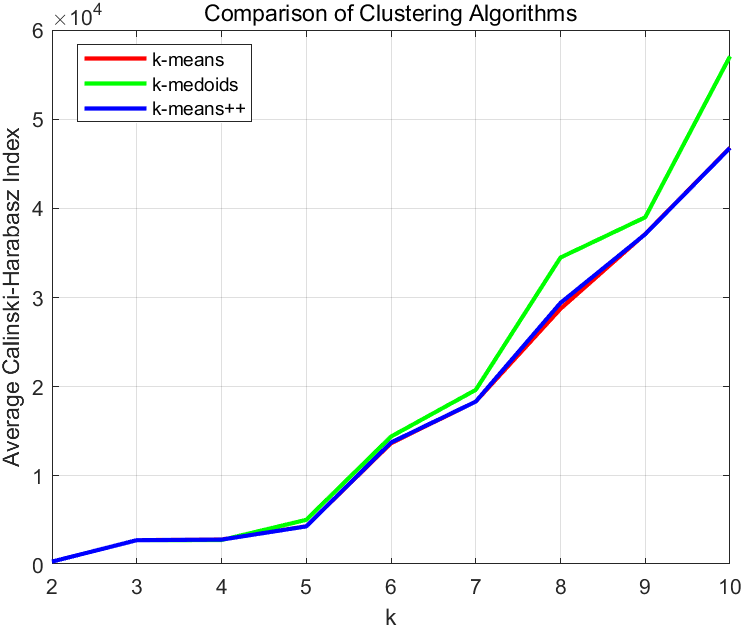
Figure 3. Comparison of K-Means, K-Medoids and K-Means++ algorithm
Furthermore, it can be seen that the test results in each cluster using K-Means, K-Medoids and K-Means++ algorithm methods can be seen in Table 2.
Table 2. Results of the Calinski-Harabasz index comparison
K | K-Means | K-Medoids | K-Means++ |
2 | 0.03775 | 0.03775 | 0.03775 |
3 | 0.27823 | 0.27823 | 0.27823 |
4 | 0.28533 | 0.27841 | 0.28452 |
5 | 0.40452 | 0.506504 | 0.43211 |
6 | 1.36308 | 1.44018 | 1.37944 |
7 | 1.83770 | 1.96425 | 1.84381 |
8 | 2.92399 | 3.45595 | 2.94865 |
9 | 3.73776 | 3.90274 | 3.71083 |
10 | 4.73572 | 5.74596 | 4.72021 |
3.3. Analysis
After previously making comparisons through the Calinski-Harabasz index using the K-Means, K-Medoids and K-Means++ algorithm methods, We can clearly see that when the value of K does not exceed 6, the clustering results of the three algorithms are not significantly different. Therefore, it can be concluded that they have similar capabilities in processing data from the initial stage of the COVID-19 outbreak in China. However, as the value of K increases, the superiority of the K-Medoids algorithm becomes evident. It can be considered that the K-Medoids algorithm is superior to K-Means and K-Means++ when K is large. Similarly, to reduce the error caused by randomness, the statistical average of multiple runs is still taken as the conclusion. Based on the analysis results, the best cluster then interprets the data clustering of the spread of COVID-19, and the results can be obtained in Table 3.
Table 3. The best cluster results based on K-Medoids algorithm
Cluster | Number | Region |
1 | 0 | |
2 | 1 | Hubei Province |
3 | 0 | |
4 | 2 | Hong Kong, Taiwan Province |
5 | 0 | |
6 | 22 | Aomen,Shanghai, Heilongjiang Province, Yunnan Province, Tianjin, Guangdong Province, Zhejiang Province, Nei Monggol province, Jilin Province, Hainan Province, Jiangsu Province, Chongqing, Shaanxi Province, Henan Province, Ningxia Province, Gansu Province,Liaoning Province, Shanxi Province, Guangxi Province, Guizhou Province, Qinghai Province, Xizang Province |
7 | 9 | Beijing, Xinjiang Province, Fujian Province, Jiangxi Province, Hebei Province, Hunan Province, Anhui Province, Sichuan Province, Shandong Province |
8 | 0 | |
9 | 0 | |
10 | 0 |
4. Conclusion and Discussion
In conclusion, the K-Means, K-Medoids, and K-Means++ algorithms have emerged as important clustering algorithms in data mining and have proven to be valuable tools in solving practical problems. This study focused on the initial stage of the COVID-19 outbreak in 34 provinces, autonomous regions, and municipalities in China, and compared the performance of these algorithms in clustering analysis. The analysis results indicated that these three algorithms produced similar clustering results when the value of K is not large. However, when K becomes large, the K-Medoids algorithm outperformed the other two algorithms by yielding more effective clustering. This finding implies that the K-Medoids algorithm is well-suited for large-scale data analysis, particularly in situations where the number of clusters needs to be relatively high.
The significance of this conclusion lies in its potential contribution to future researchers who may be analyzing similar data. By identifying the most effective algorithm for clustering analysis during the initial stage of the COVID-19 outbreak, researchers can adopt the K-Medoids algorithm to obtain more accurate and meaningful insights. This can lead to better decision-making and resource allocation in managing the pandemic.
However, it is important to acknowledge the limitations of this study. Firstly, the analysis was restricted to the number of confirmed cases and deaths, which may not capture the full complexity of the COVID-19 outbreak. Future research should consider incorporating additional variables, such as demographic factors, economic indicators, and healthcare infrastructure, to gain a more comprehensive understanding of the outbreak. Secondly, this study focused solely on the initial stage of the COVID-19 outbreak in China. The findings may not be directly applicable to other countries or different stages of the pandemic. Therefore, it is crucial for future research to replicate and expand upon this study in diverse contexts to validate the generalizability of the conclusions. Thirdly, while the three algorithms were evaluated based on their clustering performance, there are other aspects that could be considered for comparison, such as computational efficiency and scalability. Future studies could explore these dimensions to provide a more comprehensive assessment of the algorithms. In light of these limitations, future research should aim to address these gaps and address the broader implications of clustering analysis in understanding and managing public health crises like COVID-19. By incorporating a wider range of variables, examining different stages of the outbreak, and evaluating various aspects of the algorithms, researchers can strengthen the knowledge base and provide more robust insights for decision-makers. Hopefully, in future research, we can focus on solving the above problems.
To summarize the above, the K-Means, K-Medoids, and K-Means++ algorithms have demonstrated their significance in clustering analysis during the initial stage of the COVID-19 outbreak. The K-Medoids algorithm has shown superior performance when the number of clusters is large. However, further research is needed to overcome the limitations of this study and explore the broader implications of clustering analysis in public health crises. This study serves as a foundation for future researchers and highlights the potential for using clustering algorithms to inform decision-making and resource allocation in managing pandemics.
References
[1]. M. A. Shereen, S. Khan, A. Kazmi, NBashir, and R. Siddique, COVID- 19 infection: Origin, transmission, and characteristics of human coronaviruses, Journal of Advanced Research 24 (2020) 91–98.
[2]. N.Dwitri dkk, Penerapan Algoritma K-Means dalam Menentukan Tingkat Penyebaran Pandemi Covid- 19 di Indonesia, Jurnal Teknologi Informasi, Vol. 4, No. 1, Juni 2020.
[3]. R.A. Indraputra , R. Fitriana, K-Means Clustering Data COVID- 19, Jurnal Teknik Industri, Volume 10 No.3.Desember 2020.
[4]. Gao, S., Rao, J., Kang, Y., Liang, Y., & Kruse, J. (2020). Hierarchical Clustering Analysis of COVID-19 Transmission in Wuhan, China. Journal of Medical Virology, 92(9), 1887-1895.
[5]. Sun, Y., Li, Y., Bao, Y., Meng, S., Sun, Y., Schumann-Bischoff, J.,... & Luan, H. (2020). Identifying Links Between SARS-CoV-2 Transmission and Clustered Environments. Journal of Travel Medicine, 27(5), taaa099.
[6]. Liu, L., Wei, Q., Alvarez, X., Wang, H., Du, Y., Zhu, H.,... & Chen, Z. (2020). Epithelial Cells lining Salivary Gland Ducts are Early Target Cells of Severe Acute Respiratory Syndrome Coronavirus Infection in The Upper Respiratory Tracts of Rhesus Macaques. Journal of Virology, 84(15), 765-771.
[7]. Zhang, J., Zhou, L., Yang, Y., Peng, W., Wang, W., Chen, X.,... & Liu, Z. (2020). Therapeutic and Triaging Strategies for 2019 Novel Coronavirus Disease in Fever Clinics. The Lancet Respiratory Medicine, 8(3), e11-e12.
[8]. NetEase. (n.d.). Virus Report. Retrieved from https://wp.m.163.com/163/page/news/virus_report/index.html.
[9]. China Centers for Disease Control and Prevention. (n.d.). Health and Wellness. Retrieved from https://m.chinacdc.cn/xwzx/zxyw/.
[10]. Li Cuixia, Yu Jian. A study on classification of fuzzy clustering algorithm [J]. Journal of Beijing Jiaotong University: Natural Science Edition, 2005, 29(2): 17-21.
[11]. Witten, I. H., & Frank, E. (2005). An Introduction to Data Mining.
[12]. Mitchell, T. M. (1997). Machine Learning. McGraw Hill.
[13]. Lloyd, S. P. (1982). Least squares quantization in PCM. IEEE Transactions on Information Theory, 28(2), 129-137.
[14]. Kaufman, L., & Rousseeuw, P. J. (1987). Clustering by means of medoids. Statistical Data Analysis Based on the L1-Norm and Related Methods, 405-416.
[15]. Park, H. S., Jun, C. H., & Park, H. H. (2009). A partitioning around medoids-based clustering algorithm for large-scale data sets. Data Mining and Knowledge Discovery, 18(3), 359-390.
[16]. Arthur,D.,&Vassilvitskii,S. (2007). K-Means++: The advantages of careful seeding. Proceedings of the Eighteenth Annual ACM-SIAM Symposium on Discrete Algorithms.
[17]. Bahmani,B.,Moseley, B.,Vattani, A., Kumar, R., & Vassilvitskii, S. (2012). Scalable K-Means++. Proceedings of the VLDB Endowment, 5(7), 622-633.
[18]. Calinski, T., & Harabasz, J. (1974). A dendrite method for cluster analysis. Communications in Statistics, 3(1), 1-27.
[19]. Nguyen,T.X.,Vo, B.,& Cao, H. (2017). An efficient clustering algorithm for image segmentation. International Journal of Computer Vision, 123(2), 312-328.
Cite this article
Hu,Z. (2024). Comparison of K-Means, K-Medoids and K-Means++ algorithms based on the Calinski-Harabasz index for COVID-19 epidemic in China. Applied and Computational Engineering,49,11-20.
Data availability
The datasets used and/or analyzed during the current study will be available from the authors upon reasonable request.
Disclaimer/Publisher's Note
The statements, opinions and data contained in all publications are solely those of the individual author(s) and contributor(s) and not of EWA Publishing and/or the editor(s). EWA Publishing and/or the editor(s) disclaim responsibility for any injury to people or property resulting from any ideas, methods, instructions or products referred to in the content.
About volume
Volume title: Proceedings of the 4th International Conference on Signal Processing and Machine Learning
© 2024 by the author(s). Licensee EWA Publishing, Oxford, UK. This article is an open access article distributed under the terms and
conditions of the Creative Commons Attribution (CC BY) license. Authors who
publish this series agree to the following terms:
1. Authors retain copyright and grant the series right of first publication with the work simultaneously licensed under a Creative Commons
Attribution License that allows others to share the work with an acknowledgment of the work's authorship and initial publication in this
series.
2. Authors are able to enter into separate, additional contractual arrangements for the non-exclusive distribution of the series's published
version of the work (e.g., post it to an institutional repository or publish it in a book), with an acknowledgment of its initial
publication in this series.
3. Authors are permitted and encouraged to post their work online (e.g., in institutional repositories or on their website) prior to and
during the submission process, as it can lead to productive exchanges, as well as earlier and greater citation of published work (See
Open access policy for details).
References
[1]. M. A. Shereen, S. Khan, A. Kazmi, NBashir, and R. Siddique, COVID- 19 infection: Origin, transmission, and characteristics of human coronaviruses, Journal of Advanced Research 24 (2020) 91–98.
[2]. N.Dwitri dkk, Penerapan Algoritma K-Means dalam Menentukan Tingkat Penyebaran Pandemi Covid- 19 di Indonesia, Jurnal Teknologi Informasi, Vol. 4, No. 1, Juni 2020.
[3]. R.A. Indraputra , R. Fitriana, K-Means Clustering Data COVID- 19, Jurnal Teknik Industri, Volume 10 No.3.Desember 2020.
[4]. Gao, S., Rao, J., Kang, Y., Liang, Y., & Kruse, J. (2020). Hierarchical Clustering Analysis of COVID-19 Transmission in Wuhan, China. Journal of Medical Virology, 92(9), 1887-1895.
[5]. Sun, Y., Li, Y., Bao, Y., Meng, S., Sun, Y., Schumann-Bischoff, J.,... & Luan, H. (2020). Identifying Links Between SARS-CoV-2 Transmission and Clustered Environments. Journal of Travel Medicine, 27(5), taaa099.
[6]. Liu, L., Wei, Q., Alvarez, X., Wang, H., Du, Y., Zhu, H.,... & Chen, Z. (2020). Epithelial Cells lining Salivary Gland Ducts are Early Target Cells of Severe Acute Respiratory Syndrome Coronavirus Infection in The Upper Respiratory Tracts of Rhesus Macaques. Journal of Virology, 84(15), 765-771.
[7]. Zhang, J., Zhou, L., Yang, Y., Peng, W., Wang, W., Chen, X.,... & Liu, Z. (2020). Therapeutic and Triaging Strategies for 2019 Novel Coronavirus Disease in Fever Clinics. The Lancet Respiratory Medicine, 8(3), e11-e12.
[8]. NetEase. (n.d.). Virus Report. Retrieved from https://wp.m.163.com/163/page/news/virus_report/index.html.
[9]. China Centers for Disease Control and Prevention. (n.d.). Health and Wellness. Retrieved from https://m.chinacdc.cn/xwzx/zxyw/.
[10]. Li Cuixia, Yu Jian. A study on classification of fuzzy clustering algorithm [J]. Journal of Beijing Jiaotong University: Natural Science Edition, 2005, 29(2): 17-21.
[11]. Witten, I. H., & Frank, E. (2005). An Introduction to Data Mining.
[12]. Mitchell, T. M. (1997). Machine Learning. McGraw Hill.
[13]. Lloyd, S. P. (1982). Least squares quantization in PCM. IEEE Transactions on Information Theory, 28(2), 129-137.
[14]. Kaufman, L., & Rousseeuw, P. J. (1987). Clustering by means of medoids. Statistical Data Analysis Based on the L1-Norm and Related Methods, 405-416.
[15]. Park, H. S., Jun, C. H., & Park, H. H. (2009). A partitioning around medoids-based clustering algorithm for large-scale data sets. Data Mining and Knowledge Discovery, 18(3), 359-390.
[16]. Arthur,D.,&Vassilvitskii,S. (2007). K-Means++: The advantages of careful seeding. Proceedings of the Eighteenth Annual ACM-SIAM Symposium on Discrete Algorithms.
[17]. Bahmani,B.,Moseley, B.,Vattani, A., Kumar, R., & Vassilvitskii, S. (2012). Scalable K-Means++. Proceedings of the VLDB Endowment, 5(7), 622-633.
[18]. Calinski, T., & Harabasz, J. (1974). A dendrite method for cluster analysis. Communications in Statistics, 3(1), 1-27.
[19]. Nguyen,T.X.,Vo, B.,& Cao, H. (2017). An efficient clustering algorithm for image segmentation. International Journal of Computer Vision, 123(2), 312-328.