


1. Introduction
In the present digital era, QR codes have become an indispensable component of individuals’ lives, serving as a bridge that connects the physical world with the digital realm. These two-dimensional matrix barcodes store information that can be easily scanned and decoded by smartphones and other devices. QR codes find extensive applications across various domains, ranging from marketing and advertising to supply chain management and contactless payment systems [1,2]. In this situation, enhancing the resolution of QR codes plays a crucial role in ensuring clarity and accuracy during the scanning process. At lower resolutions, QR codes may be susceptible to confusion artifacts and the loss of vital details, resulting in misinterpretation of information or even decoding failures. This limitation is particularly pronounced when QR codes are embedded in printed materials, packaging, or advertisements, as spatial constraints may lead to the generation of low-resolution QR codes, which deserves more attention.
Several researches have been conducted on enhancing the resolution of QR code, with the objective of improving QR code legibility and ensuring reliable information transmission. Existing QR code enhancement research has primarily focused on traditional image processing methods, such as interpolation [3] and reconstruction [4] techniques, owing to their computational simplicity and speed, making them widely adopted. However, these methods fall short in adapting to diverse image content, exhibit limited perceptual capabilities, struggle to reconstruct high-frequency information within images, result in excessively blurry output images, and may amplify artifacts when applied to compressed images. Due to deep learning's successful application in computer vision, deep neural networks have recently attracted a lot of attention. Their influence has also been extended to the field of picture super resolution. Through the employment of convolution neural networks for image super-resolution, a substantial enhancement in its quality has been achieved. A method based on Super-Resolution Convolutional Neural Network (SRCNN) was first proposed by Dong et al. in 2016 [5]. It nonlinearly maps picture features from the space of low-resolution to high-resolution using three convolutional layers, and the results are superior to those of other traditional techniques [6, 7]. However, CNN-based solutions also present various challenges, such as high computational and data requirements. These can sometimes result in the blurring or lack of clarity at the edges of generated images, especially when dealing with small targets or fine details.
With the proposal of Generative Adversarial Network (GAN) [8], the exploration of employing generative adversarial networks for diverse computer vision tasks has gained traction. In 2017, Ledig et al. [9] first introduced Generative Adversarial Networks for image super-resolution reconstruction, known as Super-Resolution Generative Adversarial Networks (SRGAN), which improved the output photographs' visual quality. While QR code technology has made significant advancements, research on using SRGANs to enhance QR code resolution is relatively new and unexplored. SRGANs harness the power of deep learning to generate high-resolution images from their low-resolution counterparts. it can create images that are not only sharper but also retain essential structural elements.
This study's main goal is to determine whether utilising SRGANs to improve QR code resolution is effective. By training the SRGAN model on a carefully selected set of low-resolution and high-resolution QR code images, this study aims to demonstrate its capability to generate high-quality QR codes that retain their structural integrity and improve clarity.
2. Methods
2.1. Dataset description and preprocessing
This study utilised the QR code dataset from Kaggle [10]. The original dataset comprises 10,000 high-resolution images in PNG format. These images come in four different sizes: 290×290, 330×330, 370×370, and 410×410 pixels.
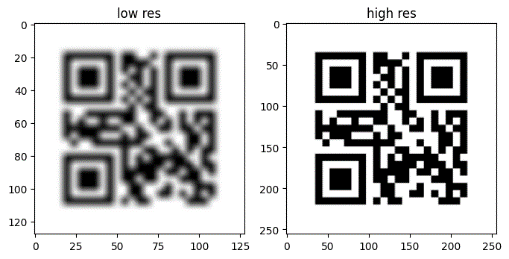
The preprocessing consisted of two main steps. To begin, the high-resolution images within the dataset underwent batch processing and resizing to ensure uniform target width and height. This study employed the Python Pillow library for the manipulation of image files. All high-resolution images were resized to 256×256 pixels while maintaining their high resolution. This uniform sizing was necessary for the subsequent model training, ensuring that the model could handle similar-sized data consistently without errors or instability, thus enhancing efficiency during training and processing. Secondly, low-resolution images were generated correspondingly. A blur filter, specifically a box blur with a blur radius of 5 pixels, was applied. The box blur averages the pixel values around each pixel to reduce the image's resolution. As a result, the dataset now contains two folders: "High_res," which includes 10,000 images with dimensions of 256×256 pixels in high resolution, and "Low_res," which contains 10,000 images with dimensions of 256×256 pixels in low resolution. Each image in these two folders corresponds one-to-one as shown in Figure 1.
|
Figure 1. The sample images of the collected dataset. |
2.2. SRGAN model
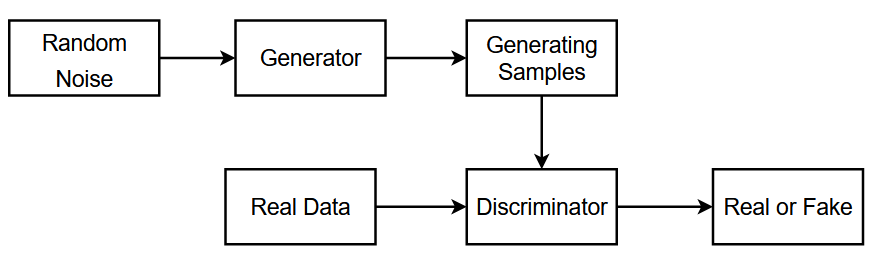
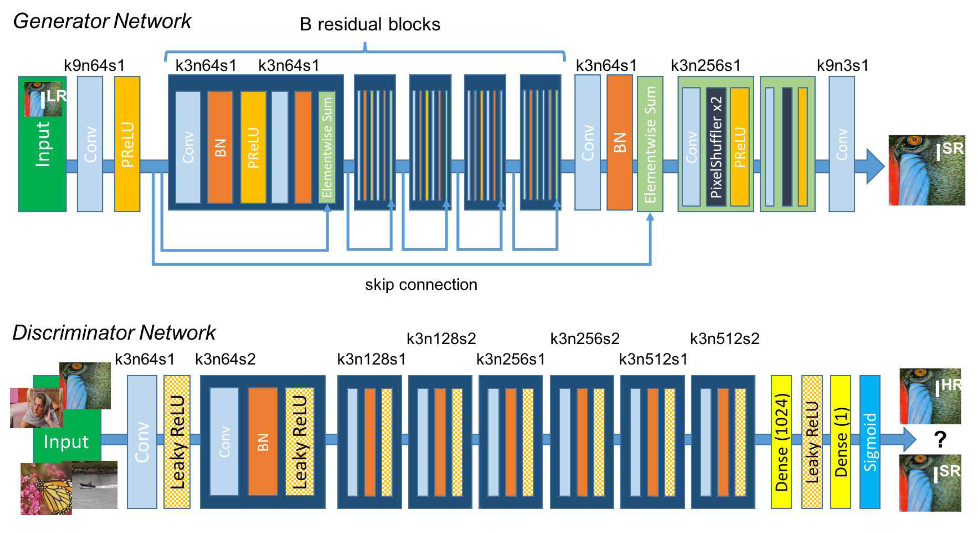
In 2014, the concept of GAN was introduced by Ian Goodfellow [8], which illustrated in Figure 2, is an original adversarial process in which two neural networks fight with one another. Building upon this, in 2017, Ledig et al. [9] proposed the SRGAN (Figure 3).
| |
Figure 2. The structure diagram of GAN. | |
|
Figure 3. Architecture of Generator and Discriminator Networks, with appropriate information for each convolutional layer on the kernel size (k), number of feature mappings (n), and stride (s) [9]. |
SRGAN represents a class of deep-learning models aimed at enhancing image resolution. It makes use of GAN's power to transform the inputs with low resolution into high quality outputs. The fundamental idea is to create a generator capable of transforming low-resolution images into visually appealing and detailed high-resolution versions. The key concept of this approach is to train a generator model (G) to generate images that can deceive a discriminator (D). As an input to the network D, the network G extracts the random noise distribution of the real data and creates a sample that is representative of the real data. The discriminator, represented by the letter D, performs as a binary classifier tasked with differentiating between actual data and artificial data produced by the generator network. Its main goal is to determine whether the input is a real sample or a machine-generated sample. The discriminator network improves its ability to determine the validity of the samples while the generator network continually improves its ability to make lifelike samples to confuse the discriminator. The training of the GAN is a process of a min-max game, where the optimization goal is to reach a Nash equilibrium. By using this method, the generator tends to produce images that closely resemble the real ones, making it difficult for the discriminator to make an accurate classification [9,11]. Equation (1) depicts the antagonistic relationship between the generator and discriminator:
\( \underset{G}{min}{\underset{D}{max}{V(D,G)=}}{E_{x~{P_{data}}(x)}}[log{D(x)]}+{E_{Z~{P_{z}}(z)}}[log(1-{D(G(x)))]} \) (1)
In the equations provided, The objective function improved by a GAN is represented by V(D,G), E(x) stands for mathematical expectation, G(z) for the data that was reconstructed image, D(x) for the probability assigned by the discriminator to assess whether real data is genuine, and z for the random noise signal. D(G(z)) stands for the probability assigned by the discriminator to assess whether the rebuilt image data is real. lnD(x) indicates the discriminator's assessment of real image data, while ln(1-D(G(z))) signifies its assessment of the reconstructed image data. Equation (2) depicts the discriminator component in the following way:
\( \underset{D}{max}V(D,G)={E_{x~{P_{data}}(x)}}[log{D}(x)]+{E_{z~{P_{z}}(z)}}[log(1-{D}(G(z)))] \) (2)
In this context, with the generator held constant, for real samples x, which correspond to the first term of the equation, this study aims for a higher value of D(x) because a result closer to 1 is desirable for real samples. Conversely, for fake samples, this study aspires for a lower value of D(G(z)), which means that a higher result for 1 - D(G(z)) is preferable. In Equation (3), the generator component is depicted as follows:
\( \underset{G}{min}{V(D,G)=}{E_{z~{P_{z}}(z)}}[log{(1-D(G(z)))]} \) (3)
When doing optimisation, given the absence of real samples, this study aims for a label of 1 for fake samples. Consequently, a higher value for D(G(z)) is desired, which means that a lower result for 1 - D(G(z)) is preferred.
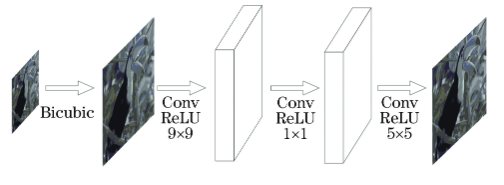
Bicubic interpolation is used by the SRCNN [5] algorithm to upscale low-resolution images to the required size. Producing the output requires feature extraction, the next step is nonlinear mapping, and finally reconstruction. Figure 4 depicts the SRCNN's structural layout.
|
Figure 4. The diagram of SRCNN structure [6]. |
2.3. Loss Function
Measurement of the pixel-level discrepancies between the goal image and the produced image is done using the Mean Squared Error (MSE) loss. It calculates the squared differences between the target image's and the generated image's pixel values, then takes the average. This ensures the consistency of the basic structure and pixel values of the generated picture. Through the minimization of the MSE loss, the model is driven to create images that closely mimic the target image at the pixel level. This process guarantees that the generated image maintains consistency in fundamental aspects such as shape, color, brightness, and more, aligning it with the target image.
The Adversarial Loss is introduced through GAN and serves the purpose of enhancing the perceptual quality of generated images. Its role is to encourage the generated images to be more difficult to distinguish from real high-resolution images by training a Discriminator network. The significance of the Adversarial Loss lies in its ability to enhance the visual perceptual quality of the generated images. By having the generator and discriminator compete, the generator learns to produce images with more details and a greater sense of realism, thereby yielding better results.
The Perceptual Loss is based on perceptual similarity, which uses a pre-trained deep convolutional neural network (VGG network) to measure the semantic similarity between the product image and the goal image. The Perceptual Loss acts as a guide for higher-level features, helping the generator produce images with more semantic meaning. This enhances the perceptual quality of the image by making it easier for the generated images to capture the structure, texture, and features of the target image. This project utilizes the first 25 layers of the VGG19 network (VGG19_25) to compute the Perceptual Loss. A deep convolutional neural network called VGG19 uses 3x3 convolutional kernels across 19 layers of convolution and pooling. It effectively captures and represents image features, making it a suitable choice for computing perceptual loss.
These three loss functions collectively impact the training of the generator, considering pixel-level consistency, visual fidelity, and semantic similarity of images. They work together to ensure that the generated super-resolution images achieve the best possible quality in various aspects. In order to balance the impact of other loss functions, the weight of the MSE loss is set to 0.01 in this project. The Adversarial Loss weight is set to 1.0, and the Perceptual Loss weight is set to 0.006. These weightings are carefully chosen through fine-tuning to achieve the best training results.
2.4. Implementation details
The deep learning tasks in this experiment heavily rely on an NVIDIA RTX 4090 GPU, equipped with 24GB of video memory (VRAM), which is used for both model training and inference. In this experiment, the hyperparameters are configured as follows: the learning rate is set to 3×10⁻⁴, the number of training epochs is 300, the batch size is 16, the number of worker threads is 2, and the image channels are set to 3. Both the generator and discriminator utilize the Adam optimizer, and the convolutional kernel size for the discriminator is set to 3x3.
The commonly utilized Structural Similarity Index (SSIM) and Peak Signal to Noise Ratio (PSNR) were used as evaluation criteria in this study [11]. PSNR is defined as shown in Equation (4):
\( PSNR=10lg{\frac{{255^{2}}}{{M_{SE}}}} \) (4)
MSE represents Mean Squared Error. Lower visual distortion is indicated by a higher PSNR value. SSIM is defined as shown in Equation (5):
\( SSIM(X,Y)=\frac{(2{μ_{X}}{μ_{Y}}+C1)(2{σ_{XY}}+C2)}{(μ_{X}^{2}+μ_{Y}^{2}+C1)(σ_{X}^{2}+σ_{Y}^{2}+C2)} \) (5)
The structural similarity between the original image and the reconstructed image is better expressed by SSIM. Better picture quality is indicated by a value of SSIM which is nearer to 1, which denotes a higher degree of similarity between the image block of original standard and the reconstructed. In these equations, the symbols μX represent the mean values of images X and μY for Y, variances can be presented by σ, for covariance use σXY, and for constants use C1 and C2.
3. Result and Discussion
3.1. Result
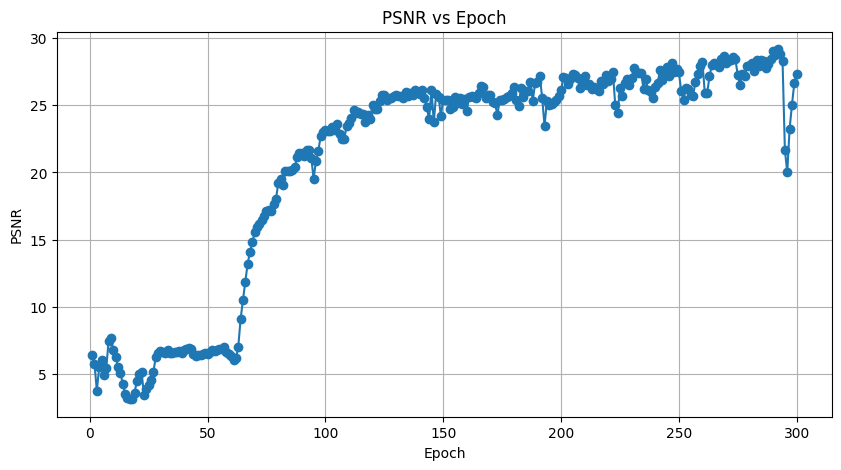
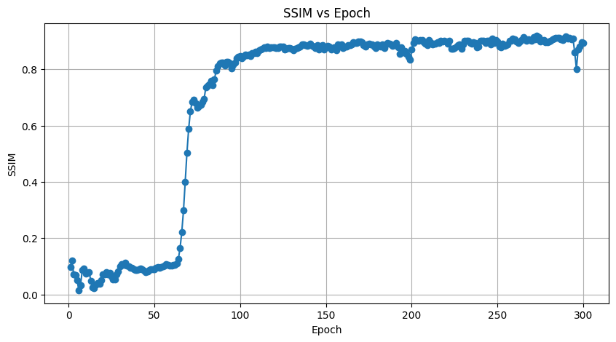
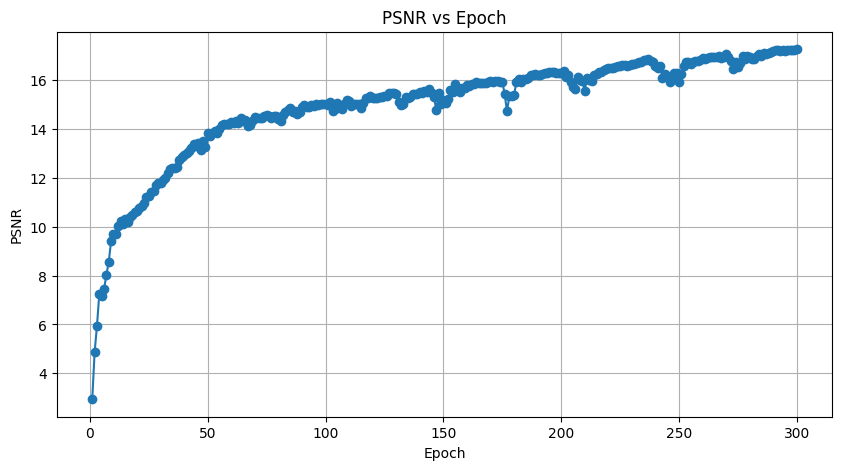
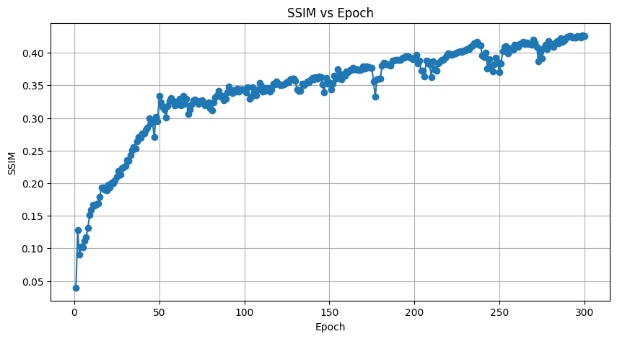
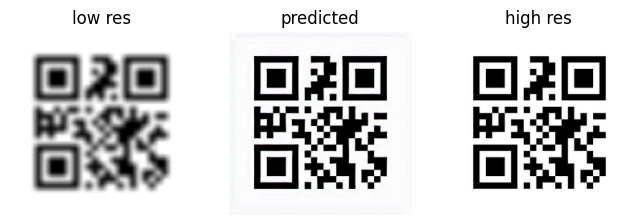
By running SRGAN and SRCNN models, the performance of PSNR and SSIM of SRGAN and SRCNN in each training cycle can be obtained (as shown in Figure 5 Figure 6 Figure 7 and Figure 8), and the comparison map of low_res, predicted and high_res images can also be obtained. Figure 9 shows the QR image generated by SRGAN after cycle 299 with PSNR=30.06 and SSIM=0.936. Figure 10 for SRCNN QR image generated after 299 cycles, PSNR = 17.48, the SSIM = 0.473. Table 1 shows the comparison of the generated images of SRGAN and SRCNN in terms of PSNR and SSIM in 1, 50, 100, 150, 200, 250 and 299 cycles.
|
| |
Figure 5. PSNR for each SRGAN method. | Figure 6. SSIM for each SRGAN method. |
|
| |
Figure 7. PSNR for each SRCNN method. | Figure 8. SSIM for each SRCNN method. |
|
Figure 9. The result of SRGAN. From left to right: low-resolution image, predicted image, high-resolution image. |
|
Figure 10. The result of SRCNN. From left to right: low-resolution image, predicted image, high-resolution image. |
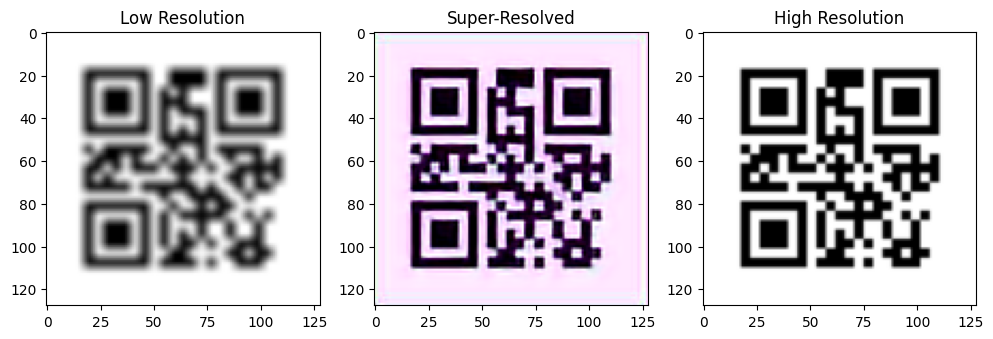
Table 1. Comparison of PSNR and SSIM for SRGAN and SRCNN model.
Epoch | PSNR(SRCNN) | PSNR(SRGAN) | SSIM(SRCNN) | SSIM(SRGAN) |
1 | 4.10 | 6.56 | 0.033 | 0.098 |
50 | 13.32 | 24.17 | 0.276 | 0.891 |
100 | 15.32 | 25.72 | 0.377 | 0.910 |
150 | 16.15 | 27.26 | 0.410 | 0.923 |
200 | 16.77 | 29.16 | 0.434 | 0.932 |
250 | 16.83 | 29.47 | 0.420 | 0.934 |
299 | 17.48 | 30.06 | 0.473 | 0.936 |
3.2. Discussion
As can be observed from the PSNR line plots in Table 1 and Figures 5 and 7, the SRGAN model performs better than SRCNN in all selected cycles. Especially in the period of 299, when the SRGAN PSNR is 30.06, while SRCNN PSNR is 17.48. This suggests that SRGAN model has higher accuracy in terms of reconstruction image. In Table 1 and Figures 6 and 8, on the SSIM SRGAN also did well, the SSIM values stability after 50 cycles above 0.9, while SRCNN SSIM values below 0.5. This further proves the SRGAN in keeping the advantages of image structure.
In this experiment, it is evident that SRGAN performs admirably not only in terms of PSNR but also achieves exceptionally high scores in SSIM. This demonstrates its capability to generate images of superior quality with accurate structural details. Furthermore, SRGAN displays remarkable resilience and dependability throughout the training process, a crucial characteristic for practical applications. Due to the advantages of SRGAN in terms of image quality, it is particularly suitable for scenarios that require high-resolution and high-quality images, such as high-precision scanning of QR code. While SRGAN typically boasts a more intricate network structure, its evident advantages in terms of image quality render it an ideal selection within environments equipped with ample computing resources. Future research will explore how to improve the super-resolution reconstruction of QR code by SRGAN and reduce its computation and memory requirements. Specifically, the attention mechanism may be considered in the SRGAN for further improving performance due to its excellent performance in other tasks [12, 13].
4. Conclusion
In this work, in order to further enhance the clarity of QR codes while preserving their structural integrity, the SRGAN is used to do super-resolution reconstruction on low-resolution images. Both SRCNN and SRGAN models are applied to the task of super-resolution reconstruction, and the generated images are compared in terms of PSNR and SSIM. Extensive experiments are conducted to compare the performance of the SRGAN model in terms of PSNR and SSIM under various hyperparameter settings. The experimental results demonstrate that, across a range of hyperparameter configurations, the SRGAN model outperforms the SRCNN model in QR code super-resolution reconstruction. Future research will explore avenues to further enhance the super-resolution reconstruction of QR codes by SRGAN while reducing its computational and memory requirements.
References
[1]. Yang J Liu Y Du Y 2002 Research and Applications of Two-Dimensional Codes (in Chinese) Applied Technology 11(1)
[2]. Bhamidipati V S & Wvs R S 2022 A Novel Approach to Ensure Security and Privacy While Using QR Code Scanning in Business Applications In 2022 Seventh International Conference on Parallel Distributed and Grid Computing (PDGC) (pp. 198-203) IEEE
[3]. Bätz M Eichenseer A Seiler J Jonscher M & Kaup A 2015 Hybrid super-resolution combining example-based single-image and interpolation-based multi-image reconstruction approaches In 2015 IEEE international conference on image processing (ICIP) pp 58-62 IEEE
[4]. Kim K I & Kwon Y 2010 Single-image super-resolution using sparse regression and natural image prior IEEE transactions on pattern analysis and machine intelligence 32(6) 1127-1133
[5]. Dong C Loy C C He K & Tang X 2015 Image super-resolution using deep convolutional networks IEEE transactions on pattern analysis and machine intelligence 38(2) 295-307
[6]. Xi Z Hou C Yuan K & Xue Z 2019 Accelerated Image Super-Resolution Reconstruction Based on Deep Residual Networks (in Chinese) Acta Optica Sinica 39(2) 0210003
[7]. Xiao J S Liu E Y Zhu L & Lei J 2017 Improved image super-resolution algorithm based on convolutional neural network Acta Opt Sin 37(3) 0318011
[8]. Goodfellow I et al 2014 Generative adversarial nets Advances in neural information processing systems 27
[9]. Ledig C et al 2017 Photo-realistic single image super-resolution using a generative adversarial network In Proceedings of the IEEE conference on computer vision and pattern recognition (pp. 4681-4690)
[10]. Kaggle 2019 QR codes https://www.kaggle.com/datasets/coledie/qr-codes
[11]. Wang Z et al 2004 Image quality assessment: from error visibility to structural similarity IEEE transactions on image processing 13(4) 600-612
[12]. Qiu Y et al 2022 Pose-guided matching based on deep learning for assessing quality of action on rehabilitation training Biomedical Signal Processing and Control 72 103323
[13]. Zhu F et al 2023 Similarity attention-based CNN for robust 3D medical image registration Biomedical Signal Processing and Control 81 104403
Cite this article
Du,M. (2024). QR code resolution improvement based on Super-Resolution Generative Adversarial Network. Applied and Computational Engineering,51,6-13.
Data availability
The datasets used and/or analyzed during the current study will be available from the authors upon reasonable request.
Disclaimer/Publisher's Note
The statements, opinions and data contained in all publications are solely those of the individual author(s) and contributor(s) and not of EWA Publishing and/or the editor(s). EWA Publishing and/or the editor(s) disclaim responsibility for any injury to people or property resulting from any ideas, methods, instructions or products referred to in the content.
About volume
Volume title: Proceedings of the 4th International Conference on Signal Processing and Machine Learning
© 2024 by the author(s). Licensee EWA Publishing, Oxford, UK. This article is an open access article distributed under the terms and
conditions of the Creative Commons Attribution (CC BY) license. Authors who
publish this series agree to the following terms:
1. Authors retain copyright and grant the series right of first publication with the work simultaneously licensed under a Creative Commons
Attribution License that allows others to share the work with an acknowledgment of the work's authorship and initial publication in this
series.
2. Authors are able to enter into separate, additional contractual arrangements for the non-exclusive distribution of the series's published
version of the work (e.g., post it to an institutional repository or publish it in a book), with an acknowledgment of its initial
publication in this series.
3. Authors are permitted and encouraged to post their work online (e.g., in institutional repositories or on their website) prior to and
during the submission process, as it can lead to productive exchanges, as well as earlier and greater citation of published work (See
Open access policy for details).
References
[1]. Yang J Liu Y Du Y 2002 Research and Applications of Two-Dimensional Codes (in Chinese) Applied Technology 11(1)
[2]. Bhamidipati V S & Wvs R S 2022 A Novel Approach to Ensure Security and Privacy While Using QR Code Scanning in Business Applications In 2022 Seventh International Conference on Parallel Distributed and Grid Computing (PDGC) (pp. 198-203) IEEE
[3]. Bätz M Eichenseer A Seiler J Jonscher M & Kaup A 2015 Hybrid super-resolution combining example-based single-image and interpolation-based multi-image reconstruction approaches In 2015 IEEE international conference on image processing (ICIP) pp 58-62 IEEE
[4]. Kim K I & Kwon Y 2010 Single-image super-resolution using sparse regression and natural image prior IEEE transactions on pattern analysis and machine intelligence 32(6) 1127-1133
[5]. Dong C Loy C C He K & Tang X 2015 Image super-resolution using deep convolutional networks IEEE transactions on pattern analysis and machine intelligence 38(2) 295-307
[6]. Xi Z Hou C Yuan K & Xue Z 2019 Accelerated Image Super-Resolution Reconstruction Based on Deep Residual Networks (in Chinese) Acta Optica Sinica 39(2) 0210003
[7]. Xiao J S Liu E Y Zhu L & Lei J 2017 Improved image super-resolution algorithm based on convolutional neural network Acta Opt Sin 37(3) 0318011
[8]. Goodfellow I et al 2014 Generative adversarial nets Advances in neural information processing systems 27
[9]. Ledig C et al 2017 Photo-realistic single image super-resolution using a generative adversarial network In Proceedings of the IEEE conference on computer vision and pattern recognition (pp. 4681-4690)
[10]. Kaggle 2019 QR codes https://www.kaggle.com/datasets/coledie/qr-codes
[11]. Wang Z et al 2004 Image quality assessment: from error visibility to structural similarity IEEE transactions on image processing 13(4) 600-612
[12]. Qiu Y et al 2022 Pose-guided matching based on deep learning for assessing quality of action on rehabilitation training Biomedical Signal Processing and Control 72 103323
[13]. Zhu F et al 2023 Similarity attention-based CNN for robust 3D medical image registration Biomedical Signal Processing and Control 81 104403