


1. Introduction
In recent years, with the evolution and widespread adoption of the Internet, the development of malicious software has advanced, and network security has faced a significant threat [1]. Detecting and classifying malicious traffic is an essential defence strategy in network security, and the problem of traffic classification has received widespread attention. Network traffic data is often imbalanced, with a much larger amount of benign traffic compared to malicious traffic, resulting in the phenomenon of unbalanced data being very common when detecting malicious traffic, also a difficult problem [2].
Deep learning has made remarkable progress in various fields recently, and many scholars have begun to apply it to network traffic classification. Wei Wang et al. trained two-dimensional Convolutional Neural Networks (CNNS) with features extracted from preprocessed raw traffic data [3]. The authors demonstrate the excellent performance of this model compared with traditional technology by measuring its accuracy. M.Lopez-Martin and his colleagues combined CNN and RNN technology, and the network constructed by the authors using flow statistical features and packet sequence numbers selected by them as the two features of traffic input achieved excellent results [4].
Researchers have devoted themselves to solving the problem of imbalanced data classification for a long time. The common methods used are adjusting the dataset or adjusting the model algorithm and evaluation method. At the data level, resampling is mostly leveraged, including: a) Insufficient sampling: Discard most of the class samples until the number of samples in each class is almost the same, which can preserve valuable learning information. b) Over sampling: Based on a small number of class samples, establish new samples to make the class distribution of the samples more balanced. c) Hybrid sampling: Undersampling and oversampling will have the problem of useful information being discarded and overfitting, respectively. The hybrid sampling used to break through this limitation is the combination of the two resampling methods [5]. In terms of adjusting algorithms, there are mainly ways of ensemble learning modifying loss functions [6]. Traditional methods for calibrating the output probabilities of machine learning classifiers include Platt scaling, histogram binning, rank-preserving regression, and Bayesian binning and averaging. With the breakthrough and wide application of deep learning technology, In order to improve the calibration of the network, it was suggested to use a temperature calibration method. The core idea is to introduce a scalar value, also known as "temperature", in this mode to adjust the probability distribution of its results. This parameter is a positive number. The new probability distribution can be obtained by dividing the original output score of the model by the temperature parameter T and then applying the softmax function [7]. Training models using label smoothing instead of cross-entropy loss of one-hot labels is also a common technique that can be used to improve model performance, generalization ability, and calibration, especially in multi-class classification tasks [8].
Cross entropy focuses on the difference between the predicted and true values of each sample in model training, while for small sample data, relatively little attention is paid [9]. In previous research work, people used the focus loss method to replace the complementary loss function [10]. In many aspects, it has shown a good solution to the problem of class imbalance.
This project plans to use a single CNN model to classify multiple types of traffic into multiple categories, analyze their performance under different sample sizes, and compare them with the Cross talk method based on Cross talk. Analyze the impact of using the Alpha value selection method based on Cross talk method on multi category traffic when dealing with multi category traffic. On this basis, a new weighted distribution method is introduced to replace the alpha of the focal loss function, increasing the importance of sparse classification. Experiments have shown that the method proposed in this paper has higher accuracy compared to the commonly used alpha selection method.
The remaining content of this article is arranged as follows. The second section provides a brief overview of malicious data flow monitoring issues. In Part 3, we will provide a detailed introduction to common multi class problems and the designed optimal alpha algorithm. In the fourth section, we will conduct relevant analysis and analysis using our own actual tests to verify the various algorithms we propose. The fifth section is the concluding section.
2. Problem Statement
A network attack behavior recognition method based on network attack behavior is proposed for the current network attack behavior, and it is summarized as a network attack behavior recognition method. A six step model for encrypting malicious traffic monitoring has been proposed, which includes six steps: target localization, data collection, data processing, model selection, training and evaluation, and application inspection and improvement. [11]. Most of the data collected in network traffic classification are in pcap and pcapng format, including file header, data packet header, data packet and other parts. In the algorithms using machine learning, the features are often extracted into files, while in deep learning, the data is only cut and processed [3]. After the data is processed, the appropriate model is selected, and the data and model are optimized again after receiving feedback from the model training and evaluation.
3. Method
3.1. CNN Network
CNN belongs to deep feedforward neural network. Although the relevant network models are constantly developing and improving, their core functions have not changed much, but are divided into four levels: input layer, convolution layer, pooling layer and fully connected layer [12,13].
1) Input layer: the information obtained after preprocessing the input information is generally input as a matrix in the convolutional neural network, and it is converted into a pixel matrix for the next operation. In this paper, the data packet of pcap is preprocessed and transformed into a gray image.
2) Correlated layer: correlated layer is a key component of the correlated network system. This method adopts a new method, that is, a new method. The convolution operation of convolution kernel and the conversion of activation layer are adopted to make the characteristics of the image more obvious. Relu activation function used in this test:
\( F(x)=max(0,x) \) (1)
In this formula, X represents the input of the previous level and the output of the excitation function. Generally, the new matrix will be transferred to the next level.
3) Water tank layering: water tank layering plays a similar function to water tank layering, and strengthens and extracts some key characteristics of water tank. Maximum pool method and average pool method are the two most common methods. These two methods extract the most important features in each window and generate a new matrix to the next layer of the network.
4) Fully connected layer:The last layer of convolutional neural networks often uses a fully connected layer to smooth the matrix expansion previously processed into multiple channels and batches, and uses the classification function for classification, and the softmax function is often used for classification.
Three convolution layers, two pool layers and two fully connected layers are used in a simple test network, and the shape of the matrix can be adjusted according to the data set.
3.2. Cross Entropy
Among the current learning algorithms, the most common is the learning algorithm based on mutual information. In the classification problem, it is applied to analyze the difference between the predicted results and the real results, and then quantify and reduce the difference, so as to improve the overall performance of the model [14,9]. For the two types of problems, the expression of the cross entropy dissipation function is as follows:
\( L(y\_true,y \prime )=-[y\_true×log{(y \prime )}+(1-y\_true)×log{(1-y \prime )]} \) (2)
Here, L is a loss function, y_true is a real value, and y’ is a forecast value. When faced with multi-class classification problem, it is denoted by
\( L(y\_true,y \prime )=-\sum ({y_{i}}×log{({y \prime _{i}})}) \) (3)
, where y_true is typically a one-hot encoded vector with only one element of 1 and the others of 0. The final loss result is obtained by the cumulative sum of the difference between the predicted value and the real value of each data, and the function is only to optimize the final total loss. If the data amount of a class of traffic is particularly small, the attention obtained in the overall loss sum will become small accordingly, and the characteristics about it will be difficult to be learned completely. This is why the cross entropy dissipation function cannot be used in the case of extreme disequilibrium.
3.3. Focal Loss
Focus factor is a modified cross entropy loss method. On this basis, focus factor is introduced to correct it. The calculation formula of coke consumption is given in equation 4
\( FL(y\_true,y \prime )=\begin{cases} \begin{array}{c} -α{(1-y \prime )^{γ}}log{y \prime }, y\_true=1 \\ -{(1-α)y \prime ^{γ}}log{(1-y \prime )}, y\_true=0 \end{array} \end{cases} \) (4)
, Where y_true is a real value, y’ is an expected value, and gamma is a focus coefficient, which is a positive number regulating attention. Generally, the higher the value, the more attention the model pays to the samples that are difficult to classify. The best value 2 is leveraged from previous research [10]. The purpose of the other hyperparameter α is also to further adjust the loss weights of different classes, this is a number between 0 and 1, and its value could be modified according to the needs of the task.
3.4. Improved \( α \)
According to the focus loss function, this algorithm further expands the attention of a few categories and gives more attention. However, for the multi category and multi category recognition problem, there is not only one small category, and the attention to small category recognition is also different. Using the same amplification factor for all samples in a small group can not get accurate gain for all samples in a small group, but the best gain can be obtained through repeated tests. In order to solve this problem, we use a new weighted distribution formula to replace it, so that the weighted effect can be improved to the greatest extent, thus eliminating the step of finding the optimal alpha.
\( class\_weights=\frac{{N_{total}}×K}{({N_{class}}+1e-6)} \) (5)
, where \( {N_{total}} \) is the all samples, \( {N_{class}} \) is samples of each category, K is a constant that can be used to adjust the weight scale. You can choose to take the corresponding 10 to the power of n, and if you need higher accuracy, you can increase the value of K. In this experiment, the value of K is selected as 10, and each category corresponds to its own weight.
4. Result
In this experiment, different upper sampling limits are chosen to observe the performance of minority class samples in conventional multi-classification problems, and compare the performance of minority class samples when using cross-entropy function, focal loss with different α values and the proposed weight α under the condition of fixed sampling upper limit.
The dataset used in this study is part of the ISCXVPN2016 dataset. This dataset was generated by scraping traffic using tools such as Wireshark. The whole dataset has 13 categories such as Chat,VPN-Chat,P2P,VPN-P2P. This dataset is used to support model training in research and testing of solutions to the sample imbalance problem. Most classes of traffic can be sampled to more than 30000 data samples, and there are three small classes of traffic that cannot be sampled to the highest threshold: The VPN data of ICP is 7877, the non VPN data of aim is 4099, and the VPN data of aim is 2455, which is the least. The detection effect of this method in various cases is analyzed.
The test was carried out on a computer equipped with Intel Core i5 processor and 16 GB of memory. The software used was python3.9.16 and tensorflow2.12.
First of all, for different types of services, 10000, 15000 and 30000 services were collected respectively, and the VPN data of different types of services were compared in 50 repetitions. This paper makes a detailed evaluation of the performance of such data streams from the perspectives of accuracy, recall and F1 score, as shown in Table 1. We show this result in the form of chart 1 to make it more intuitive. When the number of samples is 10000, the three evaluation indexes (97,92,95) (accuracy, recall, F1) are the maximum. As the sample size increases, the disequilibrium (i.e. the minimum sample) also increases. The traditional mutual information loss algorithm has little research on the disequilibrium. The study found that with the increase of sample size, all indicators showed a downward trend. When the number of samples increased to 30000, the decline rate of each index was 92,92,93.
Table 1. Performance of different number of samples.
Metric | Numbers of resamples | ||
10000 | 15000 | 30000 | |
Precision (%) | 97 | 94 | 92 |
Recall (%) | 92 | 91 | 92 |
F1 (%) | 95 | 93 | 93 |
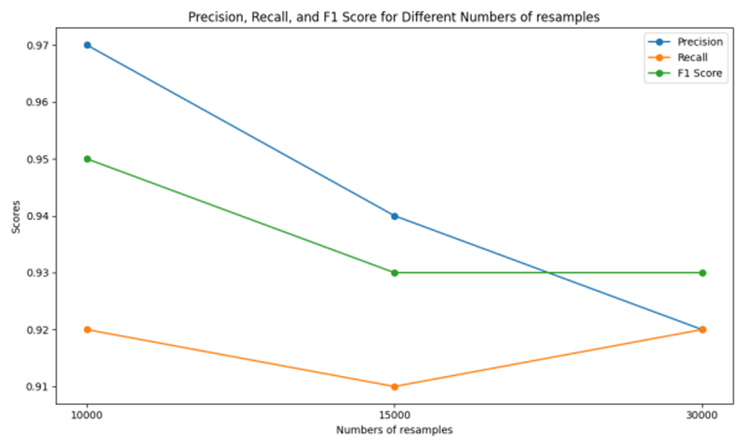
Figure 1. Performance comparison (Figure Credits: Original).
When exploring the performance of each loss function in the case of the most imbalanced data samples (the upper sampling limit is 30000), γ of focal loss is set to the optimal value 2 obtained in [10], and set α to 0.25, 0.5, 0.75 respectively, and conduct experiments with the proposed improved α under the same conditions. This result is shown in Table 2 and Figure 2. Under three different α values of hyperparameter selection, the choice of α=0.25 gave the best attention to the minority class (97,92,94), while the use of improved α achieved the highest accuracy of 99 among all methods, but the regression rate was lower than α=0.25, which was 91. Finally, the F1 index (94), which is close to the optimal value of α, is obtained. And the different algorithm times are also close.
Table 2. Performance of various settings of alpha.
normal | improved | Ɑ=0.5 | Ɑ=0.25 | Ɑ=0.75 | |
Precision (%) | 92 | 99 | 91 | 97 | 88 |
Recall (%) | 92 | 90 | 91 | 92 | 91 |
F1 (%) | 93 | 94 | 91 | 94 | 90 |
Running Time (seconds) | 4000.15s | 4040.66s | 4051.29s | 3672.75s | 4154.06s |
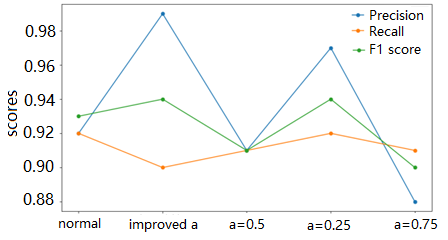
Figure 2. Performance of various settings of alpha (Figure Credits: Original).
5. Conclusion
The detection method of malicious data stream based on multi category data is discussed. This work uses a simple CNN network structure to achieve multi-classification of network traffic and focus on the issue of data imbalance. Imbalance of traffic classification is commonly referred to as the phenomenon where one or more classes of traffic data are much more numerous than other classes during classification tasks. This can be due to real-world scenarios where certain types of traffic are more common than others. This results in a great difference in the number of different types of samples. The model is optimized by comparing various loss functions. Additionally, this work proposes a weight allocation formula to optimize the selection of the hyperparameter α in the focal loss function, which demonstrates better performance in accuracy compared to the relatively optimal α.
References
[1]. Khraisat, A., Gondal, I., Vamplew, P., & Kamruzzaman, J. (2019). Survey of intrusion detection systems: techniques, datasets and challenges. Cybersecurity, 2(1), 1-22.
[2]. Chen, Z., Yan, Q., Han, H., Wang, S., Peng, L., Wang, L., & Yang, B. (2018). Machine learning based mobile malware detection using highly imbalanced network traffic. Information Sciences, 433, 346-364.
[3]. Wang, W., Zhu, M., Wang, J., Zeng, X., & Yang, Z. (2017). End-to-end encrypted traffic classification with one-dimensional convolution neural networks. In 2017 IEEE international conference on intelligence and security informatics, 43-48.
[4]. Lopez-Martin, M., Carro, B., Sanchez-Esguevillas, A., & Lloret, J. (2017). Network traffic classifier with convolutional and recurrent neural networks for Internet of Things. IEEE access, 5, 18042-18050.
[5]. Burnaev, E., Erofeev, P., & Papanov, A. (2015). Influence of resampling on accuracy of imbalanced classification. In Eighth international conference on machine vision, 9875, 423-427.
[6]. Wu, Z., Lin, W., & Ji, Y. (2018). An integrated ensemble learning model for imbalanced fault diagnostics and prognostics. IEEE Access, 6, 8394-8402.
[7]. Lin, T. Y., Goyal, P., Girshick, R., He, K., & Dollár, P. (2017). Focal loss for dense object detection. In Proceedings of the IEEE international conference on computer vision, 2980-2988.
[8]. Müller, R., Kornblith, S., & Hinton, G. E. (2019). When does label smoothing help?. Advances in neural information processing systems, 32, 1-8.
[9]. Zhang, Z., & Sabuncu, M. (2018). Generalized cross entropy loss for training deep neural networks with noisy labels. Advances in neural information processing systems, 31, 1-8.
[10]. Lin, T. Y., Goyal, P., Girshick, R., He, K., & Dollár, P. (2017). Focal loss for dense object detection. In Proceedings of the IEEE international conference on computer vision, 2980-2988.
[11]. Zhai, M., Zhang, X., & Zhao, B. (2020). Survey of encrypted malicious traffic detection based on deep learning. Chinese Journal of Network and Information Security, 6(3), 59-70.
[12]. Alzubaidi, L., Zhang, J., Humaidi, A. J., Al-Dujaili, A., Duan, Y., Al-Shamma, O., et al. (2021). Review of deep learning: Concepts, CNN architectures, challenges, applications, future directions. Journal of big Data, 8, 1-74.
[13]. Janssens, O., Slavkovikj, V., Vervisch, B., Stockman, K., Loccufier, M., Verstockt, S., et al. (2016). Convolutional neural network based fault detection for rotating machinery. Journal of Sound and Vibration, 377, 331-345.
[14]. Gordon-Rodriguez, E., Loaiza-Ganem, G., Pleiss, G., & Cunningham, J. P. (2020). Uses and abuses of the cross-entropy loss: Case studies in modern deep learning, 1-10.
Cite this article
Yu,S. (2024). An improved focal loss for imbalanced network traffic classification. Applied and Computational Engineering,51,33-39.
Data availability
The datasets used and/or analyzed during the current study will be available from the authors upon reasonable request.
Disclaimer/Publisher's Note
The statements, opinions and data contained in all publications are solely those of the individual author(s) and contributor(s) and not of EWA Publishing and/or the editor(s). EWA Publishing and/or the editor(s) disclaim responsibility for any injury to people or property resulting from any ideas, methods, instructions or products referred to in the content.
About volume
Volume title: Proceedings of the 4th International Conference on Signal Processing and Machine Learning
© 2024 by the author(s). Licensee EWA Publishing, Oxford, UK. This article is an open access article distributed under the terms and
conditions of the Creative Commons Attribution (CC BY) license. Authors who
publish this series agree to the following terms:
1. Authors retain copyright and grant the series right of first publication with the work simultaneously licensed under a Creative Commons
Attribution License that allows others to share the work with an acknowledgment of the work's authorship and initial publication in this
series.
2. Authors are able to enter into separate, additional contractual arrangements for the non-exclusive distribution of the series's published
version of the work (e.g., post it to an institutional repository or publish it in a book), with an acknowledgment of its initial
publication in this series.
3. Authors are permitted and encouraged to post their work online (e.g., in institutional repositories or on their website) prior to and
during the submission process, as it can lead to productive exchanges, as well as earlier and greater citation of published work (See
Open access policy for details).
References
[1]. Khraisat, A., Gondal, I., Vamplew, P., & Kamruzzaman, J. (2019). Survey of intrusion detection systems: techniques, datasets and challenges. Cybersecurity, 2(1), 1-22.
[2]. Chen, Z., Yan, Q., Han, H., Wang, S., Peng, L., Wang, L., & Yang, B. (2018). Machine learning based mobile malware detection using highly imbalanced network traffic. Information Sciences, 433, 346-364.
[3]. Wang, W., Zhu, M., Wang, J., Zeng, X., & Yang, Z. (2017). End-to-end encrypted traffic classification with one-dimensional convolution neural networks. In 2017 IEEE international conference on intelligence and security informatics, 43-48.
[4]. Lopez-Martin, M., Carro, B., Sanchez-Esguevillas, A., & Lloret, J. (2017). Network traffic classifier with convolutional and recurrent neural networks for Internet of Things. IEEE access, 5, 18042-18050.
[5]. Burnaev, E., Erofeev, P., & Papanov, A. (2015). Influence of resampling on accuracy of imbalanced classification. In Eighth international conference on machine vision, 9875, 423-427.
[6]. Wu, Z., Lin, W., & Ji, Y. (2018). An integrated ensemble learning model for imbalanced fault diagnostics and prognostics. IEEE Access, 6, 8394-8402.
[7]. Lin, T. Y., Goyal, P., Girshick, R., He, K., & Dollár, P. (2017). Focal loss for dense object detection. In Proceedings of the IEEE international conference on computer vision, 2980-2988.
[8]. Müller, R., Kornblith, S., & Hinton, G. E. (2019). When does label smoothing help?. Advances in neural information processing systems, 32, 1-8.
[9]. Zhang, Z., & Sabuncu, M. (2018). Generalized cross entropy loss for training deep neural networks with noisy labels. Advances in neural information processing systems, 31, 1-8.
[10]. Lin, T. Y., Goyal, P., Girshick, R., He, K., & Dollár, P. (2017). Focal loss for dense object detection. In Proceedings of the IEEE international conference on computer vision, 2980-2988.
[11]. Zhai, M., Zhang, X., & Zhao, B. (2020). Survey of encrypted malicious traffic detection based on deep learning. Chinese Journal of Network and Information Security, 6(3), 59-70.
[12]. Alzubaidi, L., Zhang, J., Humaidi, A. J., Al-Dujaili, A., Duan, Y., Al-Shamma, O., et al. (2021). Review of deep learning: Concepts, CNN architectures, challenges, applications, future directions. Journal of big Data, 8, 1-74.
[13]. Janssens, O., Slavkovikj, V., Vervisch, B., Stockman, K., Loccufier, M., Verstockt, S., et al. (2016). Convolutional neural network based fault detection for rotating machinery. Journal of Sound and Vibration, 377, 331-345.
[14]. Gordon-Rodriguez, E., Loaiza-Ganem, G., Pleiss, G., & Cunningham, J. P. (2020). Uses and abuses of the cross-entropy loss: Case studies in modern deep learning, 1-10.