


1. Introduction
Diabetes Mellitus, a common metabolic disorder, is primarily characterized as hyperglycemia, which affects the patients’ ability to regulate blood glucose levels. If untreated, this chronic condition can lead to a series of severe health complications, including cardiovascular disease, vision defection, amputation, and end organ damage [1]. According to a 2022 report by the Centers for Disease Control and Prevention, Diabetes Mellitus was ranked as the eighth leading cause of death in the US, where 11.3% of the population is living with diabetes and 38% of the population bears prediabetes symptoms. Alarmingly, these figures continue to surge, largely driven by the escalating obesity rates [2]. Thus, proactive diabetes prevention is imperative, not just to counter its detrimental health implications but also to alleviate the economic burden accompanying this growing health crisis.
There are many subclasses of Diabetes Mellitus, the most prevalent being Type I Diabetes Mellitus (T1DM) and Type II Diabetes Mellitus (T2DM). T1DM has an adolescent onset and is a result of defective insulin secretion; whereas T2DM is characterized by a later onset and is caused by cells’ resistance to insulin [3]. This study mainly utilizes data and draws inferences on T2DM, which makes up more than 90% of the diabetic populations but is highly preventable because of its chronic onset period, also known as prediabetes, when patients experience a higher blood glucose level than normal before the emergence of T2DM [2]. Given that prediabetes is reversible, timely detection and intervention are paramount to prevent full-blown diabetes.
In the fight against chronic diseases like T2DM, the adoption of cutting-edge technologies and analytical techniques has become vital. Among these, machine learning and data mining stand out as powerful tool sets. As the burgeoning domains in data science, they are instrumental in crafting predictive tools tailored to tackle various real-world challenges. Data mining, in essence, delves deep into vast datasets to decipher latent patterns and underlying relationships. Once these patterns are identified, machine learning utilizes sophisticated algorithms to assimilate these patterns, thereby making predictions about unobserved or new data.
In line with this approach, our research endeavors to harness the prowess of three prominent machine learning methodologies—K-Nearest Neighbors (KNN), Random Forest (RF), and Support Vector Classification (SVC). These algorithms will be applied to a dataset of significant relevance to our study, the Pima Indians Diabetes Dataset (PIDD). The choice of this dataset, along with the specific algorithms, aligns with our objective to derive meaningful and actionable insights into the early prediction and potential intervention strategies for T2DM. The PIDD dataset, introduced in a seminal 1988 study by Smith et al., has gained considerable recognition within the medical and research communities. Comprising eight predictive variables, this dataset offers insights that closely mirror the clinical indicators associated with T2DM risk. Notably, the Pima Indian community, which the dataset represents, has been observed to have the highest global prevalence of T2DM [4]. The existing data and studies on these subjects are particularly helpful for our analysis of the three machine learning approaches.
The aforementioned algorithms fall under supervised learning paradigms, which harness training data labels and predictors to undertake classification or regression tasks on unfamiliar data. Specifically, the KNN algorithm makes predictions based on the proximity of the new data to existing training data in the feature space. The RF algorithm constructs an ensemble of decision trees and combines the outputs of those trees to make predictions. The SVC algorithm finds a hyperplane that optimally separates classes of data in a high-dimensional feature space [3]. After training all three models, comparisons and contrasts are made on the accuracies, feature importances, and inferences of these algorithms to summarize their performances and compatibility with diabetes prediction.
Even though the PIDD dataset has been widely studied and analyzed, our investigation bears unique significance. To the best of our knowledge, there is yet a study that directly compares the three algorithms with the PIDD dataset. Existing studies either compare accuracies of some of the aforementioned machine learning algorithms or compare them to unsupervised learning algorithms [1, 5-7], or construct a new prediction framework based on these algorithms [5,8]. However, few studies specifically analyzed the feature importances of these algorithms and what they infer about diabetes prediction. Our study is uniquely positioned to contrast KNN, RF, and SVC, extrapolating biological insights from their feature significance. Based on literature review of related work, we predict that the RF algorithm outperforms the other two algorithms in terms of its accuracy in T2DM prediction because of its usage of individual decision tree classifiers [3]. Features related to body weight and blood glucose will be the most contributive to these classifiers based on known top risk factors for T2DM [9], but the specific measures and intervals will be explored in this study. By harnessing these data-centric methodologies, our goal is to catalyze a paradigm shift in healthcare, advancing in the battle against the burgeoning diabetes epidemic.
2. Methods
2.1. Dataset description
This dataset originated from research conducted by Smith et al., published by the National Institute of Diabetes and Digestive and Kidney Diseases [4]. The study comprises data from 768 diabetes patients, all females above 21 years old and of Pima Indian heritage. The dataset includes eight diagnostic measurements and one target variable. Each measurement provides specific insights into the patient’s health, shown in Table 1.
Table 1. Descriptions of feature variables and the outcome variable in the Pima Indian Diabetes Dataset from Smith et al.’s study [4]
Attributes | Descriptions |
Pregnancies | Represents the number of times the patient has been pregnant. |
Glucose | Measures the plasma glucose concentration at 2 hours post an oral glucose tolerance test. |
Blood Pressure | Indicates the diastolic blood pressure (in mmHg). |
Skin Thickness | Quantifies the triceps skin fold thickness (in mm). |
Insulin | Represents the 2-hour serum insulin level (µU/ml). |
Body Mass Index (BMI) | A calculation of weight-to-height ratio, specifically weight in kg divided by the square of height in meters (kg/m2). |
Diabetes Pedigree Function (DPF) | A score representing a patient’s likelihood of developing diabetes, based on their family’s history of diabetes mellitus. This core encapsulates the potential genetic influence on an individual’s risk of diabetes. |
Age | The age of the patient when the data were collected, measured in years. |
Outcome | Denotes the patient’s diabetes diagnosis results, coded as 0 or 1, with 0 signifying a negative test result for diabetes, and 1 signifying a positive test result. |
2.2. Data pre-processing
In the preliminary stage of data preprocessing, we initiated a strategic binning process to categorize data. All predictor variables were systematically categorized into five to six uniformly spaced bins as shown in Table 2. This binning approach served to heighten the accuracy of individual decision trees within the RF model and effectively minimize potential split points, thereby refining the accuracy of feature importance calculations.
Table 2. All eight predictor variables after the binning method is applied. Bin labels and bin intervals are shown in groups under each predictor variable.
Predictors | Bin labels | Bin intervals | Predictors | Bin labels | Bin intervals | Predictors | Bin labels | Bin intervals |
Pregnancies | preg 0-3 | 0-3 | Skin thickness | st 0-20 | 0-20 | Diabetes Pedigree Function | dpf 0-0.5 | 0-0.5 |
preg 3-6 | 3-7 | st 21-40 | 21-40 | dpf 0.6-1 | 0.6-1 | |||
preg 6-9 | 6-9 | st 41-60 | 41-60 | dpf 1.1-1.5 | 1.1-1.5 | |||
preg 9-12 | 9-12 | st 61-80 | 61-80 | dpf 1.6-2 | 1.6-2 | |||
preg 12-15 | 12-15 | st 81-100 | 81-100 | dpf 2.1-2.5 | 2.1-2.5 | |||
preg 15-18 | 15-18 | Insulin | ins 0-141 | 0-141 | Age | age 20-31 | 20-31 | |
Glucose | glu 120-136 | 120-136 | ins 142-282 | 142-282 | age 31-42 | 31-42 | ||
glu 137-152 | 137-152 | ins 283-423 | 283-423 | age 42-53 | 42-53 | |||
glu 153-168 | 153-168 | ins 424-564 | 424-564 | age 53-64 | 53-64 | |||
glu 169-184 | 169-184 | ins 565-705 | 565-705 | age 64-75 | 64-75 | |||
glu 185-200 | 185-200 | ins 706-846 | 706-846 | age 75-86 | 75-86 | |||
Blood pressure | bp 0-24 | 0-24 | BMI | XS | 20-30 | |||
bp 25-50 | 25-50 | S | 30-40 | |||||
bp 51-75 | 51-75 | M | 40-50 | |||||
bp 76-100 | 76-100 | L | 50-60 | |||||
bp 101-125 | 101-125 | XL | 60-70 |
Subsequently, a one-hot encoding technique was applied, effectively transforming these categorical bins into binary columns. This approach ensures that if a data point falls into one bin, it cannot possibly be categorized in another, thus each entry in the dataset either denotes a 1 (present) or 0 (absent) in relation to each bin. Consequently, the original age variable was replaced by these newly generated columns, wherein each column now holds binary values of 0 or 1. This one-hot encoding procedure not only streamlines the data representation but also circumvents the need for normalization, fostering an enhanced environment for algorithms like KNN and SVM to operate by reducing potential biases induced by the scaling of predictor variables. It’s worth noting that, despite not all models necessitating such preprocessing, utilizing the same pre-processed data maintains a uniform training baseline across all the considered models, thereby ensuring consistent and unbiased training results.
2.3. Model selection
To predict the outcome of diabetes patients based on the predictor variables in PIDD, three machine learning algorithms were used in this study: KNN, RF, and SVC. These machine learning pipelines were developed using the KNeighborsClassifier, RandomForestClassifier, and SVC packages from the scikit-learn library [10]. The data was partitioned into training and testing datasets at a 4:1 ratio with random shuffling before feeding into the models, a strategy also known as 5-fold.
The KNN algorithm operates on the underlying assumption that the data points within the same category are partially proximate in feature space. By extension, it posits that the classification of an unseen data point can be inferred from observing the classes of its nearest neighbors. Mathematically, for a given data point \( x \) , KNN examines \( k \) proximal training examples and proffers a classification based on the predominant output value among them. The hyperparameters in this algorithm include (1) \( k \) , which determines the number of nearest neighbors under consideration, and (2) distance metric, which can be Manhattan, Euclidean, and Minkowski [6].
The RF algorithm builds an ensemble of decision trees. Each tree, functioning as an individual predictor, makes a determination about the classification of an input. The final decision is determined based on a majority consensus. This is emblematic of the ensemble learning paradigm wherein multiple weak learners coalesce to configure a robust predictor. The accuracy of prediction of this algorithm depends on several hyperparameters including: (1) the number of decision trees forming the ensemble, (2) the maximal depth permissible of each tree, and (3) constraints on feature selection during the tree splitting process [5].
The SVC algorithm is rooted in a geometric approach. It searches for an optimal hyperplane within the feature space that can distinctly split data into their respective classes. The essence of SVC is to locate a hyperplane such that the margin between the two classes is maximized. Hyperparameters of this algorithm include (1) C, which modulates the trade-off between margin maximization and classification error minimization, (2) kernel, which determines data transformation, and (3) gamma, which delineates the reach of individual training instances [7].
2.4. Parameter optimization
In the pursuit of model perfection, hyperparameter optimization stands paramount, acting as the key to dictating a model’s performance. This study opted for the grid search method to optimize the hyperparameters, leveraging the GridSearchCV module from the scikit-learn library [10]. This technique embarks on a comprehensive exploration, systematically sifting through each potential combination from a predetermined set of hyperparameters.
The underlying mechanics of grid search can be perceived as a meticulous search algorithm that assesses the model’s performance across each hyperparameter permutation. Each combination’s performance is evaluated using 5-fold cross-validation, ensuring that every data instance partakes both as a test and as a training sample across the validation cycles. This iterative validation is pivotal, not just for its robustness in assessing generalization but also for ensuring unbiased performance evaluation.
At the culmination of this exhaustive search, the hyperparameters that synergistically contribute to the zenith of cross-validation accuracy are earmarked as the optimal set. This optimization process, though computationally intensive, is invaluable. It ensures that each model is fine-tuned to its pinnacle of performance, providing a more equitable basis for comparison.
2.5. Evaluating outputs with cross validation
Following the process of hyperparameter tuning and once the optimal parameters are delineated, the ensuing crucial step in our study is the rigorous evaluation of the models. It’s imperative to affirm that the chosen hyperparameters indeed generalize well to unseen data and aren’t just a byproduct of overfitting to the training dataset.
To achieve this objective, we also choose to use the 5-fold cross-validation. Under this paradigm, the dataset is judiciously partitioned into five distinct subsets or “folds.” In a cyclic manner, four of these folds are harnessed as the training data, whilst the solitary remaining fold serves as the validation set. This procedure is reiterated five times with a fixed random state, ensuring the result is repeatable.
The overarching goal is to ascertain the mean accuracy across these five validation cycles. This average metric, hence derived, offers a holistic and less biased insight into the model’s performance. Once confident in this assessment, models are subsequently retrained using the entire dataset and the previously identified optimal parameters.
2.6. Determining feature importance
Evaluating the significance of distinct features in influencing the predictive diabetes outcomes of the models is an important step in understanding how different machine learning algorithms process data. The methods applied to discern the feature importance varied based on the algorithm in use.
Being a linear Support Vector Machine (SVM), SVC’s decision boundary is a hyperplane defined by:
\( f(x)={w^{T}}x+b \) (1)
Where \( w \) is the weight vector (coefficients) that indicates the importance of each feature. In essence, the weightage of the coefficients in the decision function provided an intuitive representation of the relative importance of each feature [11].
The feature importance in RF is calculated based on the total decrease in node impurity averaged over all trees. Simply put, the magnitude by which a feature enhances the predictive accuracy of the model, by reducing its impurity, serves as an index of its importance. In this study, the feature importance is calculated using the built-in feature_importance_ attribute in the scikit-learn library [10].
As for the KNN, the algorithm inherently lacks a direct method for gauging feature importance. To address this, we utilized the permutation importance method. This entailed sequentially shuffling each feature and contrasting the model’s predictive performance pre- and post-shuffle. A notable deterioration in performance post-shuffle would signify the feature’s importance.
It’s worth noting that, feature importance is discerned through various methodologies, which can exhibit a broad spectrum of values contingent upon the techniques employed. To ensure the comparability of these disparate scales of importance across multiple methods, a min-max normalization process is enforced to scale all importance values using the following formula:
\( x \prime =\frac{x-min(x)}{max(x)-min(x)} \) (2)
This adjustment bounds all feature importance values across the three models by \( [0,1] \) and provides a coherent and normalized scale for more rigorous and direct comparative analysis.
3. Results
3.1. Comparative model performance
For analysis, three machine learning models, facilitated by the scikit-learn package (version 1.2.1), were employed to predict diabetes onset: KNN, RF, and SVC. Each model was rigorously trained and evaluated using a 5-fold cross-validation approach on the pre-processed dataset, which underwent binning and one-hot encoding procedures.
Through Grid Search, the optimal parameters for the KNN model were identified as a leaf size of 1, distance metric “Euclidean”, \( k \) value of 6, and weights set to “uniform”. Using this configuration, KNN achieved an accuracy of 71.01%. The best parameters identified by Grid Search for the RF model were a max depth of 8, max samples set at 0.92, min samples split and leaf at 0.01, and the number of estimators being 18. Under these parameters, the RF model achieved an accuracy of 75.25%. For the SVC model, the optimal parameters as determined by Grid Search were regularization set at 100, gamma value of 0.01, with the kernel type as “linear”. The SVC model, with this configuration, achieved an accuracy of 74.92%. Overall, the RF model has the highest accuracy score amongst all three models, as we hypothesized. Yet, SVC and KNN both had notable accuracy above 70%, and SVC’s score is comparable to that of the RF.
In evaluating the performance metrics from the KNN, SVC, and RF models, a discernible distinction in accuracy was observed. Despite rigorous hyperparameter adjustments, both SVC and RF models consistently outperformed KNN. The inherent complexities of diabetes data, which frequently involve non-linear interrelations among its predictors, likely contributed to these discrepancies. Specifically, the RF model, leveraging its ensemble of decision trees, excels in navigating these non-linear intricacies. On the other hand, the linear SVC adeptly delineates data points in high-dimensional spaces by establishing optimal hyperplanes and optimizing the separation margin between classes. Such a method of separation often transcends the capabilities of distance-centric models like KNN. The latter primarily anchors its predictions on local patterns, potentially overlooking broader relationships or subtle variable interactions intrinsic to the dataset.
Despite the various applications of machine learning techniques, the predictive accuracies hovered around the 75% mark. This is indicative of the intricate nature of diabetes, which is a tapestry of genetic, environmental, and lifestyle determinants. The available dataset, while comprehensive, may still fall short in capturing all nuances essential for prediction, especially given potential data quality issues or the inherent limitations in feature representation. Additionally, the models carry inherent assumptions about data that may not fully resonate with the actual dataset characteristics. The size and diversity of our dataset, though substantial, might not be expansive enough to train models to higher accuracies. Thus, the achieved accuracy underscores both the achievements and inherent challenges in leveraging data-driven approaches for complex medical predictions.
3.2. Feature importance
Given the intricacies of diabetes as a medical condition and its multifactorial etiology, feature importance is vital in underscoring the predominant influencers in the diagnosis. Depending on the nature of the algorithm, we computed feature importances using either the algorithm’s inherent mechanism or the permutation importance method. The visual representation of each feature’s significance across KNN, RF, and SVC models is depicted in Figure 1. The feature importances among the bins of each feature for KNN, RF, and SVC are illustrated in Figure 2, Figure 3, and Figure 4, respectively. By cross-examining these plots, one can discern shared patterns or variances in how each model weights the importance of individual features, shedding light on potential avenues for further research or clinical examination.
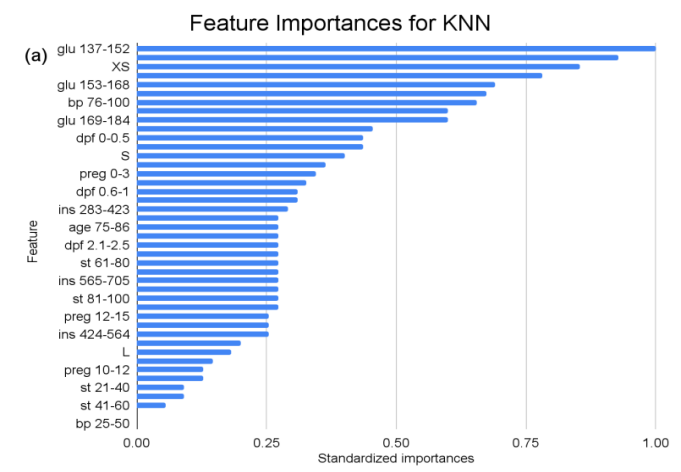
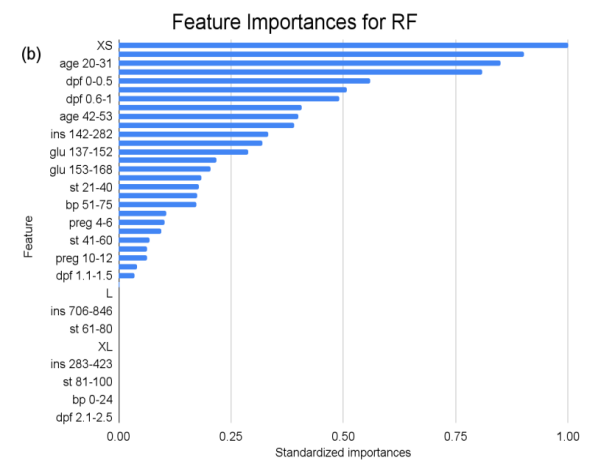
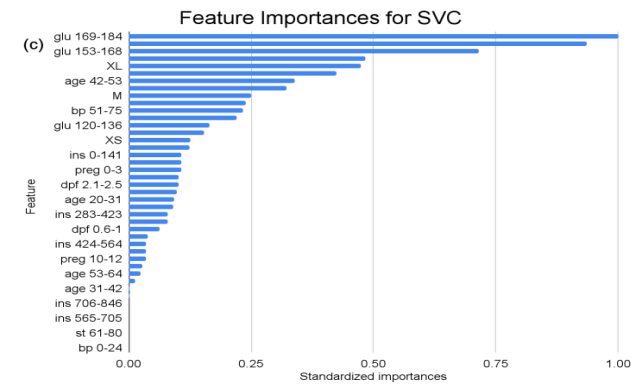
Figure 1. Feature importances across all predictor variables in KNN, RF, and SVC models. (a) depicts the standardized feature importances across all features for the KNN model. (b) depicts the standardized feature importances across all features for the RF model. (c) depicts the standardized feature importances across all features for the SVC model.
For the KNN model, features pertaining to “glu” (Glucose) ranges consistently emerge across different categories, exemplifying the critical role glucose level plays in the KNN classification. Likewise, various intervals of “ins” (Insulin) reiterate its substantial importance. Pregnancies, represented as “preg”, span multiple categories, suggesting their multifaceted influence. The scope of standardized importances, ranging from the peak at “1” to the bottom at “0”, illuminates a gradient of influence, with “glu” and “ins” emerging as possibly more pivotal than others in the KNN’s classification construct.
In the feature importance ranking of the RF model, “XS” (BMI 0-20) manifests as the preeminent feature, holding standardized importance of “1”. Attributes such as “ins 0-141” (Insulin), “age 20-31” (Age), and “glu 169-184” (Glucose) exhibit significant influences, with values hovering around 0.9, 0.85, and 0.81, respectively. These factors underscore their fundamental roles in the model’s ensemble decision-making. Conversely, several attributes like “L” (BMI), “age 75-86” (Age), and multiple “ins” (Insulin) intervals beyond 282 exhibit zero importance, suggesting that within this model, they hold limited or no sway.
In the context of the SVC analysis, the attribute “glu” (Glucose) consistently emerges as a paramount determinant, particularly in the ranges “glu 169-184” and “glu 185-200”, exhibiting standardized importances of 1 and approximately 0.936 respectively. This dominance reiterates the pivotal role glucose levels occupy in the SVC’s classification strategy. Moreover, the recurrent prominence of glucose across multiple intervals accentuates its central significance in the model’s decision-making matrix. Conversely, certain features, such as “ins 706-846” (Insulin), “age 75-86” (Age), and “st 61-80” (Skin Thickness) among others, hold standardized importance of zero, implying their minimal or non-existent influence within the SVC’s predictive framework.
When juxtaposing the results of the KNN, RF, and SVC models, distinct patterns emerge. SVC notably highlights the significance of “glu” (Glucose) across several ranges, whereas in RF, a broader set of features including “ins” (Insulin) and “age” plays a central role. KNN, on the other hand, presents a mix of influential features, with both “glu” (Glucose) and “ins” (Insulin) appearing frequently across various ranges. Furthermore, while certain features such as “age 75-86” are deemed negligible in RF, they acquire moderate importances in SVC. Such differences underscore the varied methodologies each model employs and how each feature’s significance can pivot based on the underlying model’s mechanics.
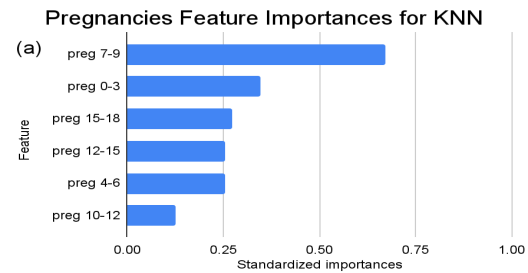
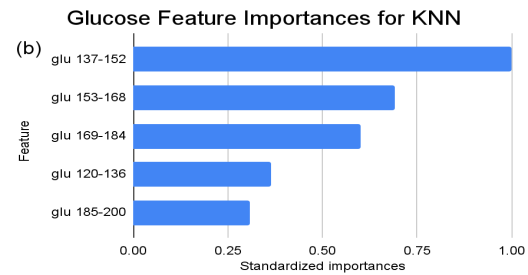
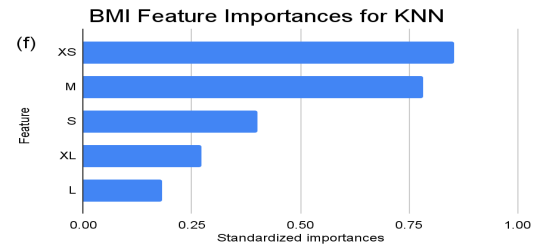
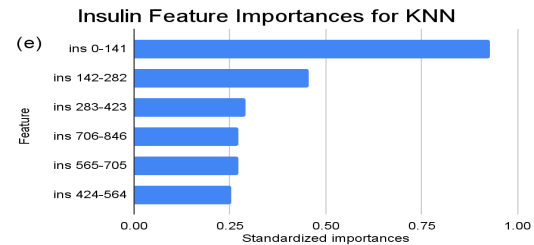
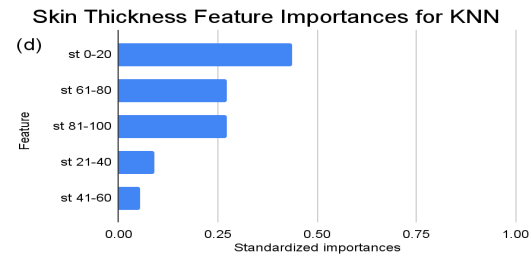
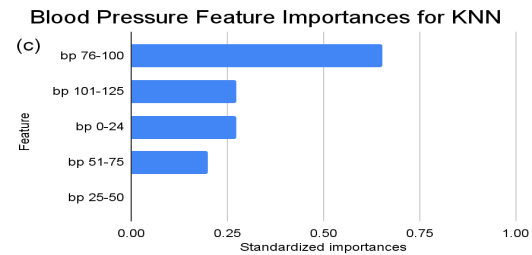
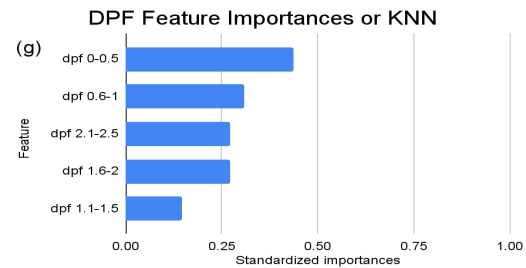
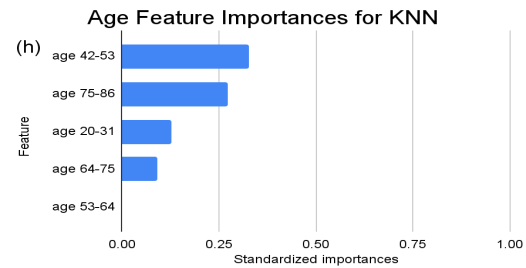
Figure 2. Standardized feature importances in each predictor variable for KNN, specified by bins. (a) depicts the feature importances within the pregnancies feature. (b) depicts the feature importances within the glucose feature. (c) depicts the feature importances within the blood pressure feature. (d) depicts the feature importances within the skin thickness feature. (e) depicts the feature importances within the insulin feature. (f) depicts the feature importances within the BMI feature. All graphs are ranked in descending order.
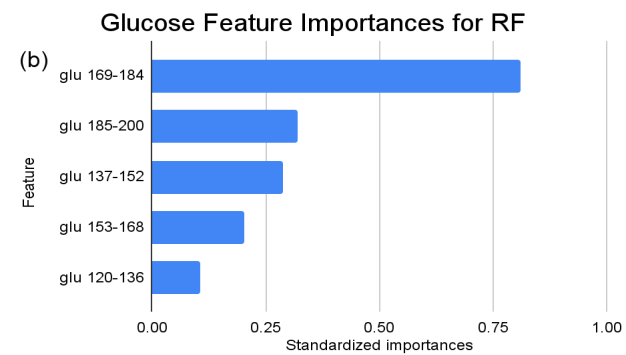
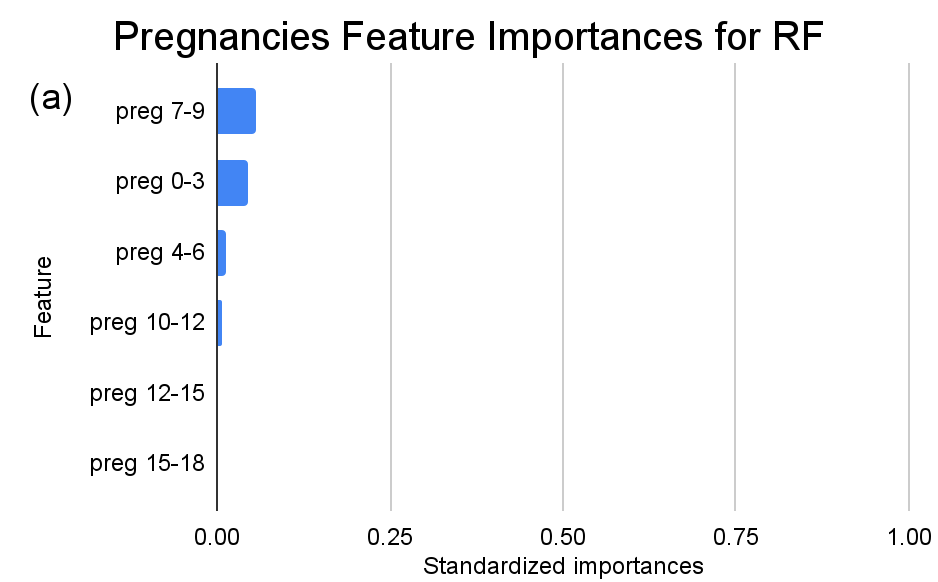
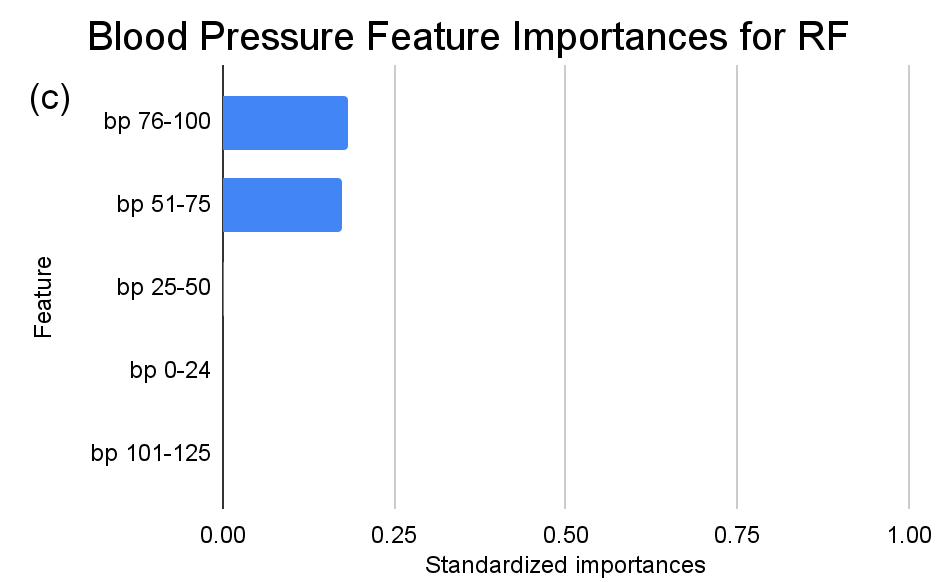
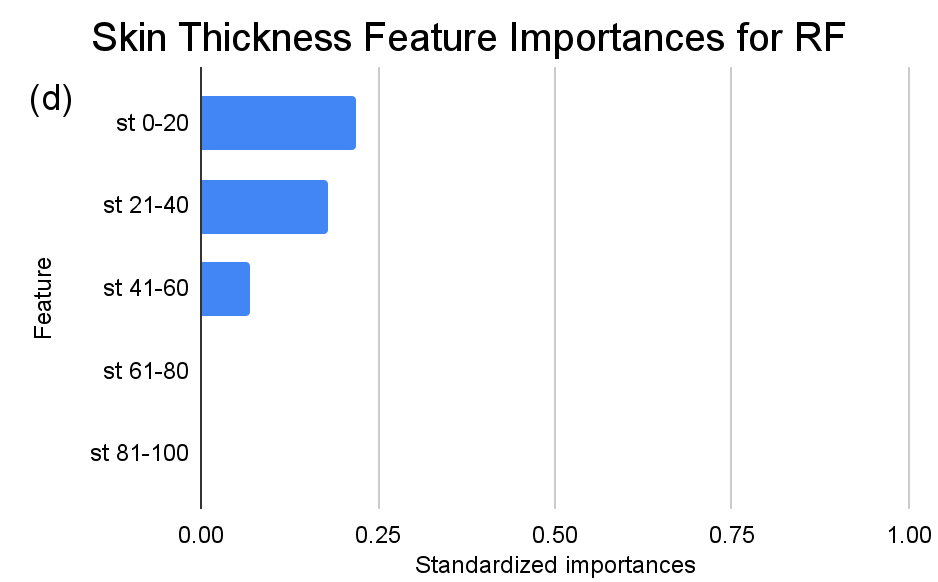
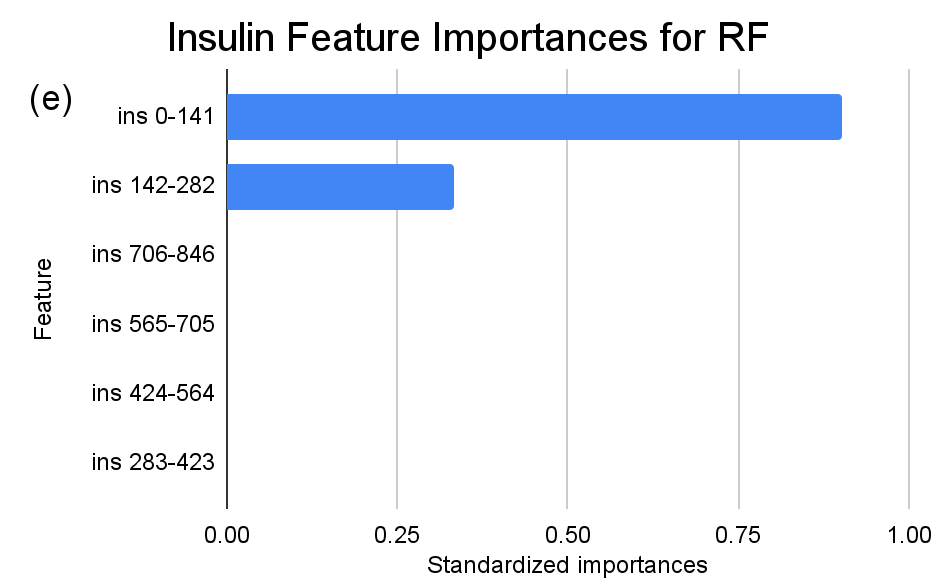

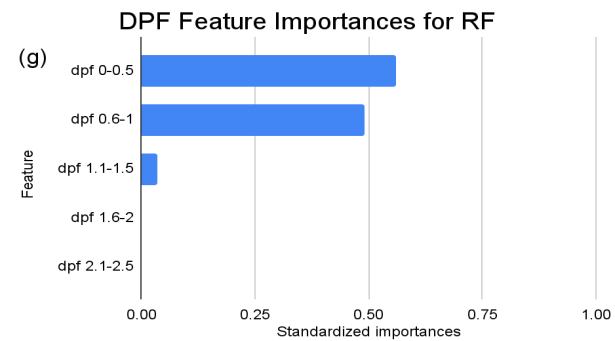
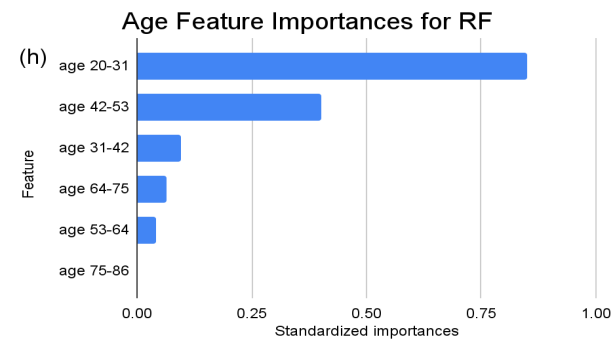
Figure 3. Standardized feature importances in each predictor variable for RF, specified by bins. (a) depicts the feature importances within the pregnancies feature. (b) depicts the feature importances within the glucose feature. (c) depicts the feature importances within the blood pressure feature. (d) depicts the feature importances within the skin thickness feature. (e) depicts the feature importances within the insulin feature. (f) depicts the feature importances within the BMI feature. All graphs are ranked in descending order.
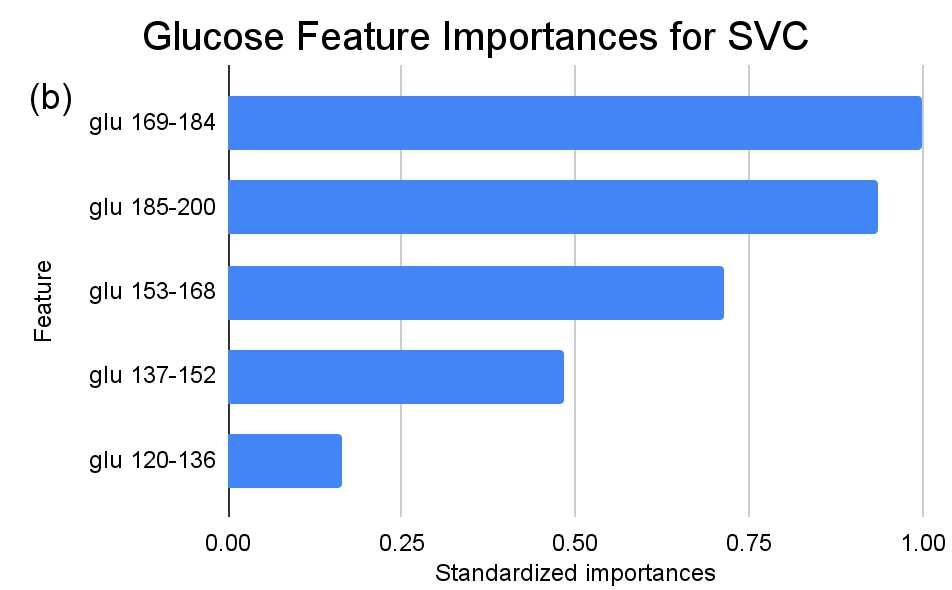
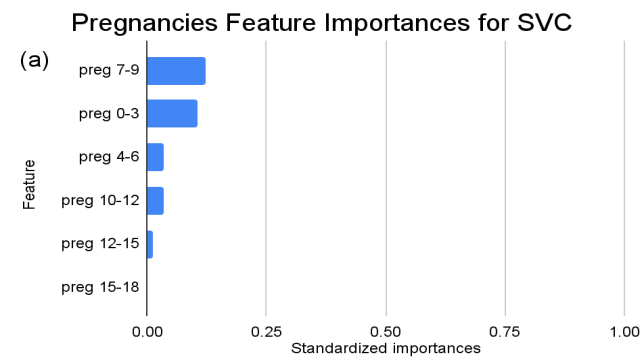
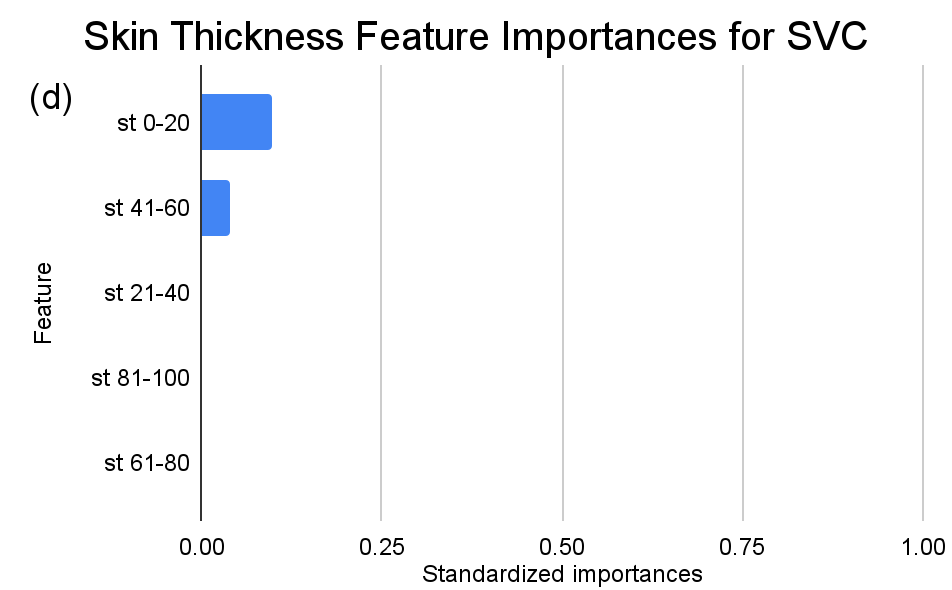
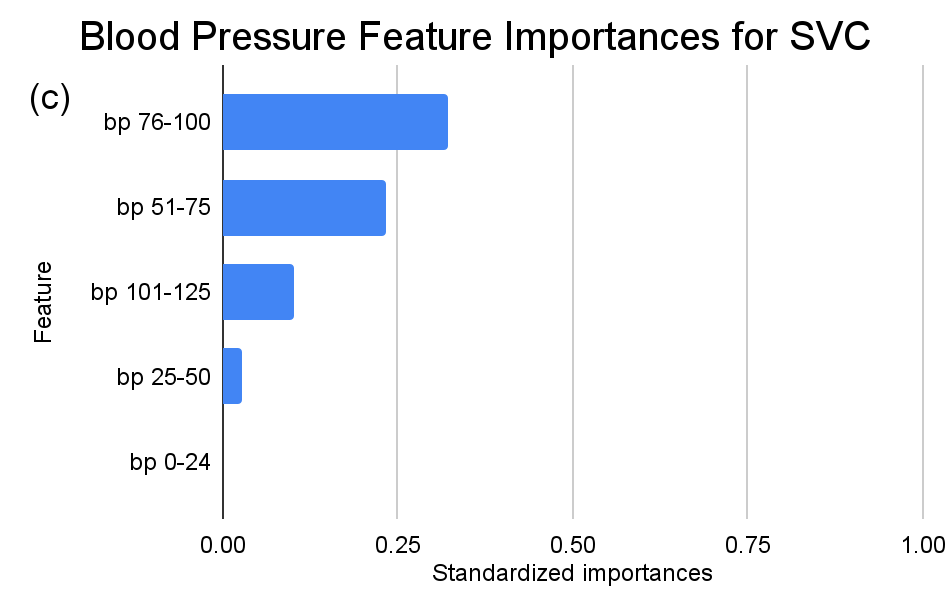
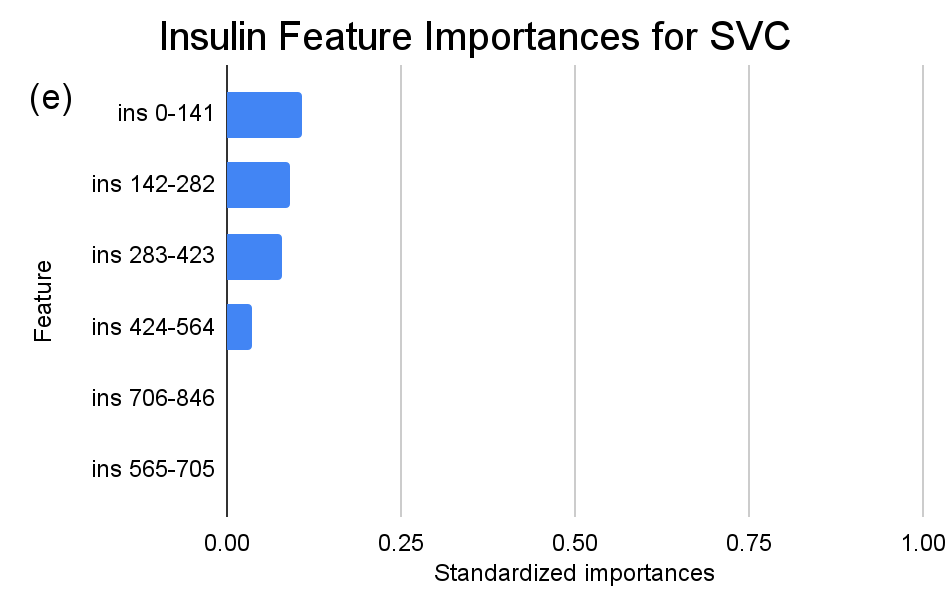
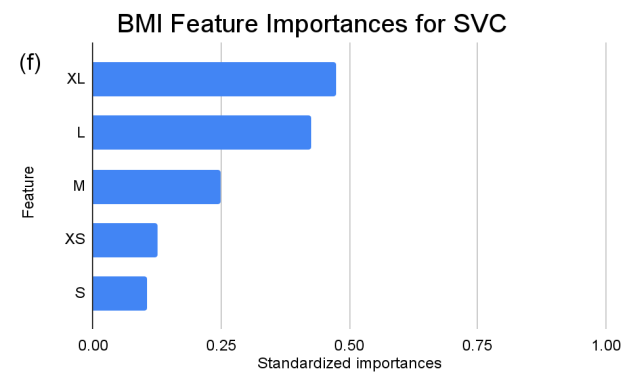
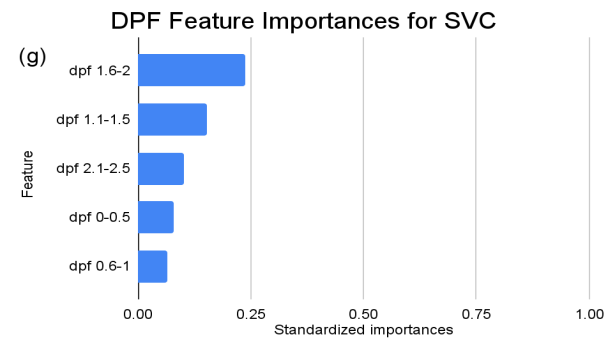
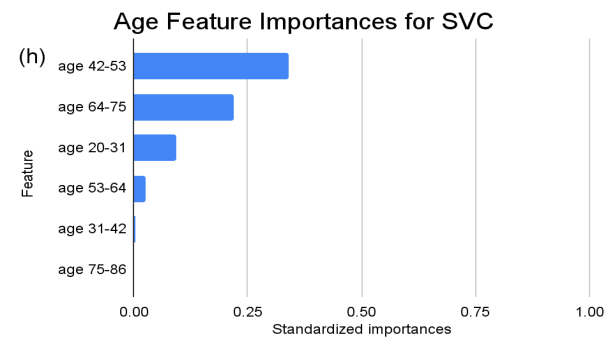
Figure 4. Standardized feature importances in each predictor variable for SVC, specified by bins. (a) depicts the feature importances within the pregnancies feature. (b) depicts the feature importances within the glucose feature. (c) depicts the feature importances within the blood pressure feature. (d) depicts the feature importances within the skin thickness feature. (e) depicts the feature importances within the insulin feature. (f) depicts the feature importances within the BMI feature. All graphs are ranked in descending order.
Delving deeper into feature importances, the intricate subtlenesses between models becomes evident (Figure 2-4). Each model responds distinctly to subcategories within the overarching features, underscoring the inherent methodologies and data sensitivities unique to each algorithm.
For instance, within the KNN model, the insulin range “ins 0-141” (Insulin) retains a prominent standardized importance of approximately 0.927. Yet, as insulin level increases, a tapering of importance is evident, with the “ins 142-282” (Insulin) bracket holding a value of approximately 0.455 and further diminishing for subsequent ranges. The RF model, in its ensemble strategy, similarly underscores the significance of the “ins 0-141” (Insulin) category, holding an importance close to 0.902. However, the subsequent categories manifest a sharp decline, with “ins 142-282” (Insulin) at approximately 0.333 and a variety of ranges holding zero importance, highlighting the model’s discerning feature prioritization.
In contrast, as for the SVC model, the distinctions are subtler between insulin level bins. The “ins 0-141” (Insulin) range is drastically less dominant compared to KNN and RF, with an importance value of approximately 0.107. A gentle decline across subsequent ranges is also observed, but the overall span of importances between the highest and lowest non-zero values is considerably narrower than the other two models.
This pattern is emblematic of a broader trend across all features, not just “ins”. Each model, with its unique analytical lens, extrapolates distinct patterns within the granular categories of overarching features. Such variability reinforces the need for a holistic evaluation, taking into account both the broader feature importances and the nuanced subtleties within each feature’s subcategories, to effectively discern the most informative predictors and derive actionable insights. Therefore, it is worth noting that T2DM prediction cannot be made solely based on one machine learning framework, and a larger sample size and greater variety of predictor variables will make the predictions more accurate and realistic.
4. Conclusion
Diabetes, particularly T2DM, presents a significant global health challenge with wide-reaching implications for affected individuals and healthcare systems. The escalating prevalence of obesity, especially in the United States, suggestes that there is a pressing need for early detection and intervention for T2DM. Fortunately, the chornic and reversible nature of T2DM indicate early detection is feasible. In this research, the performances of three supervised machine learning algorithms, KNN, RF and SVC, were critically evaluated on the PIDD dataset. Our findings reveal that RF exhibited the highest predictive accuracy at 75.25%, likely due to its usage of individual decision trees, while SVC and KNN followed closely with a 74.92% accuracy rate and a 71.01% accuracy rate, respectively. A noteworthy observation from our analysis was the varying feature importances across the algorithms, emphasizing the necessity to interpret machine learning results with discernment, especially when transitioning these findings to real-world clinical applications.
Looking ahead, this paper proposes expanding the scope of machine learning approaches utilized in T2DM prediction research, in order to achieve higher accuracy and maintain consistent feature selections. This includes exploring unsupervised learning, reinforcement learning, and neural network and deep learning paradigms. What’s more, incorporating additional clinically relevant predictors, such as hemoglobin A1c (HbA1c) levels and physical activity metrics, would further refine and enhance the predictability and relevance of these models. As people harness the capabilities of machine learning and artificial intelligence, it is imperative to strike a balance between computational accuracy and clinical interpretability, ensuring we make strides towards the overarching goal of mitigating the impact of this preventable disease.
References
[1]. VijiyaKumar K., Lavanya B., Nirmala I., Caroline SS. Random Forest Algorithm for the Prediction of Diabetes. In: 2019 IEEE International Conference on System, Computation, Automation and Networking (ICSCAN) [Internet]. Pondicherry, India: IEEE; 2019 [cited 2023 Sep. 15]. pp. 1–5. https://ieeexplore.ieee.org/document/8878802/.
[2]. Centers for Disease Control and Prevention. Diabetes Basics. October 25, 2022. Accessed September 15, 2023. https://www.cdc.gov/diabetes/basics/index.html.
[3]. Chaki J., Thillai Ganesh S., Cidham S.K., Ananda Theertan S. Machine learning and artificial intelligence based Diabetes Mellitus detection and self-management: A systematic review. Journal of King Saud University-Computer and Information Sciences. 2022 Jun; 34(6):3204–25.
[4]. Smith J.W., Everhart J.E., Dickson W.C., Knowler W.C., Johannes R.S. Using the ADAP Learning Algorithm to Forecast the Onset of Diabetes Mellitus. Proc Annu Symp Comput Appl Med Care. 1988 November 9; pp.261–5.
[5]. Xu W., Zhang J., Zhang Q., Wei X. Risk prediction of type II diabetes based on random forest model. In: 2017 Third International Conference on Advances in Electrical, Electronics, Information, Communication and Bio-Informatics (AEEICB) [Internet]. Chennai, India: IEEE; 2017 [cited 2023 Sep 15]. pp. 382–6. http://ieeexplore.ieee.org/document/7972337/.
[6]. Sneha N., Gangil T. Analysis of diabetes mellitus for early prediction using optimal features selection. J Big Data. 2019 Dec;6(1):13.
[7]. Abdulhadi N., Al-Mousa A. Diabetes Detection Using Machine Learning Classification Methods. In: 2021 International Conference on Information Technology (ICIT) [Internet]. Amman, Jordan: IEEE; 2021 [cited 2023 September 15]. pp. 350–4. https://ieeexplore.ieee.org/document/9491788/.
[8]. Patil V., Ingle DR. Comparative Analysis of Different ML Classification Algorithms with Diabetes Prediction through Pima Indian Diabetics Dataset. In: 2021 International Conference on Intelligent Technologies (CONIT) [Internet]. Hubli, India: IEEE; 2021 [cited 2023 Sep 15]. pp. 1–9. https://ieeexplore.ieee.org/document/9498361/.
[9]. Sapra A., Bhandari P. Diabetes. In: StatPearls [Internet]. Treasure Island (FL): StatPearls Publishing; 2023. https://www.ncbi.nlm.nih.gov/books/NBK551501/.
[10]. Pedregosa F., Varoquaux G., Gramfort A., Michel V., Thirion B., Grisel O., et al. Scikit-learn: Machine Learning in Python. Journal of Machine Learning Research. 2011;12(85):2825–30.
[11]. Bhat S.S., Selvam V., Ansari G.A., Ansari M.D. Analysis of Diabetes mellitus using Machine Learning Techniques. In: 2022 5th International Conference on Multimedia, Signal Processing and Communication Technologies (IMPACT) [Internet]. Aligarh, India: IEEE; 2022 [cited 2023 Sep 15]. pp. 1–5. https://ieeexplore.ieee.org/document/10029058/.
Cite this article
Li,Z. (2024). Comparative analysis of machine learning algorithms for Diabetes Mellitus prediction. Applied and Computational Engineering,50,157-169.
Data availability
The datasets used and/or analyzed during the current study will be available from the authors upon reasonable request.
Disclaimer/Publisher's Note
The statements, opinions and data contained in all publications are solely those of the individual author(s) and contributor(s) and not of EWA Publishing and/or the editor(s). EWA Publishing and/or the editor(s) disclaim responsibility for any injury to people or property resulting from any ideas, methods, instructions or products referred to in the content.
About volume
Volume title: Proceedings of the 4th International Conference on Signal Processing and Machine Learning
© 2024 by the author(s). Licensee EWA Publishing, Oxford, UK. This article is an open access article distributed under the terms and
conditions of the Creative Commons Attribution (CC BY) license. Authors who
publish this series agree to the following terms:
1. Authors retain copyright and grant the series right of first publication with the work simultaneously licensed under a Creative Commons
Attribution License that allows others to share the work with an acknowledgment of the work's authorship and initial publication in this
series.
2. Authors are able to enter into separate, additional contractual arrangements for the non-exclusive distribution of the series's published
version of the work (e.g., post it to an institutional repository or publish it in a book), with an acknowledgment of its initial
publication in this series.
3. Authors are permitted and encouraged to post their work online (e.g., in institutional repositories or on their website) prior to and
during the submission process, as it can lead to productive exchanges, as well as earlier and greater citation of published work (See
Open access policy for details).
References
[1]. VijiyaKumar K., Lavanya B., Nirmala I., Caroline SS. Random Forest Algorithm for the Prediction of Diabetes. In: 2019 IEEE International Conference on System, Computation, Automation and Networking (ICSCAN) [Internet]. Pondicherry, India: IEEE; 2019 [cited 2023 Sep. 15]. pp. 1–5. https://ieeexplore.ieee.org/document/8878802/.
[2]. Centers for Disease Control and Prevention. Diabetes Basics. October 25, 2022. Accessed September 15, 2023. https://www.cdc.gov/diabetes/basics/index.html.
[3]. Chaki J., Thillai Ganesh S., Cidham S.K., Ananda Theertan S. Machine learning and artificial intelligence based Diabetes Mellitus detection and self-management: A systematic review. Journal of King Saud University-Computer and Information Sciences. 2022 Jun; 34(6):3204–25.
[4]. Smith J.W., Everhart J.E., Dickson W.C., Knowler W.C., Johannes R.S. Using the ADAP Learning Algorithm to Forecast the Onset of Diabetes Mellitus. Proc Annu Symp Comput Appl Med Care. 1988 November 9; pp.261–5.
[5]. Xu W., Zhang J., Zhang Q., Wei X. Risk prediction of type II diabetes based on random forest model. In: 2017 Third International Conference on Advances in Electrical, Electronics, Information, Communication and Bio-Informatics (AEEICB) [Internet]. Chennai, India: IEEE; 2017 [cited 2023 Sep 15]. pp. 382–6. http://ieeexplore.ieee.org/document/7972337/.
[6]. Sneha N., Gangil T. Analysis of diabetes mellitus for early prediction using optimal features selection. J Big Data. 2019 Dec;6(1):13.
[7]. Abdulhadi N., Al-Mousa A. Diabetes Detection Using Machine Learning Classification Methods. In: 2021 International Conference on Information Technology (ICIT) [Internet]. Amman, Jordan: IEEE; 2021 [cited 2023 September 15]. pp. 350–4. https://ieeexplore.ieee.org/document/9491788/.
[8]. Patil V., Ingle DR. Comparative Analysis of Different ML Classification Algorithms with Diabetes Prediction through Pima Indian Diabetics Dataset. In: 2021 International Conference on Intelligent Technologies (CONIT) [Internet]. Hubli, India: IEEE; 2021 [cited 2023 Sep 15]. pp. 1–9. https://ieeexplore.ieee.org/document/9498361/.
[9]. Sapra A., Bhandari P. Diabetes. In: StatPearls [Internet]. Treasure Island (FL): StatPearls Publishing; 2023. https://www.ncbi.nlm.nih.gov/books/NBK551501/.
[10]. Pedregosa F., Varoquaux G., Gramfort A., Michel V., Thirion B., Grisel O., et al. Scikit-learn: Machine Learning in Python. Journal of Machine Learning Research. 2011;12(85):2825–30.
[11]. Bhat S.S., Selvam V., Ansari G.A., Ansari M.D. Analysis of Diabetes mellitus using Machine Learning Techniques. In: 2022 5th International Conference on Multimedia, Signal Processing and Communication Technologies (IMPACT) [Internet]. Aligarh, India: IEEE; 2022 [cited 2023 Sep 15]. pp. 1–5. https://ieeexplore.ieee.org/document/10029058/.