


1 Introduction
Machine learning, an exceptionally vibrant and transformative branch of artificial intelligence, is committed to developing and refining algorithms and models that empower computers to autonomously learn, discern patterns, and make decisions from vast datasets independent of explicit human instruction [1]. This domain’s paramount challenge is enabling machines to autonomously enhance their performance through rigorous data analysis and accumulated experiential learning, evident across various applications such as prediction, classification, and clustering [2]. The adaptive and self-optimizing capabilities of machine learning algorithms, propelled by input data and feedback mechanisms, play a pivotal role in augmenting algorithmic efficiency and precision. Nonetheless, the field faces numerous challenges and dilemmas, particularly in deploying clustering algorithms.
As an indispensable unsupervised learning technique in machine learning, clustering algorithms endeavor to segregate samples within a dataset into distinct clusters or groups predicated on inherent similarities [3]. This methodology strives to unearth and comprehend latent data structures and patterns devoid of a priori knowledge, including sample labels or categorizations. Despite the significant application prospects of clustering algorithms across diverse arenas such as data analytics, image, and speech processing, social network analysis, and bioinformatics, several unresolved issues persist, including the precise determination of cluster quantities, the efficacious management of high-dimensional data, and the enhancement of algorithmic generality and interpretability.
Within data analytics, clustering algorithms are instrumental in extracting vital insights into consumer behaviors and market trends amid the expanse of big data. In image and speech processing domains, these algorithms substantially augment the efficiency of information retrieval and classification by aggregating similar images or speech samples [4]. The application of clustering algorithms in social network analysis aids in identifying user group behavior patterns and preferences, offering robust support for personalized recommendations and targeted advertising. Furthermore, in bioinformatics, clustering algorithms are pivotal in exploring gene functionalities and disease mechanisms through the analysis of gene expression data [5].
However, the practical deployment of clustering algorithms is not devoid of challenges. The selection of an apt clustering algorithm necessitates a thorough evaluation of the data characteristics, clustering objectives, and the algorithm’s performance and constraints. This paper aims to methodically review and discuss the categorization, fundamental principles, and application instances of clustering algorithms across various sectors. Specifically, it addresses the challenges encountered by clustering algorithms, such as determining cluster numbers, managing high-dimensional data and data noise impacts, improving clustering result interpretability, and proposing viable solutions. Through a critical review of seminal literature and an assessment of the strengths and weaknesses of specific clustering methodologies, this paper guides the further refinement and optimization of clustering algorithms, thereby outlining potential future research trajectories in machine learning.
2 Literature Review
The origin of clustering algorithms dates back to the 1950s, marking the intersection of statistics and computer science. During this period, scholars explored how to partition samples in a dataset into clusters based on similarity, initiating the research chapter on clustering algorithms. Early algorithms primarily utilized distance-based methods, such as the K-means algorithm proposed by J. MacQueen in 1967, which iteratively partitions samples based on the average distance to cluster centroids. Despite being straightforward, it is sensitive to the initial center selection and struggles with non-convex-shaped datasets [6].
Subsequently, hierarchical clustering algorithms gained attention, especially the Ward algorithm proposed by J. Ward in 1963. These algorithms consider both distance or similarity between samples and introduce the concept of a hierarchical structure, making the clustering process more detailed and layered. The Ward algorithm focuses on minimizing the variance within clusters, ensuring precise merging in each step [7]. In the 1980s and 1990s, density-based clustering methods emerged. Among them, the DBSCAN algorithm proposed by M. Ester et al. in 1996 became a significant milestone. DBSCAN defines core and boundary points based on a density threshold around sample points, effectively handling non-spherical structures and noisy data, profoundly influencing the development of clustering algorithms [8].
Entering the 21st century, the research direction of clustering algorithms has become more diverse. New algorithms, such as spectral clustering, complemented traditional distance and density-based methods. Based on graph theory, spectral clustering constructs a similarity graph of sample points and utilizes spectral properties for effective data segmentation, which is particularly suitable for handling complex network structures [9]. Meanwhile, probability models play a crucial role in clustering algorithms, exemplified by the Gaussian Mixture Model (GMM). GMM assumes data is composed of multiple Gaussian distributions and estimates the parameters of these distributions to determine the cluster to which each sample belongs. This approach demonstrates its advantages in handling fuzzy and overlapping datasets [10].
Recently, with the rapid development of deep learning, deep learning-based clustering algorithms have gradually emerged. Algorithms like autoencoders discover latent clustering structures by learning deep representations of data, offering new possibilities for handling high-dimensional and complex datasets [11]. Overall, clustering algorithms, since their inception from simple distance-based methods, have evolved into diverse and complex approaches. They have made significant theoretical progress and demonstrated their powerful practical value in various application domains.
3 Research Methodology
3.1 Dataset
The cornerstone of this investigation is the Iris dataset, a benchmark in machine learning research characterized by its ubiquity and exemplary representation of multidimensional data. Comprising 150 observations, the dataset encapsulates four distinct features: sepal length, sepal width, petal length, and petal width, distributed across three species—namely, Iris-setosa, Iris-versicolor, and Iris-virginica. The dataset’s well-balanced structure and attribute diversity render it an optimal resource for evaluating the performance and applicability of clustering algorithms. Before the clustering analysis, the dataset underwent a series of preprocessing steps to ensure data integrity and uniformity. These steps included data cleaning to rectify or remove erroneous and missing data points, and normalization to standardize the range of feature values, thereby mitigating potential bias induced by disparate measurement scales.
Principal Component Analysis (PCA) was applied to the Iris dataset to address the challenges posed by high-dimensional data. PCA facilitated a reduction in the dimensionality of the feature space while preserving the variance of the dataset, thereby simplifying the data structure and reducing computational demands for the ensuing clustering tasks. For the clustering analysis, three algorithms were meticulously selected based on their prevalence and versatility in addressing varied data structures: the K-means, hierarchical clustering, and DBSCAN algorithms. This selection criteria ensured a comprehensive evaluation across algorithms renowned for their efficacy in different clustering scenarios. The analysis aimed to elucidate each algorithm’s applicability and performance metrics when applied to the Iris dataset, thus providing a nuanced understanding of their operational characteristics and suitability for diverse clustering tasks. Table 1 shows the dataset as follows:
Sepal Length |
Sepal Width |
Petal Length |
Petal Width |
Species |
5.1cm |
3.5cm |
1.4cm |
0.2cm |
Setosa |
6.2cm |
2.9cm |
4.3cm |
1.3cm |
Versicolor |
7.3cm |
2.9cm |
6.3cm |
1.8cm |
Virginica |
4.9cm |
3.6cm |
1.4cm |
0.1cm |
Setosa |
6.4cm |
2.8cm |
5.6cm |
2.2cm |
Virginica |
Table 1. Example of Iris Flower Dataset.
3.2 Algorithm Introduction
This research integrates the use of three distinct clustering algorithms to analyze the Iris dataset, specifically chosen for their representativeness and versatility in addressing the clustering challenge: the K-means algorithm, the hierarchical clustering algorithm, and the DBSCAN algorithm. The selection aims to elucidate these algorithms’ comparative performance and applicability in resolving the Iris flower clustering conundrum.
The K-means algorithm, a cornerstone in distance-based clustering, operates on the principle of optimizing cluster centroids through an iterative refinement process to partition data effectively. Initiation occurs with the random selection of K centroids, followed by assigning each data point to the nearest cluster based on the principle of minimal distance. Subsequent iterations recalibrate the centroids until the shift in their positions falls beneath a predefined threshold or a specified iteration count is achieved, thereby ensuring convergence to an optimal solution.
Characterized by its construction of a multi-tiered hierarchical structure of clusters, typically visualized as a dendrogram, the hierarchical clustering algorithm commences with each data point as a solitary cluster. It progressively amalgamates the proximally closest clusters, continuing this amalgamation until it culminates in a singular encompassing cluster or satisfies an established termination criterion. This method’s flexibility in not necessitating a pre-specified cluster count allows for the extraction of clustering at various resolutions by interpreting the dendrogram and applying suitable cutoffs.
The DBSCAN algorithm, renowned for its proficiency in identifying clusters of arbitrary shape and its robustness against outlier data points, operates on density-based spatial clustering. Initiating from an arbitrary unvisited point, it probes the neighborhood density and, contingent on a predefined density threshold, either inaugurates a new cluster or classifies the point as noise. Through the principle of density reachability, it expands existing clusters by annexing adjacent density-connected points, thereby facilitating the organic growth of clusters.
3.3 Experimental Evaluation Methods
The evaluation of experimental results mainly relies on accuracy metrics. We compare the clustering results obtained by clustering algorithms with the ground truth labels to calculate the accuracy of clustering algorithms. A higher accuracy indicates a more accurate classification of Iris flowers by the clustering algorithm. We also compare different clustering algorithms using metrics such as the Calinski-Harabasz index, silhouette coefficient, Davies-Bouldin index, etc.
The Calinski-Harabasz index (also known as the variance ratio criterion) is an indicator used to evaluate the effectiveness of clustering results. It measures the compactness and separability of clusters based on the ratio of within-cluster variance to between-cluster variance. A higher Calinski-Harabasz index indicates higher compactness and better separability of clustering results, indicating better clustering effectiveness.
The silhouette coefficient is an indicator used to evaluate the compactness and separability of clustering results. It measures the quality of clustering based on the difference between the similarity of a sample with its assigned cluster and the similarity with the nearest neighboring cluster. The value of the silhouette coefficient ranges from -1 to 1, where a value closer to 1 indicates high similarity within the cluster and low similarity with other clusters, indicating better clustering effectiveness. A value closer to -1 indicates low similarity within the cluster and high similarity with other clusters, indicating poorer clustering effectiveness. A value close to 0 indicates similar similarity within and with other clusters, indicating average clustering effectiveness.
The Davies-Bouldin index (DB index) is an indicator used to evaluate the effectiveness of clustering results. It measures the quality of clustering based on the compactness within clusters and the separation between clusters. A smaller DB index value indicates higher compactness and better separation of clustering results, indicating better clustering effectiveness. Therefore, the DB index can be used to compare the quality of clustering results under different clustering algorithms or parameter settings. A smaller DB index indicates better clustering results.
Furthermore, to visually display the experimental results, we will use scatter plots and markers for cluster centroids to show the clustering results of Iris flowers. The horizontal and vertical axes of the scatter plot represent two principal components, and different categories of Iris flower samples are marked with different colors. In contrast, cluster centroids are represented with special markers. By analyzing and comparing the experimental results, we can observe the distribution of different categories of Iris flowers in the feature space. Suppose the clustering algorithm can group Iris flower samples of the same category together, and there is clear separation between Iris flower samples of different categories. In that case, it indicates better classification effectiveness of the clustering algorithm.
4 Research Experiment
4.1 Environment Setup
This study’s experimental computer configuration consisted of an AMD Ryzen R7-6800H processor, 16GB of memory, and the Windows 11 operating system. The version of the Scikit-learn library used in the experiment was 0.21.3. The implementation used the Python programming language with a version of 3.7.4.
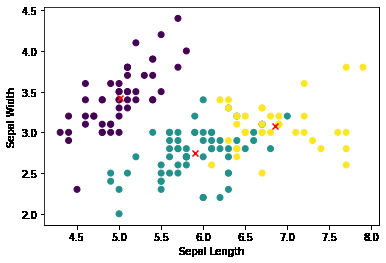
Figure 1. Results of clustering the Iris flower dataset using the K-means algorithm.
As illustrated in Figure 1, the initial phase of our analysis involved applying the K-means clustering algorithm to the Iris dataset to categorize the data into three distinct clusters. After the algorithmic assignment of each data sample to a specific cluster, we proceeded to visualize these classifications through a scatter plot. This visualization delineated disparate clusters using varying color codes, facilitating an intuitive understanding of the dataset’s division. Crucially, the cluster centroids were highlighted using red “X” markers, serving as a focal point for each cluster and symbolizing the algorithm’s determination of the central point within each group. This visualization step was integral to assessing the spatial distribution and cohesion of the clusters formed by the K-means algorithm. To evaluate the clustering outcome quantitatively, we employed a suite of metrics: the accuracy, Calinski-Harabasz index, silhouette coefficient, and Davies-Bouldin index. These metrics were chosen for their capacity to provide a multidimensional assessment of the clustering results, encompassing aspects of accuracy, compactness, separation, and overall quality. The computational results of these evaluative metrics are meticulously tabulated in Table 2.
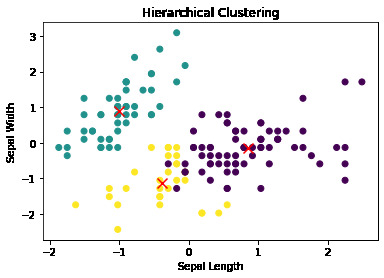
Figure 2. Results of clustering the Iris flower dataset using the hierarchical clustering algorithm.
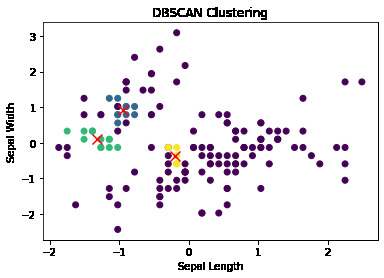
In the exploration depicted in Figure 3, the study advances through the application of the DBSCAN clustering algorithm to the standardized Iris dataset. This process commenced with a standardization procedure to ensure uniformity in data scale, a prerequisite for the effective application of the DBSCAN algorithm. This algorithm, renowned for its ability to identify clusters of arbitrary shapes and sizes, was then employed to categorize the dataset into distinct clusters based on density criteria. The categorization results were visualized through a scatter plot, employing varying colors to denote the different clusters identified by the DBSCAN algorithm. This visualization facilitates an intuitive comprehension of the clustering distribution and the algorithm’s effectiveness in segregating the dataset into coherent groups. For a comprehensive assessment of the clustering quality achieved through the DBSCAN algorithm, the study calculated several evaluative metrics: accuracy, Calinski-Harabasz index, silhouette score, and Davies-Bouldin index. These metrics quantify the accuracy of cluster assignments against known labels, the compactness and separation of clusters, and the overall efficacy of the clustering process. The quantitative findings from these metrics are consolidated in Table 2, providing a detailed account of the DBSCAN algorithm’s performance in clustering the Iris dataset. This allows for an informed comparison of the DBSCAN algorithm’s results with those obtained from other clustering methodologies applied in this study.
Table 2. Four Metrics Generated by Three Clustering Algorithms on the Iris Dataset
(Results Rounded to Two Decimal Places).
accuracy |
Calinski-Harabasz index |
silhouette coefficient |
Davies-Bouldin index |
|
K-means algorithm |
0.89 |
561.63 |
0.55 |
0.66 |
hierarchical clustering algorithm |
0.81 |
222.72 |
0.45 |
0.80 |
DBSCAN algorithm |
0.09 |
16.88 |
- 0.19 |
2.14 |
Table 2 provides a comparative analysis of the performance of three clustering algorithms—K-means, hierarchical, and DBSCAN—on the Iris dataset, utilizing four evaluative metrics: accuracy, Calinski-Harabasz index, silhouette coefficient, and Davies-Bouldin index. The results, rounded to two decimal places, reveal significant differences in algorithm efficacy. The K-means algorithm exhibits robust performance with an accuracy of 0.89, indicating a high degree of correctness in cluster assignment. This is further supported by a Calinski-Harabasz index of 561.63, suggesting effective cluster compactness and separation, alongside a silhouette coefficient of 0.55, which denotes strong within-cluster similarity and between-cluster dissimilarity.
The Davies-Bouldin index of 0.66 indicates lower intra-cluster variance and higher inter-cluster separation, corroborating the algorithm’s effectiveness. Similarly, the hierarchical clustering algorithm demonstrates commendable efficacy with an accuracy of 0.81. Although lower than K-means, the Calinski-Harabasz index at 222.72 still indicates satisfactory clustering performance. The silhouette coefficient of 0.45 and Davies-Bouldin index of 0.80, while reflective of moderate cluster quality, affirm the algorithm’s utility in parsing the dataset into meaningful groupings.
In contrast, the DBSCAN algorithm’s performance is notably less effective, with an accuracy of merely 0.09. This dramatically low accuracy, coupled with a Calinski-Harabasz index of 16.88, a negative silhouette coefficient of -0.19, and a high Davies-Bouldin index of 2.14, suggests that the algorithm struggled significantly with the Iris dataset. The negative silhouette score indicates a lack of cohesion and poor separation among the clusters identified. At the same time, the high Davies-Bouldin index signals proximity between clusters, further attesting to the algorithm’s suboptimal clustering on this dataset. These results underscore the varying suitability and effectiveness of different clustering algorithms for the Iris dataset, with K-means and hierarchical clustering algorithms outperforming DBSCAN under the conditions and metrics evaluated.
4.2 Algorithm Evaluation
The K-means algorithm is lauded for its operational simplicity and computational efficiency, making it an ideal candidate for clustering large datasets. Characterized by its iterative approach to optimizing cluster centers, K-means delivers high accuracy and a commendable silhouette coefficient when applied to the Iris dataset, indicating its effectiveness in segregating data into distinct, coherent clusters. However, this algorithm is not without its drawbacks. A primary concern is its sensitivity to the selection of initial cluster centers—a factor that can lead to varying results, undermining the repeatability of the clustering process. Furthermore, predetermining the number of clusters (K) poses a significant challenge, especially in datasets where the optimal cluster count is unclear. Additionally, K-means’ susceptibility to outliers can skew the clustering results, and its inherent assumption of convex cluster shapes restricts its applicability to datasets that feature non-convex clusters, highlighting a critical limitation in its versatility.
The hierarchical clustering algorithm offers a distinct approach capable of identifying non-convex clusters and adapting to the intricacies of complex datasets. Its methodology, which constructs a dendrogram to represent the clustering process, provides a detailed and hierarchical perspective on data segmentation. This visual representation and the algorithm’s flexibility in merging criteria allow for a tailored clustering experience. Despite these advantages, the hierarchical clustering algorithm faces specific challenges. Its sophistication can lead to overfitting on simpler datasets, such as the Iris dataset, where the algorithm’s complexity may not be warranted. The algorithm’s sensitivity to noise and outliers can further complicate the clustering process, leading to potentially inaccurate merges. Moreover, the irreversibility of its merging steps and the high computational demand, particularly with large datasets, present notable limitations to its scalability and efficiency.
Distinguished by its ability to determine the number of clusters without prior specification automatically, the DBSCAN algorithm emerges as a robust solution for datasets featuring clusters of arbitrary shapes and sizes. Its classification of data points into core, border, and noise points underlines its nuanced approach to data segmentation, offering resistance against noise and outlier interference. Nonetheless, DBSCAN’s effectiveness is heavily contingent on the appropriate setting of its two primary parameters: the neighborhood radius (eps) and the minimum number of samples (min_samples). Inaccurate parameterization can lead to the misclassification of data as noise, as demonstrated in its application to the Iris dataset, resulting in lower accuracy and silhouette scores. Moreover, the algorithm’s performance is sensitive to variations in data density, which can yield inconsistent clustering results. The computational complexity of O(n^2) further restricts its practicality for larger datasets, marking a significant challenge in leveraging DBSCAN’s full potential.
5 Summary
This study embarked on an exploration of clustering algorithms within the realm of machine learning, underlining their significant utility across various practical applications and delineating the challenges they confront. The literature review provided a foundational overview of prevalent clustering algorithms, such as the K-means, hierarchical clustering, and DBSCAN algorithms. Theoretical discussions introduced the Iris dataset and outlined the selected algorithms and the evaluation methodologies utilized in the experimental analyses.
The practical dimension of this research elucidated the experimental framework, showcased the visualizations of the clustering outcomes, and furnished the empirical data necessary for a thorough evaluation of the three algorithms under consideration. This empirical inquiry yielded insights that informed conclusions about each algorithm’s performance and its comparative efficacy. Through this comprehensive investigation, we have navigated the intricacies of clustering challenges in machine learning and proposed viable solutions to augment the performance and applicability of clustering algorithms for real-world scenarios.
Looking ahead, the future trajectory of clustering algorithm research promises exciting avenues for advancement. Key areas for forthcoming studies include the development of algorithms that boast enhanced efficiency and accuracy across varied data structures, integrating deep learning paradigms to bolster algorithmic robustness, and investigating clustering techniques tailored for multimodal data to accommodate increasingly complex information landscapes. Through persistent research and innovative exploration, clustering algorithms are poised for broader implementation and significant evolution, contributing indelibly to the field of machine learning.
References
[1]. R. Zhao, Z. Yang, D. Liang, and F. Xue, “Automated Machine Learning in the smart construction era: Significance and accessibility for industrial classification and regression tasks,” arXiv preprint arXiv:2308.01517, 2023.
[2]. M. I. Jordan and T. M. Mitchell, “Machine learning: Trends, perspectives, and prospects,” Science, vol. 349, no. 6245, pp. 255-260, 2015.
[3]. M. Z. Rodriguez et al., “Clustering algorithms: A comparative approach,” PloS one, vol. 14, no. 1, p. e0210236, 2019.
[4]. L. Cao, Z. Zhao, and D. Wang, “Clustering algorithms,” in Target Recognition and Tracking for Millimeter Wave Radar in Intelligent Transportation: Springer, 2023, pp. 97-122.
[5]. O. A. Abbas, “Comparisons between data clustering algorithms,” International Arab Journal of Information Technology (IAJIT), vol. 5, no. 3, 2008.
[6]. K. Krishna and M. N. Murty, “Genetic K-means algorithm,” IEEE Transactions on Systems, Man, and Cybernetics, Part B (Cybernetics), vol. 29, no. 3, pp. 433-439, 1999.
[7]. F. Murtagh and P. Contreras, “Algorithms for hierarchical clustering: an overview,” Wiley Interdisciplinary Reviews: Data Mining and Knowledge Discovery, vol. 2, no. 1, pp. 86-97, 2012.
[8]. K. Khan, S. U. Rehman, K. Aziz, S. Fong, and S. Sarasvady, “DBSCAN: Past, present and future,” in The fifth international conference on the applications of digital information and web technologies (ICADIWT 2014), 2014: IEEE, pp. 232-238.
[9]. A. Ng, M. Jordan, and Y. Weiss, “On spectral clustering: Analysis and an algorithm,” Advances in neural information processing systems, vol. 14, 2001.
[10]. C. Rasmussen, “The infinite Gaussian mixture model,” Advances in neural information processing systems, vol. 12, 1999.
[11]. Y. LeCun, Y. Bengio, and G. Hinton, “Deep learning,” nature, vol. 521, no. 7553, pp. 436-444, 2015.
Cite this article
Song,J. (2024). Research on clustering algorithms based on the Iris dataset. Applied and Computational Engineering,57,224-232.
Data availability
The datasets used and/or analyzed during the current study will be available from the authors upon reasonable request.
Disclaimer/Publisher's Note
The statements, opinions and data contained in all publications are solely those of the individual author(s) and contributor(s) and not of EWA Publishing and/or the editor(s). EWA Publishing and/or the editor(s) disclaim responsibility for any injury to people or property resulting from any ideas, methods, instructions or products referred to in the content.
About volume
Volume title: Proceedings of the 6th International Conference on Computing and Data Science
© 2024 by the author(s). Licensee EWA Publishing, Oxford, UK. This article is an open access article distributed under the terms and
conditions of the Creative Commons Attribution (CC BY) license. Authors who
publish this series agree to the following terms:
1. Authors retain copyright and grant the series right of first publication with the work simultaneously licensed under a Creative Commons
Attribution License that allows others to share the work with an acknowledgment of the work's authorship and initial publication in this
series.
2. Authors are able to enter into separate, additional contractual arrangements for the non-exclusive distribution of the series's published
version of the work (e.g., post it to an institutional repository or publish it in a book), with an acknowledgment of its initial
publication in this series.
3. Authors are permitted and encouraged to post their work online (e.g., in institutional repositories or on their website) prior to and
during the submission process, as it can lead to productive exchanges, as well as earlier and greater citation of published work (See
Open access policy for details).
References
[1]. R. Zhao, Z. Yang, D. Liang, and F. Xue, “Automated Machine Learning in the smart construction era: Significance and accessibility for industrial classification and regression tasks,” arXiv preprint arXiv:2308.01517, 2023.
[2]. M. I. Jordan and T. M. Mitchell, “Machine learning: Trends, perspectives, and prospects,” Science, vol. 349, no. 6245, pp. 255-260, 2015.
[3]. M. Z. Rodriguez et al., “Clustering algorithms: A comparative approach,” PloS one, vol. 14, no. 1, p. e0210236, 2019.
[4]. L. Cao, Z. Zhao, and D. Wang, “Clustering algorithms,” in Target Recognition and Tracking for Millimeter Wave Radar in Intelligent Transportation: Springer, 2023, pp. 97-122.
[5]. O. A. Abbas, “Comparisons between data clustering algorithms,” International Arab Journal of Information Technology (IAJIT), vol. 5, no. 3, 2008.
[6]. K. Krishna and M. N. Murty, “Genetic K-means algorithm,” IEEE Transactions on Systems, Man, and Cybernetics, Part B (Cybernetics), vol. 29, no. 3, pp. 433-439, 1999.
[7]. F. Murtagh and P. Contreras, “Algorithms for hierarchical clustering: an overview,” Wiley Interdisciplinary Reviews: Data Mining and Knowledge Discovery, vol. 2, no. 1, pp. 86-97, 2012.
[8]. K. Khan, S. U. Rehman, K. Aziz, S. Fong, and S. Sarasvady, “DBSCAN: Past, present and future,” in The fifth international conference on the applications of digital information and web technologies (ICADIWT 2014), 2014: IEEE, pp. 232-238.
[9]. A. Ng, M. Jordan, and Y. Weiss, “On spectral clustering: Analysis and an algorithm,” Advances in neural information processing systems, vol. 14, 2001.
[10]. C. Rasmussen, “The infinite Gaussian mixture model,” Advances in neural information processing systems, vol. 12, 1999.
[11]. Y. LeCun, Y. Bengio, and G. Hinton, “Deep learning,” nature, vol. 521, no. 7553, pp. 436-444, 2015.