


1. Introduction
Timber structures have cultural and architectural significance in many regions, and preserving their integrity during seismic events is imperative. The seismic vulnerability of timber structures is a multifaceted issue that includes factors such as material properties, connection details, and dynamic response characteristics. Understanding how these factors affect the failure modes of timber structures is critical to enhancing their seismic performance and ensuring occupant safety. Takanori and Yasutoshi investigated the fatigue behavior of structural plywood under cyclic panel shear loads at different frequencies in 2006. It found that higher loading frequencies resulted in slower damage accumulation and improved fatigue life at stress levels above 0.5, leading to the development of a new qualitative fatigue failure model for plywood specimens based on these findings [1]. Research at the University of Canterbury presents a seismic-resistant system for multi-story timber buildings using post-tensioned Laminated veneer lumber wall panels coupled with plywood sheets. The study found that primary energy dissipation occurred through nail yielding in plywood connections, resulting in minimal structural damage and deformation, making the system a promising alternative for seismic-resistant construction with easy post-earthquake repair [2]. A couple of years ago, Zhaoqiang, Yong, and Shengqiang analyzed oscillating twisted plywood. By modeling crack titling of the material, they found that at a certain pitch angle, the oscillated/ twisted plywood exhibits maximum high stiffness, high fracture toughness, and low density [3]. The Korean Society of Ocean Engineers evaluated the shear behavior of plywood with two different thicknesses from room temperature to cryogenic temperature. The result suggested that plywood temperature decreases, yield strain decreases, and shear strength and elastic modulus increase [4]. Using ABAQUS, this study aims to comprehensively model timber structures subjected to seismic loads, allowing a detailed examination of deflection, and maximum stress distributions.
2. Four-Point Bending Experient of Plywood and Conducting Its Material Property
The most common construction wood material is plywood. To recognize the material properties of plywood, a plywood beam was used to conduct a stress-strain experiment at a material lab course at the University of Dayton. According to Standard Test Methods for Small Clear Specimens of Timber (ASTM D143-52), the size of the specimen shall not be less than 0.025 meters by 0.025 meters by 0.41 meters to study the behavior of wood in bending [5]. The experiment used an Electro-Mechanical Tension and Compression Testing Machine using a four-point loading, controller, and data acquisition system. The test machine can apply a load of 300kN and a loading speed of 0.00846666m/s. The beam has a length of 0.4572 meters, a width of 0.0883666 meters, a height of 0.0376682 meters, and a mass density of 500 \( \frac{kg}{{m^{3}}} \) . The method of this experiment is a four-point flex device with a spacing of 0.1524 meters to record the strength and deflection of the wood until fracture mode, as shown in Figure 1.
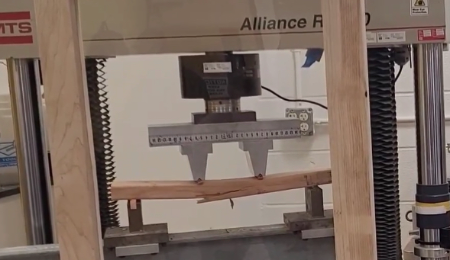
Figure 1. Plywood Beam Four-Point Bending Experiment Apparatus
The beam is inserted into the device and ensures that the device has contacted the beam surface, then zeros the load setting. The apparatus began to apply loads at a constant increasing rate to compress the specimen until fracture mode occurred. The load distribution of the beam can be carried in a four-point bending all the way to rupture was recorded and a shear failure mode appeared at the middle bottom part of the beam. The experiment recorded the extension and applied load data. Applying Common States of Stress:
\( σ=\frac{{F_{t}}}{{A_{o}}}\ \ \ (1) \)
Where \( σ \) is tensile stress, \( {F_{t}} \) is the load applied on the specimen, and \( {A_{o}} \) is the original area before loading.
Using Engineering Tensile Strain:
\( ε=\frac{δ}{{L_{0}}}\ \ \ (2) \)
where \( ε \) is strain, \( δ \) is the extension after loading, and \( {L_{0}} \) is the original height of the specimen before loading.
Utilizing empirical evidence, the spatial patterns of stress and strain within the sample are delineated. Employing the obtained stress configuration and deformation profile, the stress-strain relationship for the specimen is illustrated as demonstrated in Figure 2.
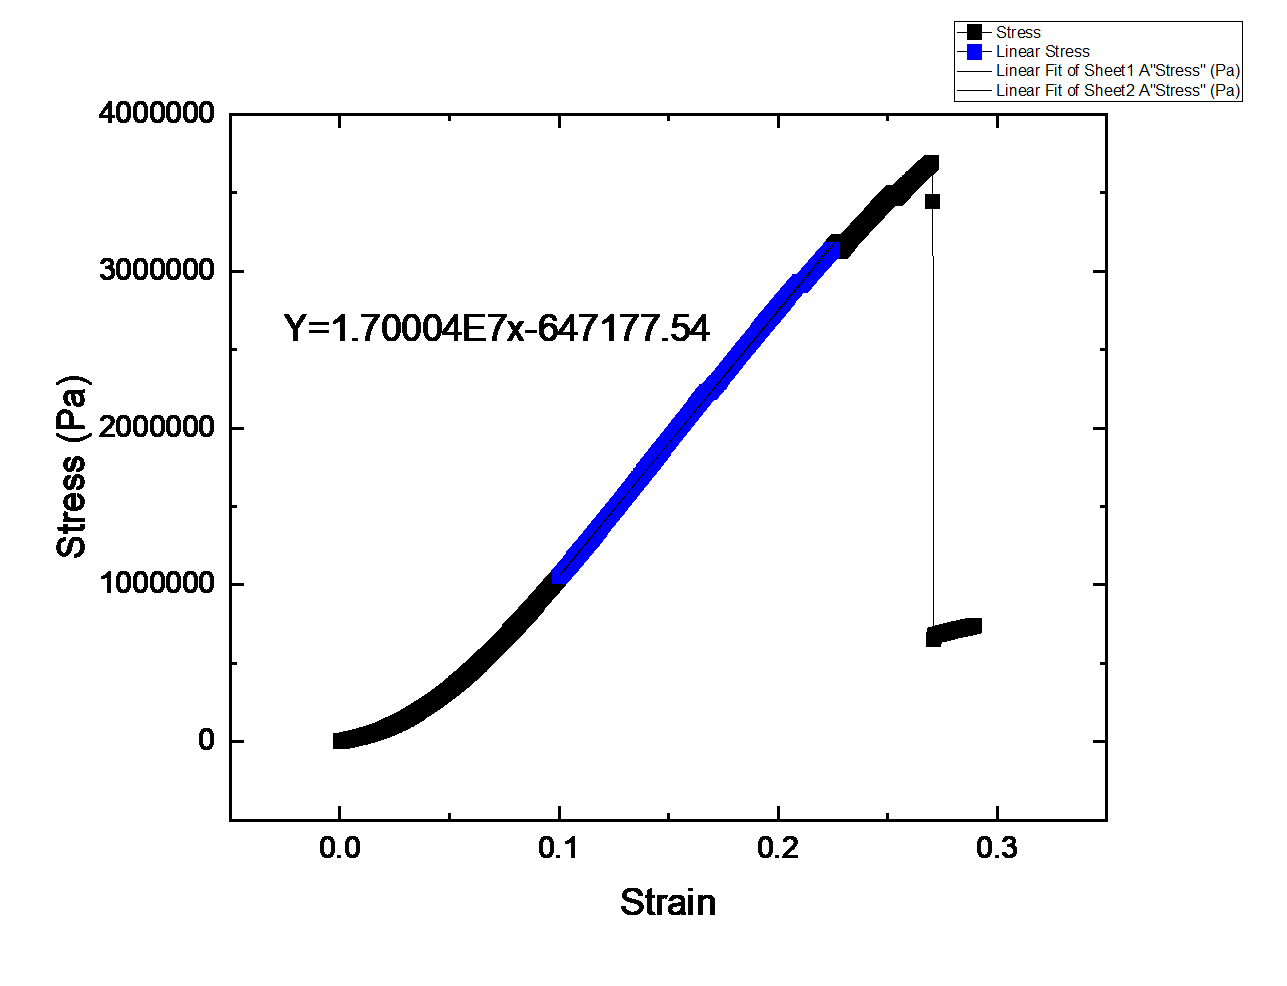
Figure 2. Stress-Strain Relationship of Plywood
The initial elastic is defined as the linear portion in the stress-strain relationship. According to Hooke’s Law:
\( σ=Eε\ \ \ (3) \)
where \( σ \) is stress, E is Modulus of Elasticity also known as Young’s Modulus, and \( ε \) is strain.
Young’s modulus of plywood is determined. Extracting the data from the linear portion of the relationship and applying the linear fitting function, the slope would be calculated which is Young’s modulus of this material as shown in Figure 2. As a result, the initial elasticity of this plywood has Young’s modulus of \( 1.70004×1{0^{7}} \) Pa. According to the Study of Bending Strength and Numerical Modeling of Wooden and Plywood Frame Elements, the Poisson ratio of plywood is 0.3 [6]. The peak elastic pressure of this material ascends to a colossal value of 3137364Pa. Should the calculated stress during the simulation surpass this maximum elastic stress, fracture or damage of the plywood material becomes inevitable.
3. Finite Element Model of Plywood House
The present study harnesses the capabilities of nonlinear finite element methodologies to construct a comprehensive finite element model of two-and-a-half-story plywood structures. This two-and-a-half-story residential model encompasses a base area of 19 square meters and an overall height of 10 meters, as illustrated in Figure 3.
|
|
(a) Front and Left View | (b) Right and Rear View |
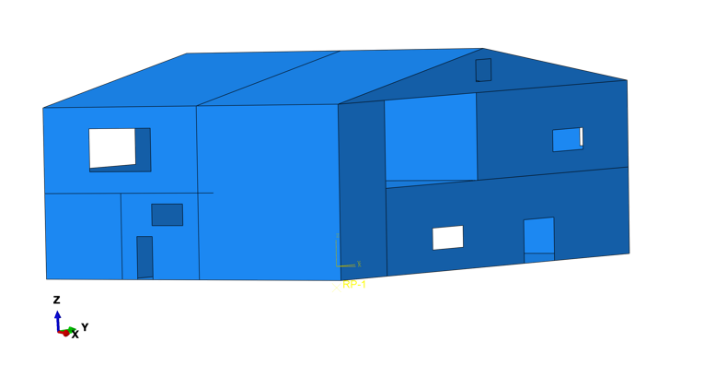
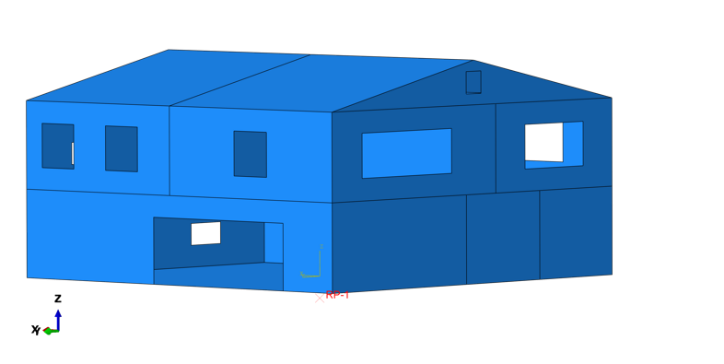
Figure 3. Finite Model of Plywood House Structure
Also, a rigid flat shell is created, and it is a 380-meter square shell, representing the ground base. The house is placed in the center of the foundation as the initial position shown in Figure 4.
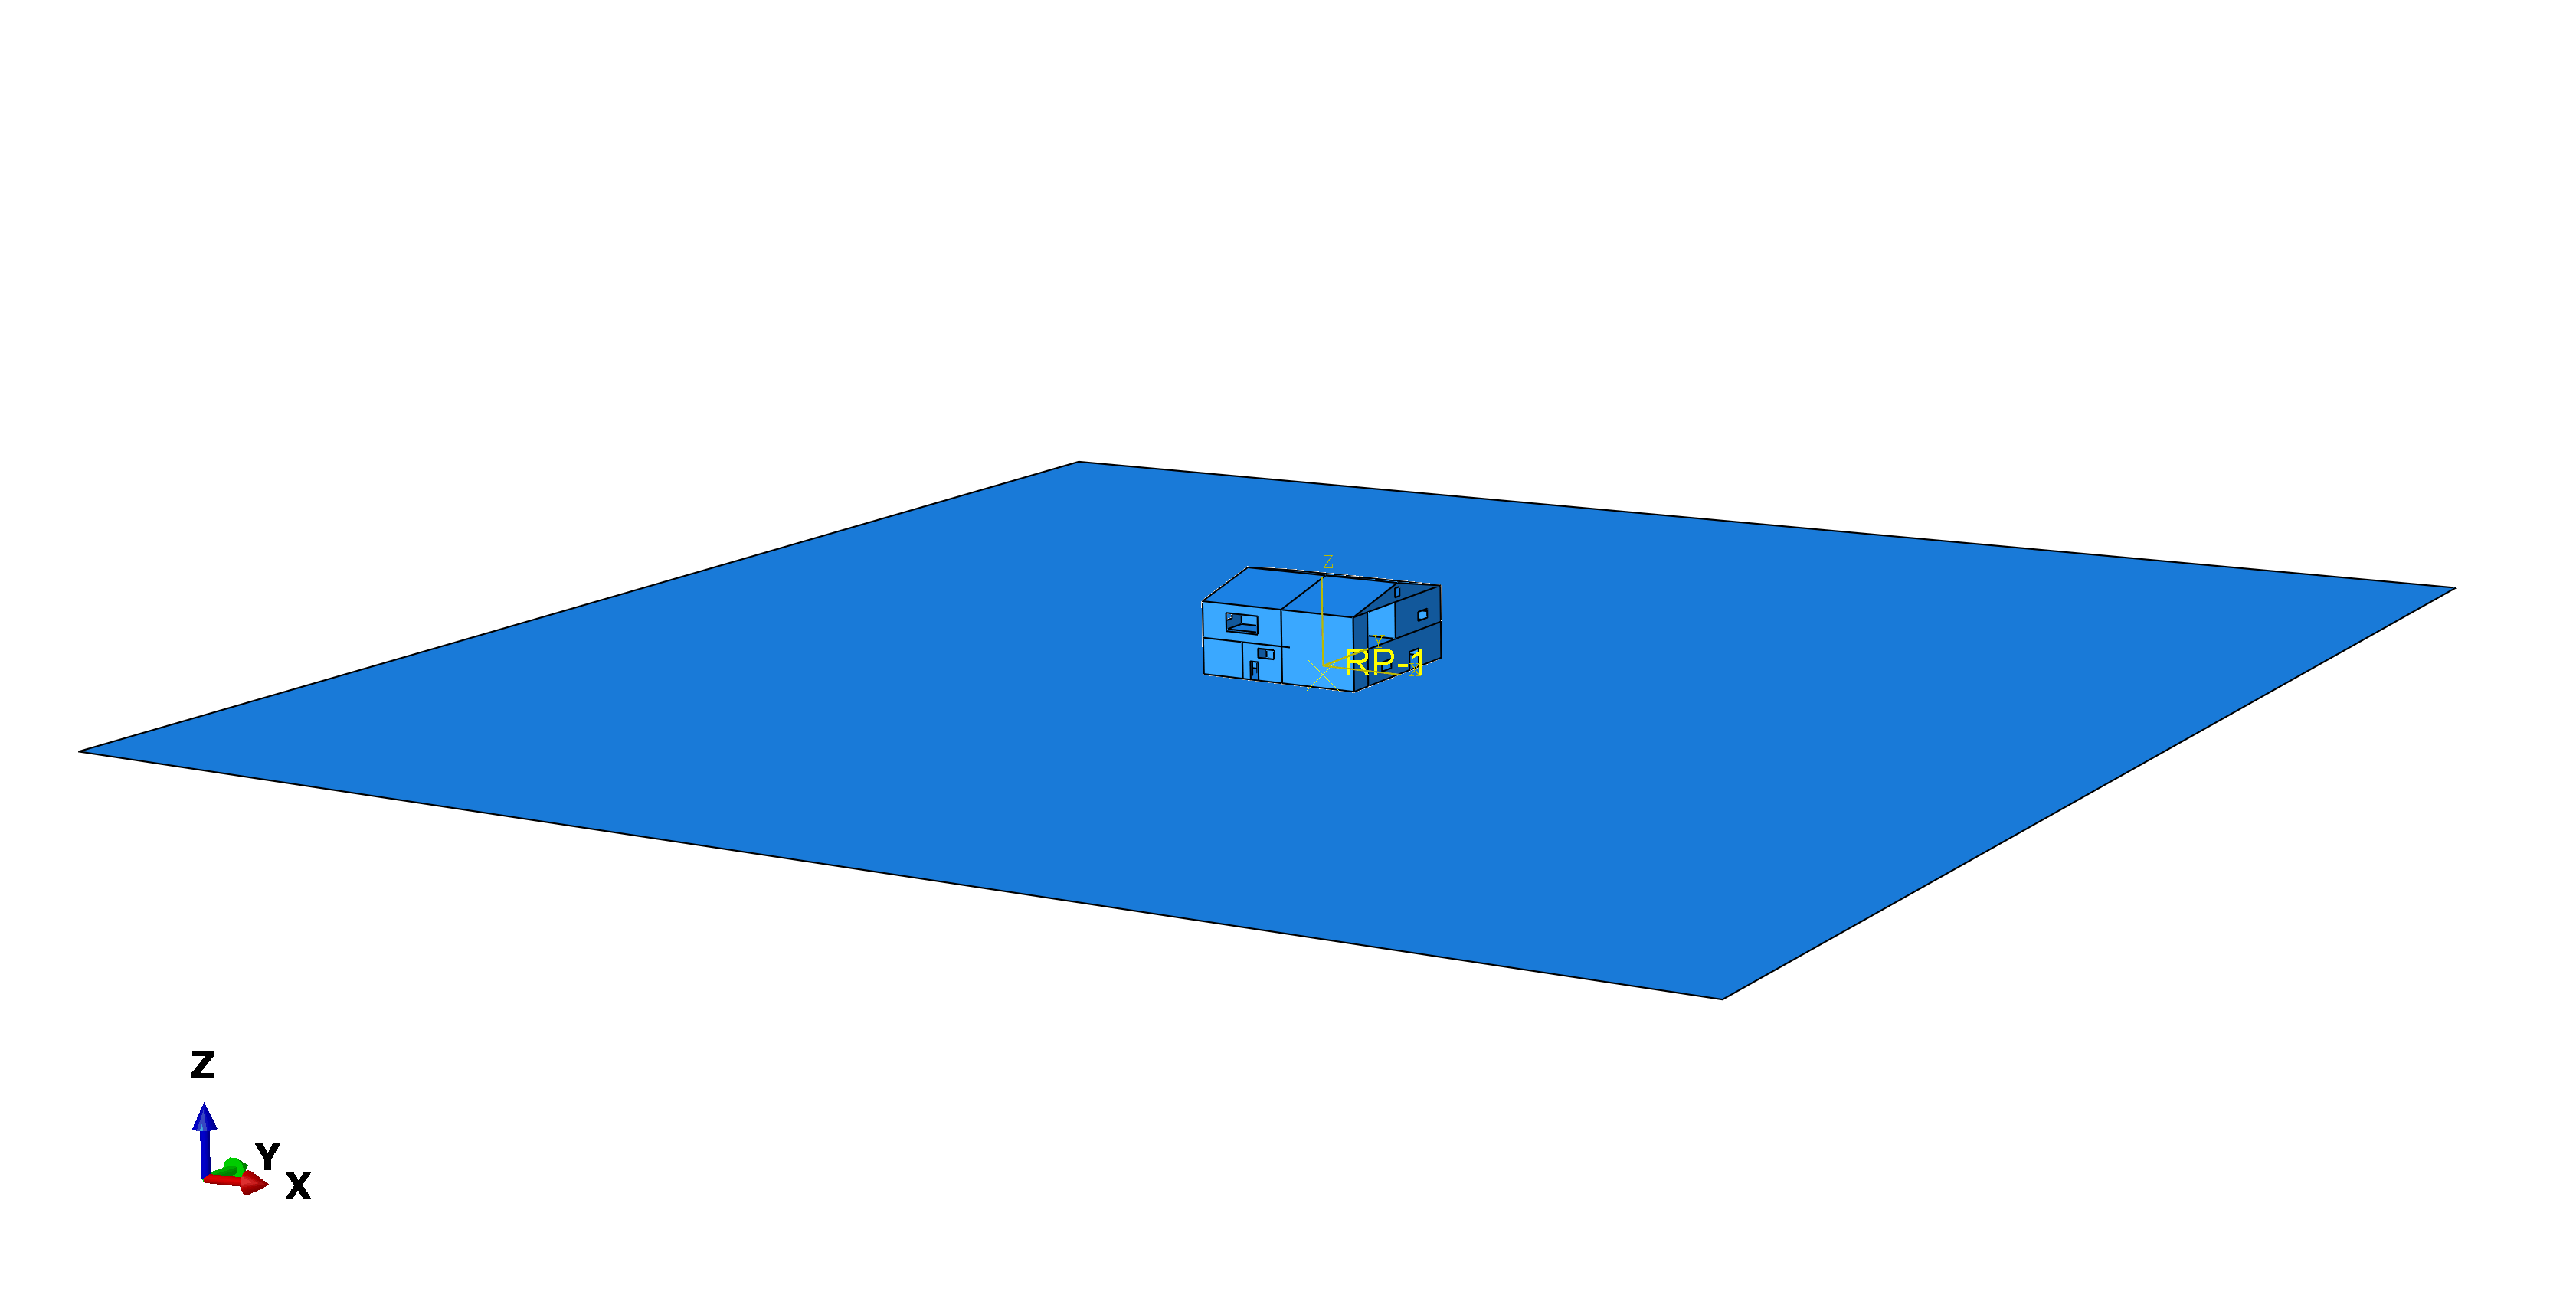
Figure 4. Plywood Structure Analysis Model
All shell elements are defined at a thickness of 0.05 meters. An earthquake bionics motion is assigned to the ground base. The bionics motion requires the ground base to move five steps. In the first step, the ground base moves vertically downward for half a unit of time. Second, the ground base moves vertically upward one unit from the first step. Third, the ground base moves vertically downward one unit of time from the previous one. Fourth, the ground base moves vertically upward one unit of time from the previous one. Finally, the ground base moves vertically downward half a unit of time back to the initial position. Assigning this simulated motion to different velocities, the maximum stress is recorded for fracture analysis.
4. Result and Discussion
This paper tests the deflection of the house structure with five seismic velocities. The elements, which are marked red, state where the maximum stress of the structure exists in this scenario. They are the most dangerous elements in the entire structure, which means that fracture or rupture would occur first in the entire structure. Compared to the maximum stress the material can carry around, the maximum stress in these tests can determine fractures that occur in these dangerous places of the structure.
The first test performed the deflected house structure on simulated seismic motion with a velocity of 0.5m/s. The deflection of the house is shown in Figure 5.
|
|
Left and Front View | Right and Rear View |
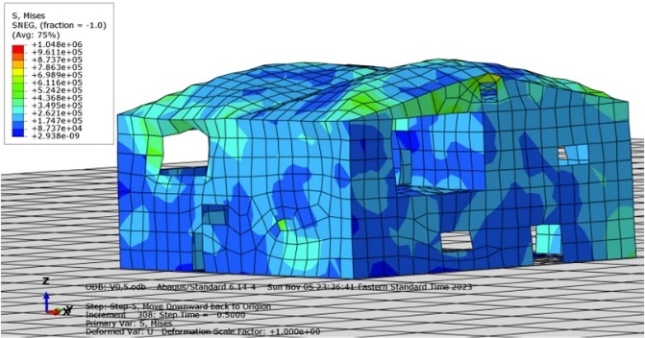
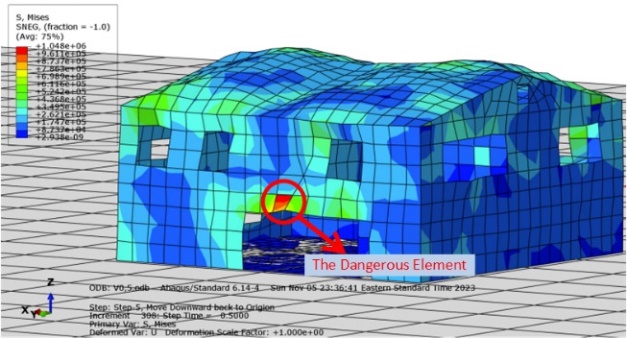
Figure 5. Deflection of Plywood Structure after Seismic Movement of 0.5m/s
In Figure 5, the structure suffers a small degree of deflection. The shape of the structure remains almost the same as the original. The deflection is performed only on the roof part of the house. The center of the roof begins to sink. The bottom part of the structure is in shape. The yield is now only acting on the roof and the upper part of the structure.
In this test, the red element, which is the most dangerous element in the structure, is in the floor-to-ceiling window on the first floor of the structure shown in Figure 5(b). Since the upper levels of the structure began to deflect due to seismic movement, this element is contained in a large amount of stress because there is no support for this element. Extract the results from the ABAQUS calculation as shown in Figure 6, the maximum stress is 988708Pa and the maximum strain is 0.078545. Compared to the maximum stress of plywood of 3137364Pa, the maximum stress in this trial does not exceed the stress value of plywood. In other words, the structure would stand well during this seismic movement, because the maximum stress created by this movement is much smaller than the maximum stress of plywood property. Fracture does not occur in this test, and the house can survive this seismic movement.
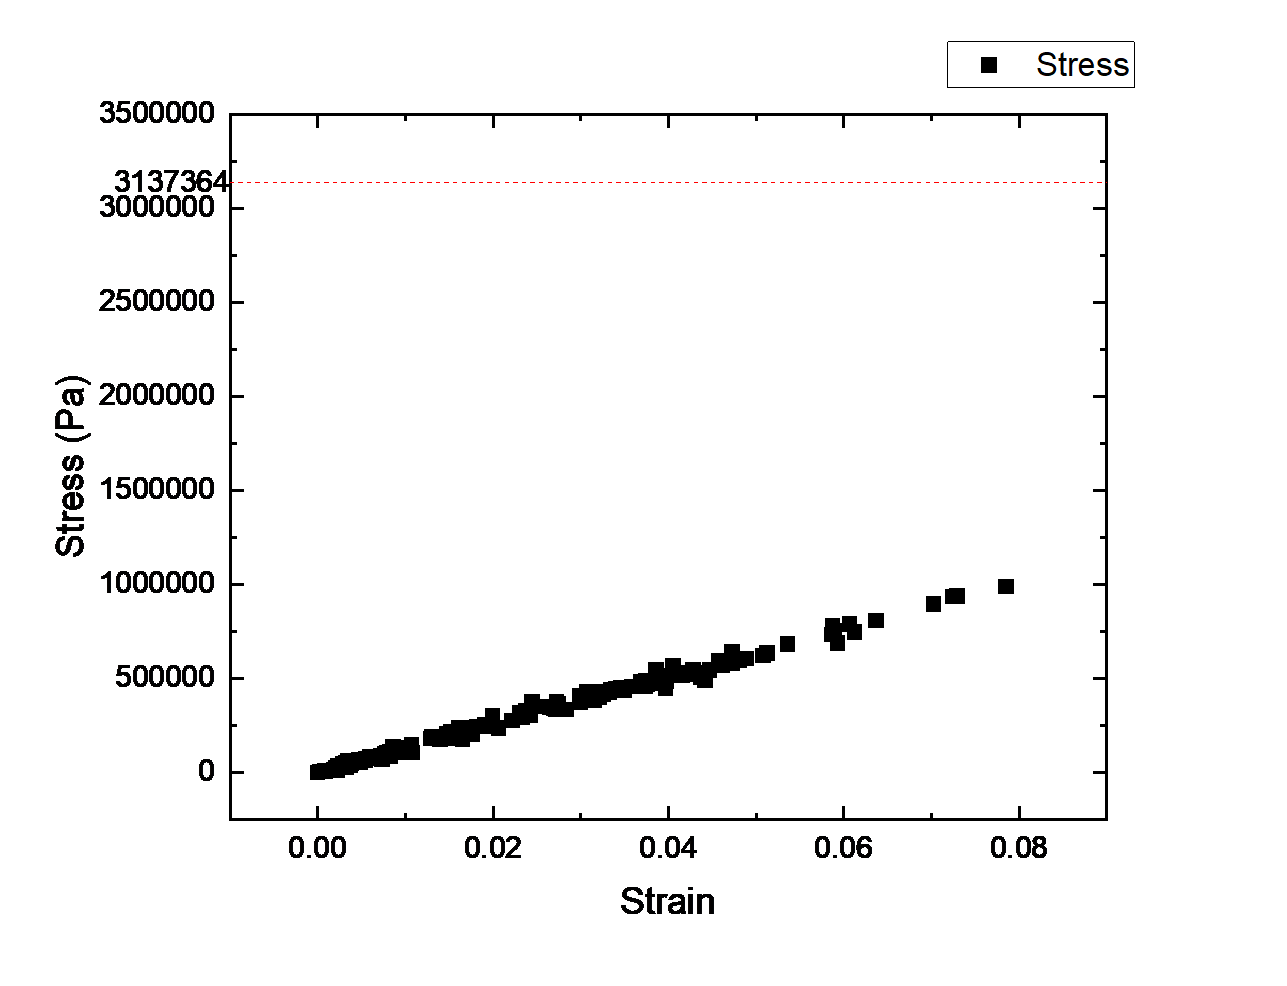
Figure 6. Stress-Strain Relationship in Seismic Movement with Velocity of 0.5m/s
The second test performed the deflected structure of the house on simulated seismic movement with a velocity of 1m/s. The deflection of the house is shown in Figure 7.
|
|
(a) Left and Front View | (b) Right and Rear View |
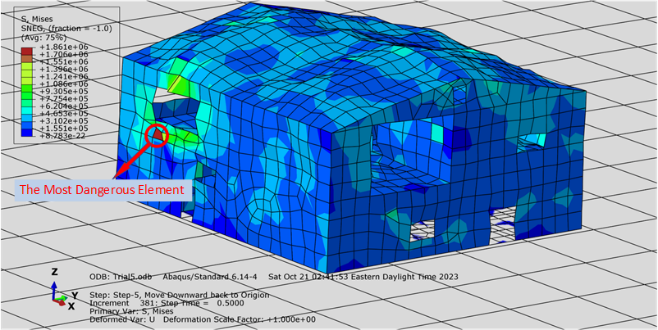
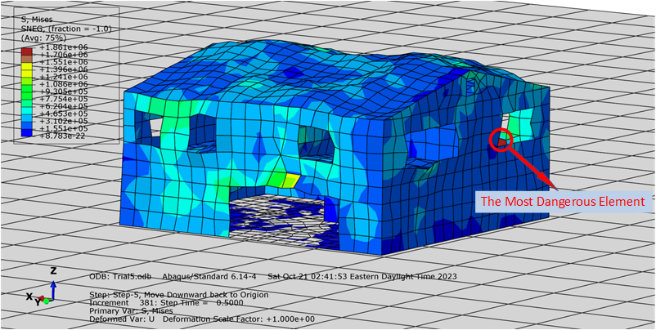
Figure 7. Deflection of Plywood Structure after Seismic Movement of 1m/s
The structure suffers a moderate degree of deflection. The roof of the house has been depressed a lot. The roof is hollow. All elements of the structure have some deflection. The elements around the second-floor window have been extended and deflected a lot. And the second-floor base is caving in and hollowing out. It is easy to say that all the elements around the window caused a lot of deflection. The elements just above the floor-to-ceiling window on the first floor have been extended a lot. Some elements of the ground base of the house have yielded and buckled.
In this test, the red element is located on the exterior wall and just below the medium-sized window on the second floor in Figure 7(b). In the ABAQUS program, the stress and strain correspond with the time unit as shown in Figure 8. The maximum stress and strain values that occur during this seismic movement are extracted. The maximum stress of the structure is 1145018Pa and the maximum strain of the structure is 0.091363. Compared to the maximum stress of the plywood property, the maximum stress created to the structure during this seismic velocity does not exceed the plywood property. Even if the element is marked red, it is only defined that this place is the most dangerous place of structure, and it is possible to create rupture if the stress exceeds the maximum value of the material. Since the stress in this scenario is under control, the element should be fine, and no fracture occurs during this movement. The structure has deflection, but the structure can survive this seismic movement.
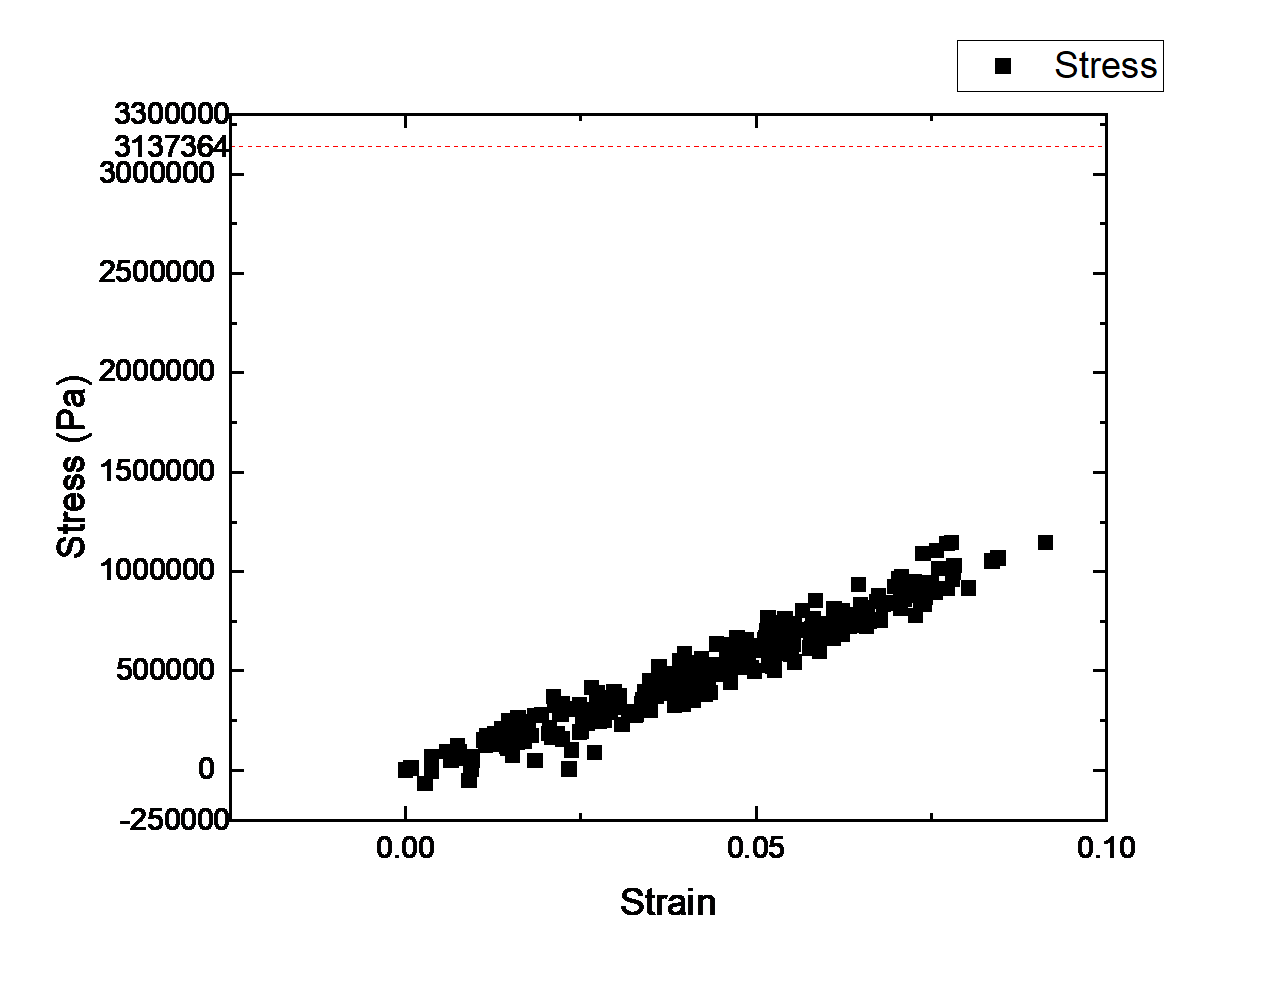
Figure 8. Stress-Strain Relationship in Seismic Movement with Velocity of 1m/s
The third test performed the deflected house structure on simulated seismic motion with a velocity of 1.5m/s. The deflection of the house is shown in Figure 9.
|
|
Left and Front View | Right and Rear View |
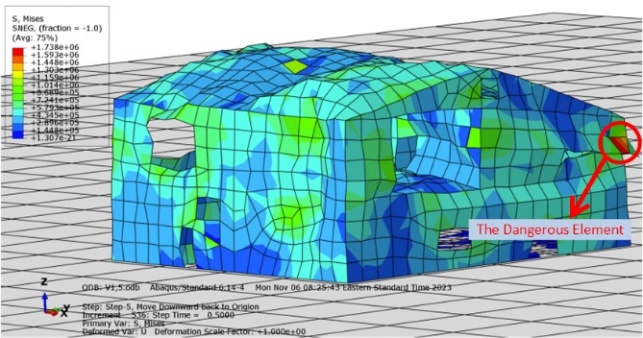
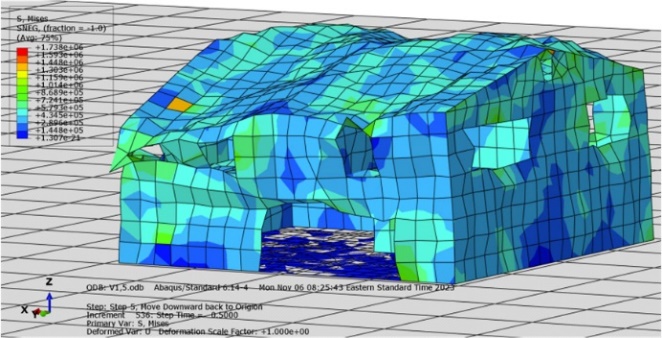
Figure 9. Deflection of Plywood Structure after Seismic Movement of 1.5m/s
The structure suffers a great deal of deflection. The upper level of the structure begins to sink and buckle. The shape of the structure cannot retain the original shape of the house. The left corner in Figure 9(a) almost collapsed. The bottom level of the structure begins to deflect seismic movement.
In this test, the most dangerous element is located on the left corner of the second floor in Figure 9(a). From the results presented on the ABAQUS application, the maximum stress and maximum strain correlated to the unit of time extracts as shown in Figure 10. The maximum stress output in this case is 2472672Pa and the maximum strain is 0.135221. Compared to the maximum stress of plywood, this structure does not exceed the maximum stress value of plywood property. However, it is closer to the maximum value the material can contain. The structure has some collapse modes. The structure may almost reach the edge of fracture mode.
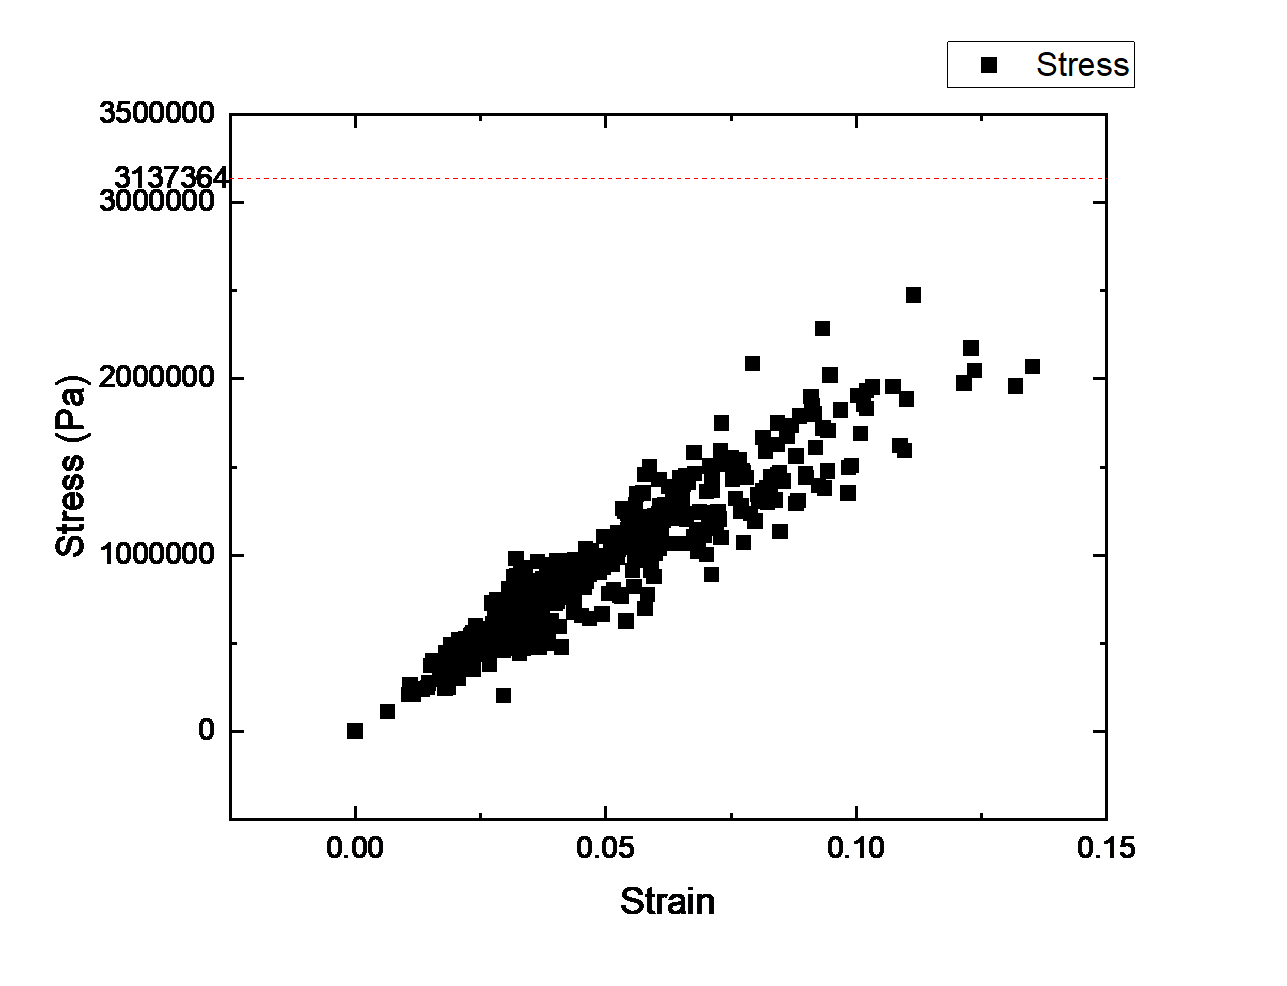
Figure 10. Stress-Strain Relationship in Seismic Movement with Velocity of 1.5m/s
The fourth test performed the deflected structure of the house on simulated seismic movement with a velocity of 2m/s. The deflection of the house is shown in Figure 11.
|
|
|
(a) Rear and Left Sides External | (b) Front and Right Sides External | (c) Cross Section Internal |
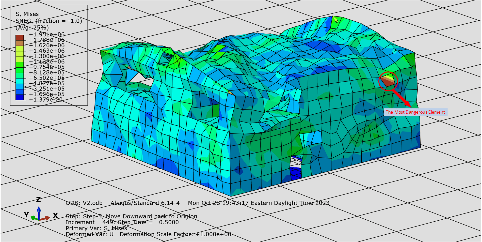
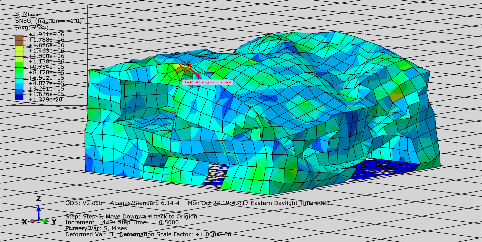
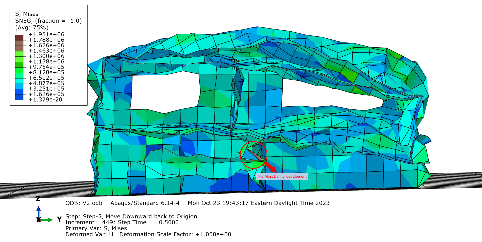
Figure 11. Deflection of Plywood Structure After Seismic Movement of 2m/s
Half side of the structure has collapsed in this scenario. In Figure 11(b), the right side of the structure has badly collapsed because it is located above the main door on the first floor. Since there is no large support to the higher level, the higher would be deflected and hollow during the seismic movement. Additionally, a red color element is in the vertical supportive wall where the maximum stress exists, it is very possible that rupture occurred in that element. In this scenario, more than one element is colored red, which means these are all the most dangerous elements where the maximum stress occurs among the entire structure. Two red-marked elements are located at the connection between the roof and the appearance wall. Two of them are located at the vertical supportive wall at the center of the first floor. Another one is located at the second-floor base.
In the ABAQUS program, the maximum values of stress and strain during this seismic movement have been extracted from the entire analysis as shown in Figure 12. The maximum stress the structure acquired is 3165384Pa, and the maximum strain is 0.259451. The seismic simulation model with a velocity of 2m/s has five red elements. The maximum stress is 3165384Pa. From maximum stress, the material property may contain 3137364Pa. The maximum stress obtained in this scenario exceeds the maximum stress of the material property. Failure mode occurred in this scenario, which is why half of the structure collapsed. The red elements have cracks in them. As a result, the structure does not survive this seismic movement.
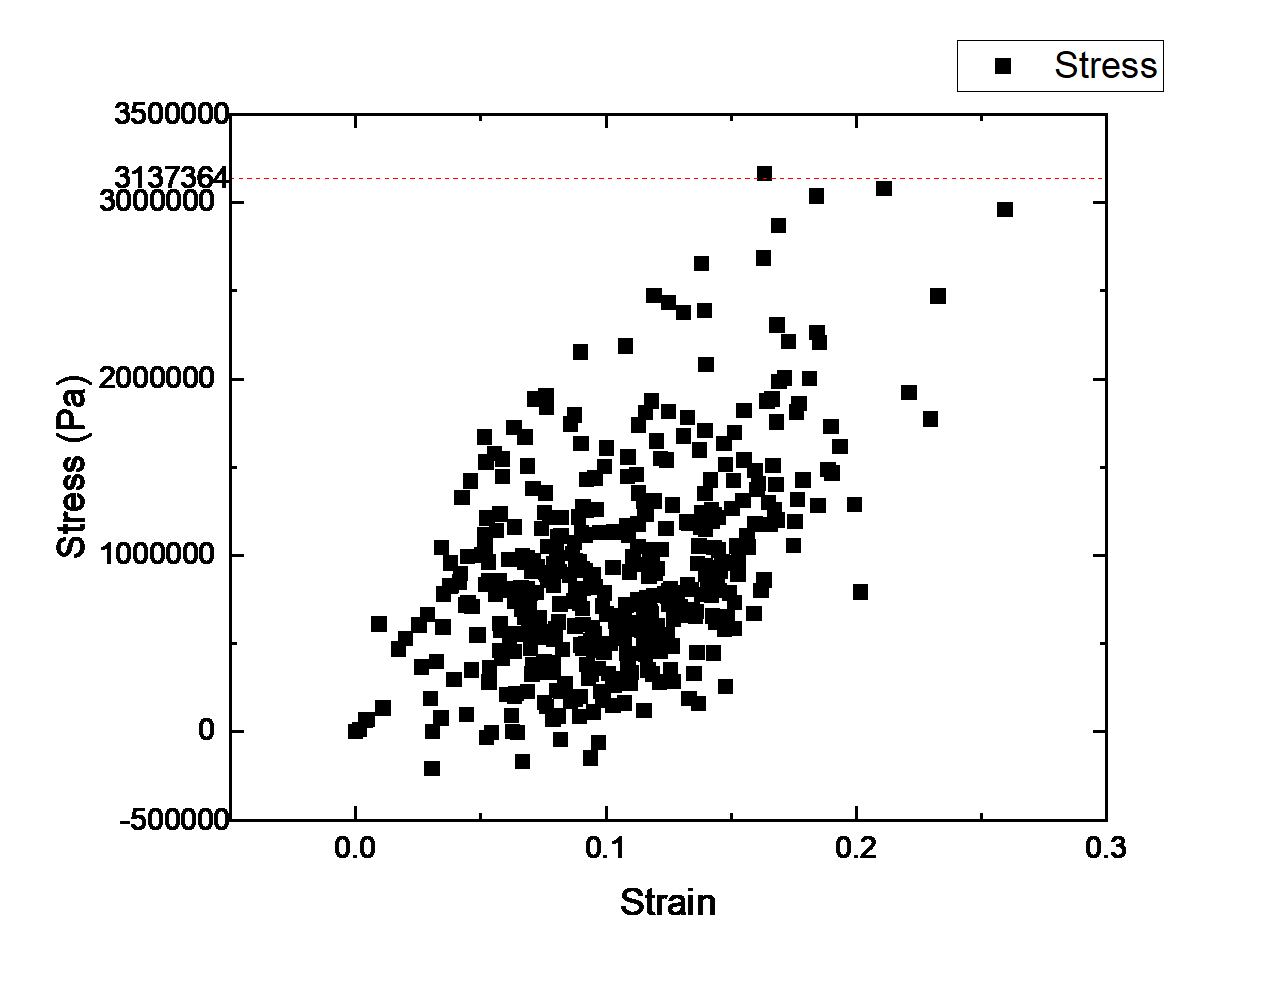
Figure 12. Stress-Strain Relationship in Seismic Movement with Velocity of 2m/s
The fifth test performed the deflected house structure on simulated seismic motion with a velocity of 2.5m/s. The deflection of the house is shown in Figure 13.
|
|
Left and Front View | Right and Rear View |
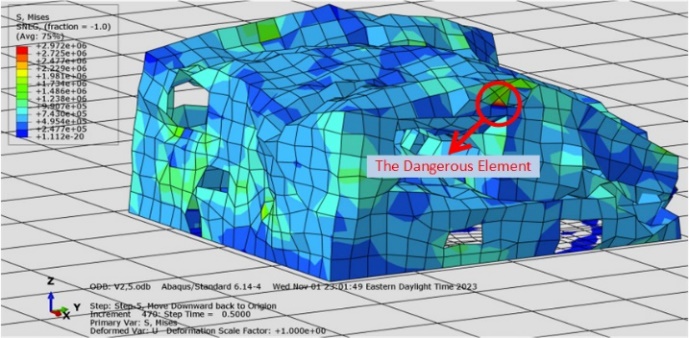
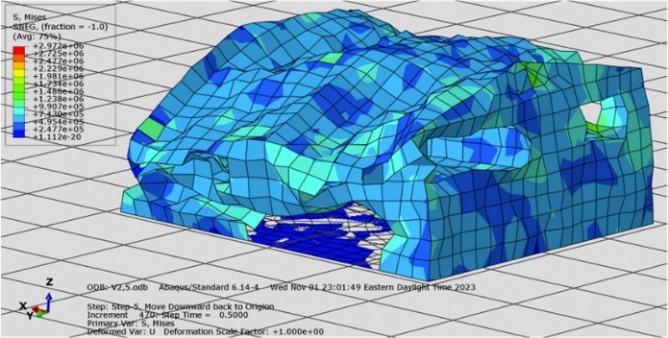
Figure 13. Deflection of Plywood Structure after Seismic Movement of 2.5m/s
The structure of this trial has already collapsed. The right corner as shown in Figure 13(b) collapsed to the first floor. The structure cannot stand during this seismic movement. Even the rest of the corner of the structure remains standing as shown in Figure 13, the structure is shaky. If the seismic movement acts for a little longer, the entire structure will fracture and be damaged. The most dangerous element in this case is located near the window at the roof level as shown in Figure 13(a). Since the corner connecting the front exterior wall and the right exterior wall collapses, all the stress would shift to the upper level next to where it collapsed. Extract the maximum stress and strain during this seismic movement from the ABAQUS application as shown in Figure 14, the maximum stress is 6353517Pa and the maximum strain is 0.324717. Compared to the maximum stress of plywood, the maximum stress developed in this case is much higher than the maximum stress the material can contain. The structure is fractured and damaged. The house collapsed during the earthquake. The material is not able to conduct well in this seismic movement.
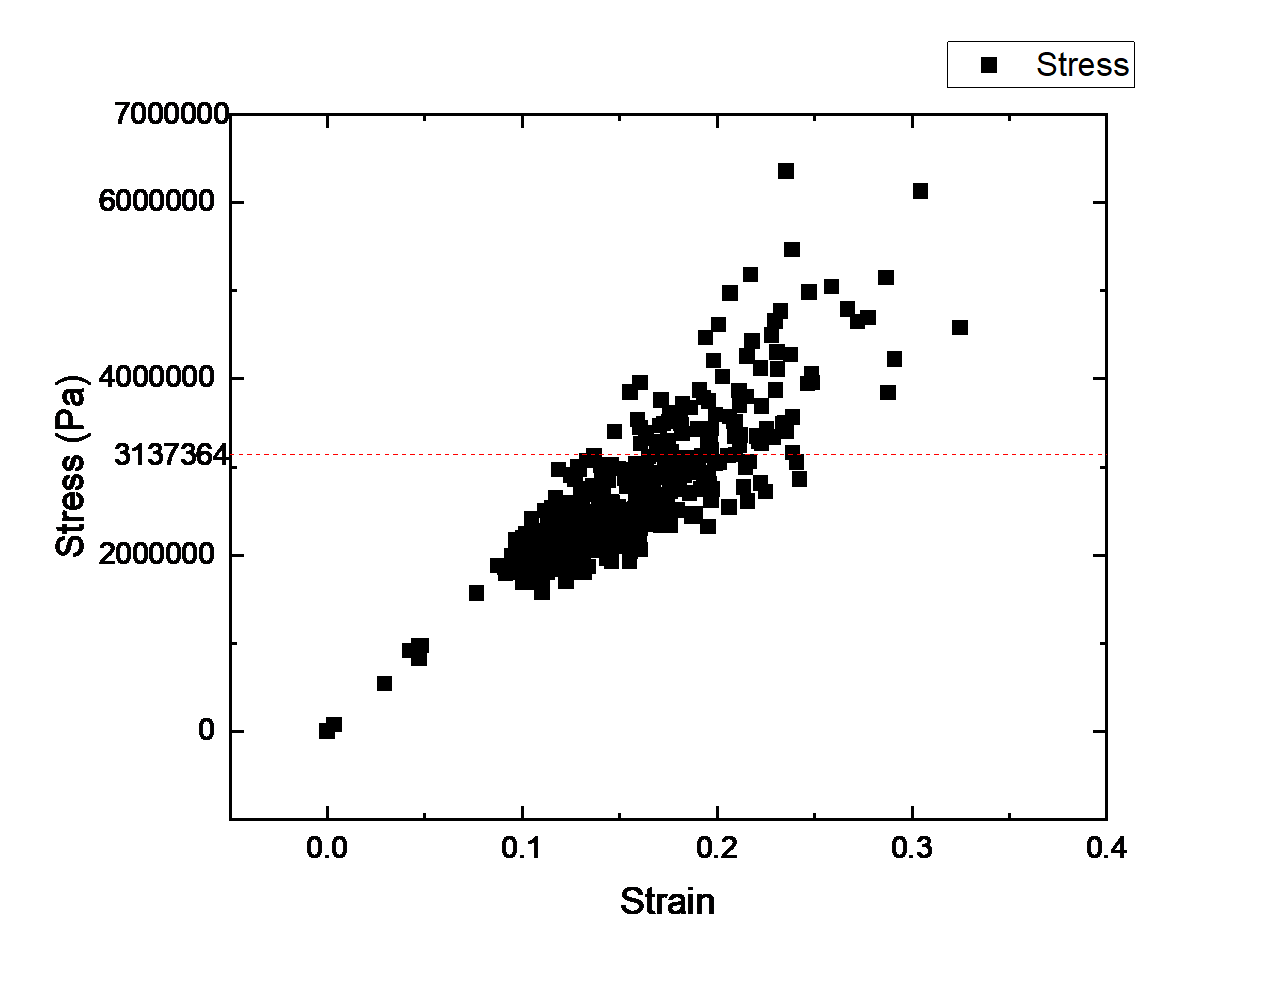
Figure 14. Stress-Strain Relationship in Seismic Movement with Velocity of 2.5m/s
Observing deflection for different seismic movements, the weakest points of this structure are the center of the roof and the corner between the front exterior wall and the right exterior wall. The deflection appeared on the roof at the first test, when the seismic movement had a velocity of 0.5m/s. Later, the stress shifts from the center of the roof to the front right corner of the house with increased velocities of seismic movements. The major deflection shifted to this corner after seismic movements reached a velocity of 1.5m/s. When the seismic movement has a velocity of 2m/s, the developed stress is higher than the material can contain, and the house begins to fracture and be damaged.
5. Conclusion
Plywood offers an economical option, readily available within the construction sector. Nevertheless, during an incidence of certain seismic actions, it may fracture and undergo destruction. Within this study, a meticulous analysis was undertaken to examine the structural deflection and seismic response at five distinct velocities. Applying ABAQUS finite element simulation, the ultimate deflection and peak stress, endured by the tested structure, are illustrated in the present data. Increased velocities in seismic motions result in the roof initially deflecting, subsequently shifting strain and stress to the building’s front right corner. Notably, the onset of structural fracture and damage emerges once seismic action reaches a velocity of 2m/s because the maximum developed stress exceeds that of the plywood itself. Consequently, it becomes imperative that the maximum seismic movement velocity does not exceed 2m/s for the plywood construction to endure potential earthquakes performed in this scenario.
References
[1]. Sugimoto T and Sasaki Y 2006 Effect of Loading Frequency on Fatigue Life and Dissipated Energy of Structural Plywood Under Panel Shear Load Wood Sci Technol 40 501–15 https://doi.org/10.1007/s00226-006-0080-y
[2]. Iqbal A, Fragiacomo M, Pampanin S and Buchanan A 2018 Seismic Resilience of Plywood-coupled LVL Wall Panels Engineering Structures 167 750–9 https://doi.org/10.1016/ j.engstruct.2017.09.053
[3]. Song Z, Ni Y and Cai Y 2019 Fracture Modes and Hybrid Toughening Mechanisms in Oscillated/Twisted Plywood Structure Acta Biomaterialia 91 284–93 https://doi.org/ 10.1016/j.actbio.2019.04.047
[4]. Son Y, Kim J, Oh H, Kim Y, Park S and Lee J 2019 Analysis of Shear Behavior and Fracture Characteristics of Plywood in Cryogenic Environment Journal of Ocean Engineering and Technology 33 394–9 https://doi.org/10.26748/ksoe.2019.048
[5]. American Society for Testing Materials 2022 Standard Test Methods for Small Clear Specimens of Timber American Society for Testing and Materials 04.10 4-7 https://doi.org/10.1520/d0143-22
[6]. Akgul T, Apay A, Aydin E and Sumer Y 2015 Study of Bending Strength and Numerical Modeling of Wooden and Plywood Frame Elements Acta Physica Polonica A 127 1414–16 https://doi.org/10.12693/aphyspola.127.1414
Cite this article
Li,N. (2024). Seismic resistance analysis of a plywood house structure based on ABAQUS fracture mechanics. Applied and Computational Engineering,61,200-209.
Data availability
The datasets used and/or analyzed during the current study will be available from the authors upon reasonable request.
Disclaimer/Publisher's Note
The statements, opinions and data contained in all publications are solely those of the individual author(s) and contributor(s) and not of EWA Publishing and/or the editor(s). EWA Publishing and/or the editor(s) disclaim responsibility for any injury to people or property resulting from any ideas, methods, instructions or products referred to in the content.
About volume
Volume title: Proceedings of the 4th International Conference on Materials Chemistry and Environmental Engineering
© 2024 by the author(s). Licensee EWA Publishing, Oxford, UK. This article is an open access article distributed under the terms and
conditions of the Creative Commons Attribution (CC BY) license. Authors who
publish this series agree to the following terms:
1. Authors retain copyright and grant the series right of first publication with the work simultaneously licensed under a Creative Commons
Attribution License that allows others to share the work with an acknowledgment of the work's authorship and initial publication in this
series.
2. Authors are able to enter into separate, additional contractual arrangements for the non-exclusive distribution of the series's published
version of the work (e.g., post it to an institutional repository or publish it in a book), with an acknowledgment of its initial
publication in this series.
3. Authors are permitted and encouraged to post their work online (e.g., in institutional repositories or on their website) prior to and
during the submission process, as it can lead to productive exchanges, as well as earlier and greater citation of published work (See
Open access policy for details).
References
[1]. Sugimoto T and Sasaki Y 2006 Effect of Loading Frequency on Fatigue Life and Dissipated Energy of Structural Plywood Under Panel Shear Load Wood Sci Technol 40 501–15 https://doi.org/10.1007/s00226-006-0080-y
[2]. Iqbal A, Fragiacomo M, Pampanin S and Buchanan A 2018 Seismic Resilience of Plywood-coupled LVL Wall Panels Engineering Structures 167 750–9 https://doi.org/10.1016/ j.engstruct.2017.09.053
[3]. Song Z, Ni Y and Cai Y 2019 Fracture Modes and Hybrid Toughening Mechanisms in Oscillated/Twisted Plywood Structure Acta Biomaterialia 91 284–93 https://doi.org/ 10.1016/j.actbio.2019.04.047
[4]. Son Y, Kim J, Oh H, Kim Y, Park S and Lee J 2019 Analysis of Shear Behavior and Fracture Characteristics of Plywood in Cryogenic Environment Journal of Ocean Engineering and Technology 33 394–9 https://doi.org/10.26748/ksoe.2019.048
[5]. American Society for Testing Materials 2022 Standard Test Methods for Small Clear Specimens of Timber American Society for Testing and Materials 04.10 4-7 https://doi.org/10.1520/d0143-22
[6]. Akgul T, Apay A, Aydin E and Sumer Y 2015 Study of Bending Strength and Numerical Modeling of Wooden and Plywood Frame Elements Acta Physica Polonica A 127 1414–16 https://doi.org/10.12693/aphyspola.127.1414